

Five consecutive bearish candles on the gold monthly chart. Still, the reason I go long
Start with the conclusion.
Right now, on gold, I’m viewing it with a long-bias.
However, I won’t go all-in. I’ll take a thin, staggered approach and pick up positions gradually.
I will lay out the reasons in order.
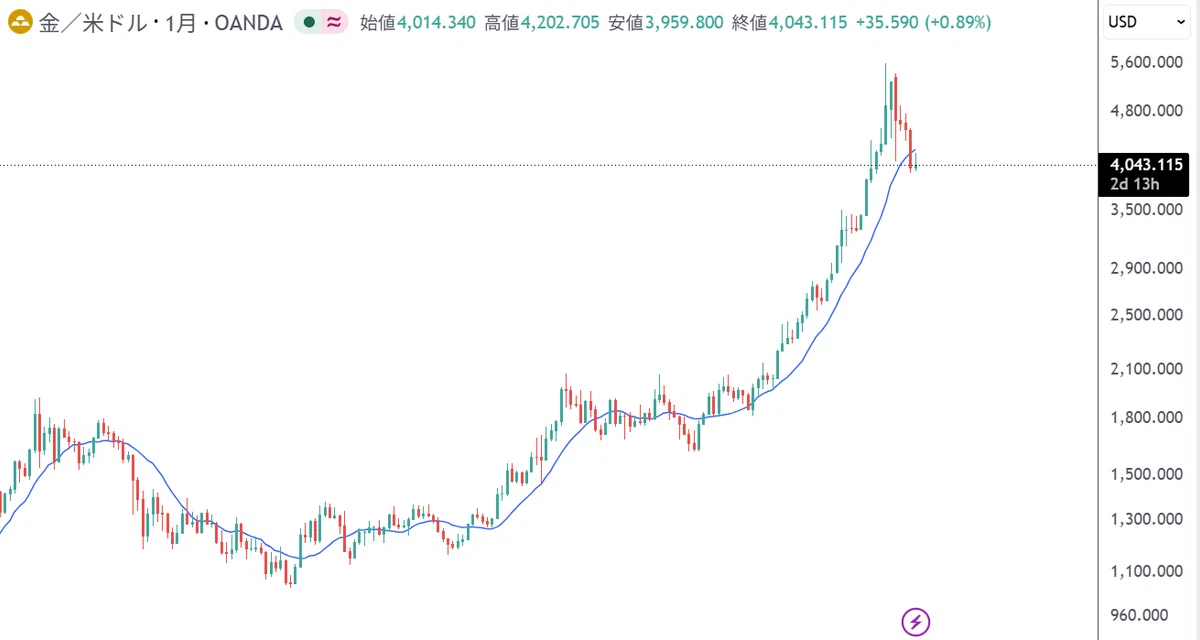
Monthly chart shows five consecutive bearish candles. The sellers have already exhausted themselves
First, let’s confirm the current situation.
Looking at gold’s monthly chart, there are five bearish candles in a row.
From a high price perspective, that’s a substantial drop. At one point it nearly fell below $4,000.
When price is driven in one direction for so long, the market cannot remain normal.
The people who wanted to sell seem to have already finished selling. New selling catalysts are likely thinning out around now.
I see this level as “a place where a fairly sizable rebound wouldn’t be surprising.”
Nevertheless, the upward structure has not been broken
This is the most important part.
When you see five consecutive bearish candles on the monthly chart, you might want to think the trend is over.
But the chart isn’t saying that.
Price is still above the long-term moving average on the monthly chart. Moreover, that moving average is clearly sloping upward.
In other words, the big upward structure itself is still alive.
A decline in this state doesn’t mean the trend is finished; it’s a mid-trajectory adjustment.
And a buying opportunity in the adjustment phase is called a dip-buying or buying on a pullback.
My long-bias is because of this structure. It’s not “short here and bet on a reversal.” It’s about picking up dips within an upward structure.
The five consecutive bearish candles are about to be interrupted
There’s also another, subtle but significant factor.
Right now, on the monthly chart, price is trading above the open. In other words, it’s currently bullish for the time being. It hasn’t closed the month yet, but the five-candle bearish run seems to be about to pause here.
What had been continuous is now interrupted.
This isn’t just a feeling that “a rebound should come soon.” It’s a real change reflected in the chart.
If it closes as a bullish candle from here, it would become the first rebound signal at the monthly level.
In alignment with the dollar-yen downside view
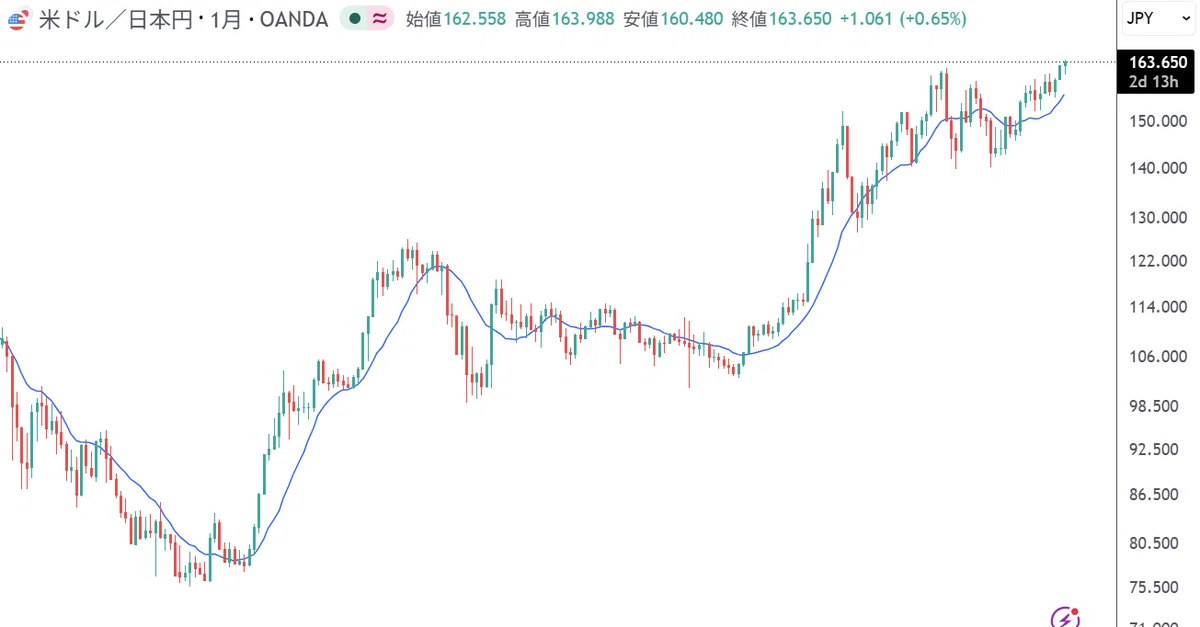
I always view gold and the USD/JPY pair as inversely correlated.
When USD/JPY falls, gold tends to rise.
USD/JPY is currently near its highs. I’m viewing the big picture as favoring a stronger yen.
If USD/JPY falls, there will be upward pressure on gold.
This also does not contradict my long-side perspective.
When multiple factors point in the same direction, it’s reasonable to give that scenario a bit of weight. That’s how I view it.
Direction is up. But I am not saying “the bottom is in”
If you’ve read this far, you might think, “If you’re so confident, just go all in.”
I understand that feeling. But I won’t.
The reason is simple.
Because you can’t reliably define the bottom.
The turning point of a rebound becomes clear only in hindsight. Being exact at the moment in the middle of the swirl is nearly impossible.
So I don’t aim to catch the bottom in one shot.
I’ll lay out thin positions and keep the option to add more if needed. Once the structure confirms, I’ll increase the size.
Having confidence in the direction and having confidence in the exact bottom are two completely different matters.
If I’m confident about the direction but not about timing, I’ll adjust the lot size. I think that’s the most practical approach.
Set the maximum loss first, then back-calculate the lot size
What I will do is decided.
First, determine the amount you’re willing to lose on a single trade. What percentage of capital can you tolerate? Generally, 1–2% is used as a guideline.
Then divide that amount by the stop-loss width.
Lot = (Capital × Risk%) ÷ Stop-loss width
This yields the lot size you should trade for that position.
When stop-loss is wide, the lot size is thinner; when stop-loss is tight, the lot size is larger. No matter which scenario you face, the amount you could lose remains the same.
Gold has wide price moves. Holding 1 lot (100 ounces) means a $100 loss or gain for every $1 move in price. That’s why skipping this calculation can leave you wiped out easily.
Then, adjust the risk% based on the strength of the conditions.
・When conditions are perfectly aligned → use a larger position
・Direction is correct, but timing justification is weaker → use a smaller position
I view the current position as the latter. That’s why I’ll position more thinly.
If it breaks, I’ll step down. I’ve also set that condition
I’ve outlined a bullish scenario, but of course there’s a possibility I’m wrong.
That’s why I’ve also pre-set the exit condition.
If the price clearly breaks below the monthly long-term moving average and does not come back above it,
then I will decide that the upward structure has broken and temporarily remove the long bias.
Having a scenario means this is how I think about it.
It’s not enough to just think “I expect price to rise.” You should decide in advance what would make you admit you were wrong.
Positions that don’t have that decision in place become mere wishes.
Summary
・Gold monthly has five consecutive bearish candles. It looks like the sellers have exhausted themselves
・But price remains above the long-term moving average. The upward structure is alive
・Recent candles are bullish and holding, with the sequence about to break
・Aligned with the USD/JPY macro view. I’m seeing a long-bias
・But bottoms can’t be predicted, so pick up gradually
・Decide risk% and back-calculate lot size from stop-loss
・Also decide the breaking conditions in advance
[New Release] KURAMA GOLD SWING AUTO
▼KURAMA GOLD SWING AUTO (¥59,800)Gold-only swing expert advisor. Automated trading + control panel for semi-manual intervention. Automatic risk% lot sizing, grade-based signal selection, and forward-test results available. A single unit to “trust, then act on your own” with gold.
https://www.gogojungle.co.jp/tools/indicators/82015

[This is all you need]
▼ KURAMA Complete Set (¥64,800) Two indicators +教材 + personalized guidance + videos. The strongest set that provides everything a trader needs
https://www.gogojungle.co.jp/tools/rooms/78023?via=users_products

【Highly popular indicator value pack】
▼ GOLD × USD/JPY Complete Set (¥39,800) KGS (Gold-specific) + KUS (USD/JPY-specific) +教材 + personalized guidance + video教材 → Across two currencies from morning to night, you won’t miss opportunities
https://www.gogojungle.co.jp/tools/ebooks/77857?via=users_products

▼ GOLD Complete Master Set (¥39,800) KGS (scalping/day) + GOLD SWING (swing) → Covers M5 to H4. On busy days use swing; when you have time, use scalping
https://www.gogojungle.co.jp/tools/ebooks/80024?via=users_products