
"Hige Touch 6-Stage Perception Tool" << Increased Operation >> July 27 (Mon) Review and July 28 (Tue) Verification Record
Today, we reflect on how the line set on the 27th yesterday has functioned since then.
Additionally, on the 28th, we tested whether the movement could be captured if a trend emerged after a range breakout.
We will not place actual trades; only screenshots of key moments are provided.
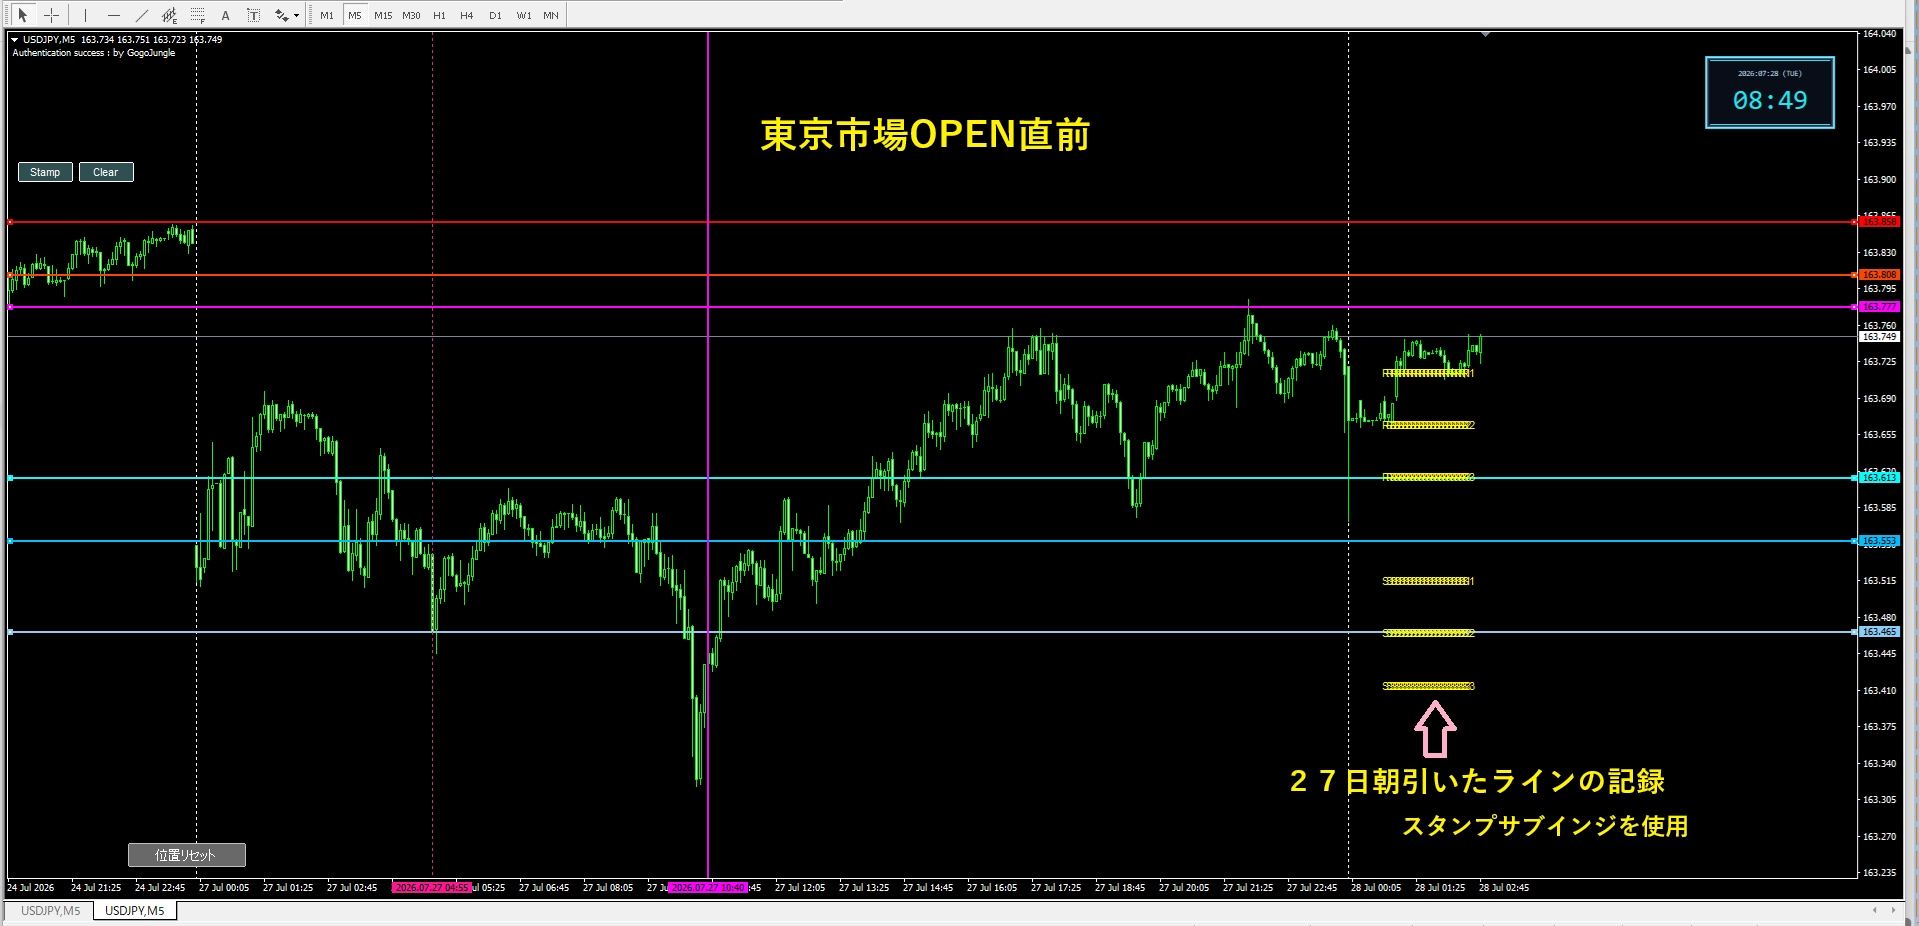
The top image shows the chart just before the Tokyo market opened at 9:00 a.m. on the 28th.
The line set on the 27th has not moved as of the confirmation time on the morning of the 28th.
The spacing between each line on the 27th is the initial value of 5 pips.
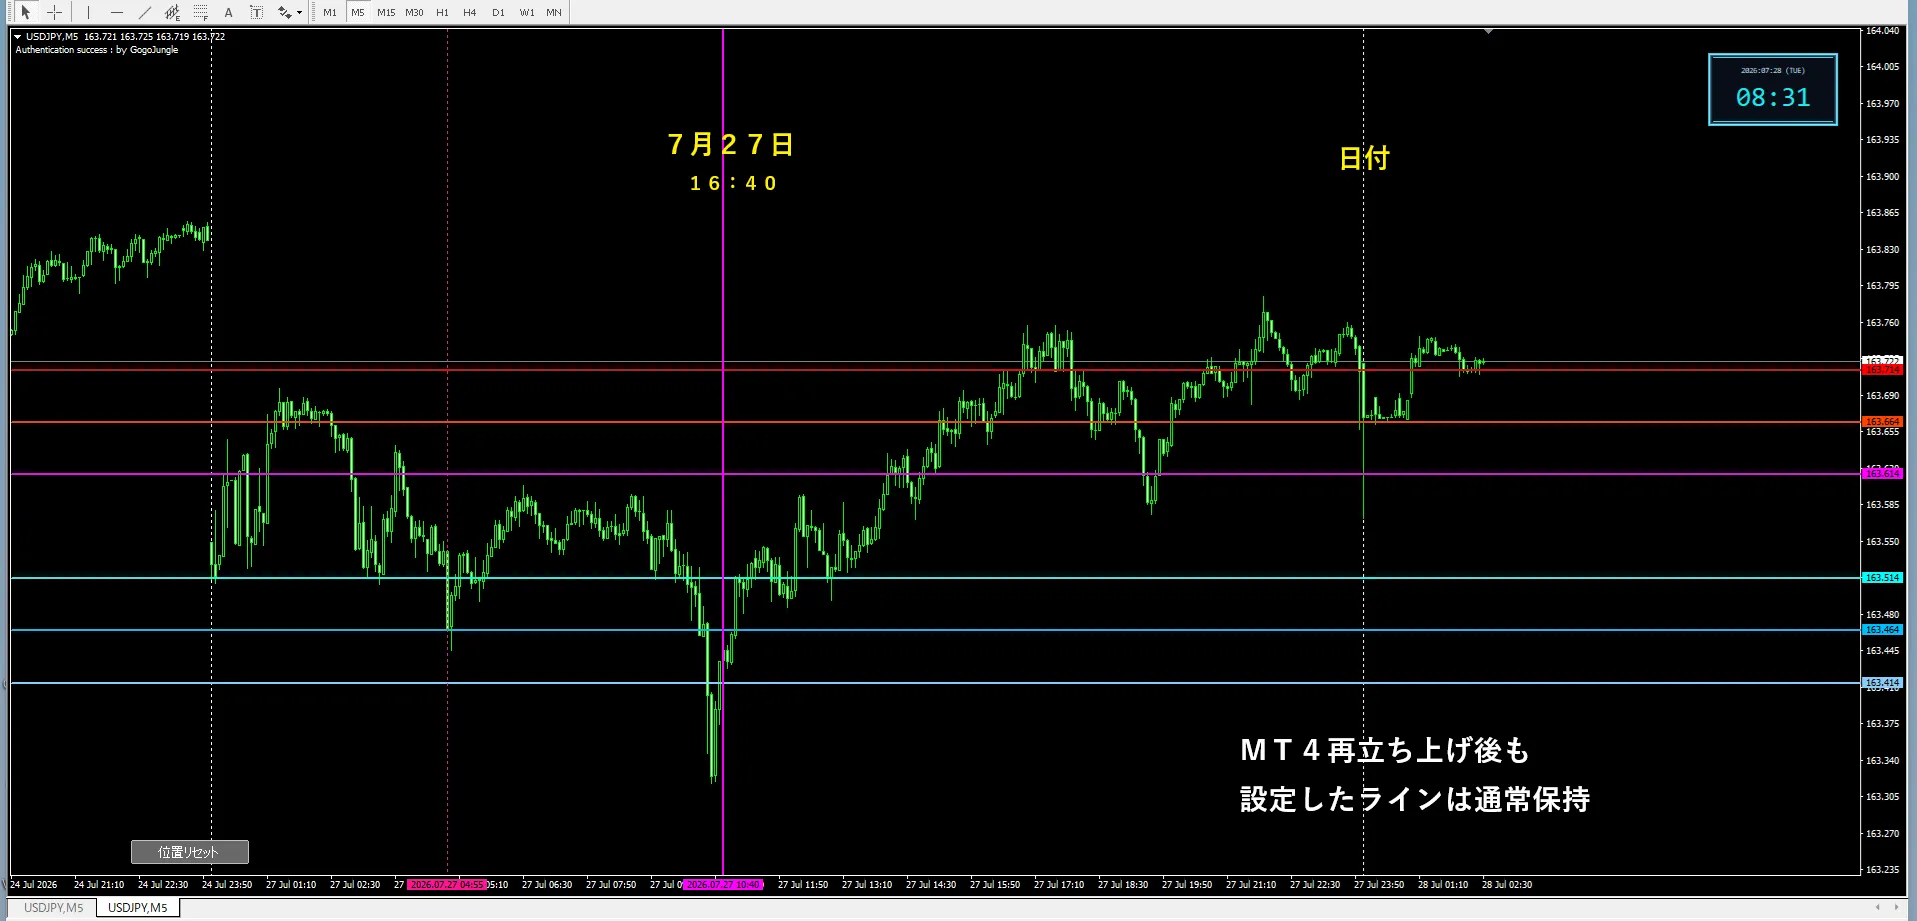
*① Chart after 16:40 on the 27th
The lines set in the morning of the 27th are displayed as they are.
From around 20:00, touches to the resistance line began.
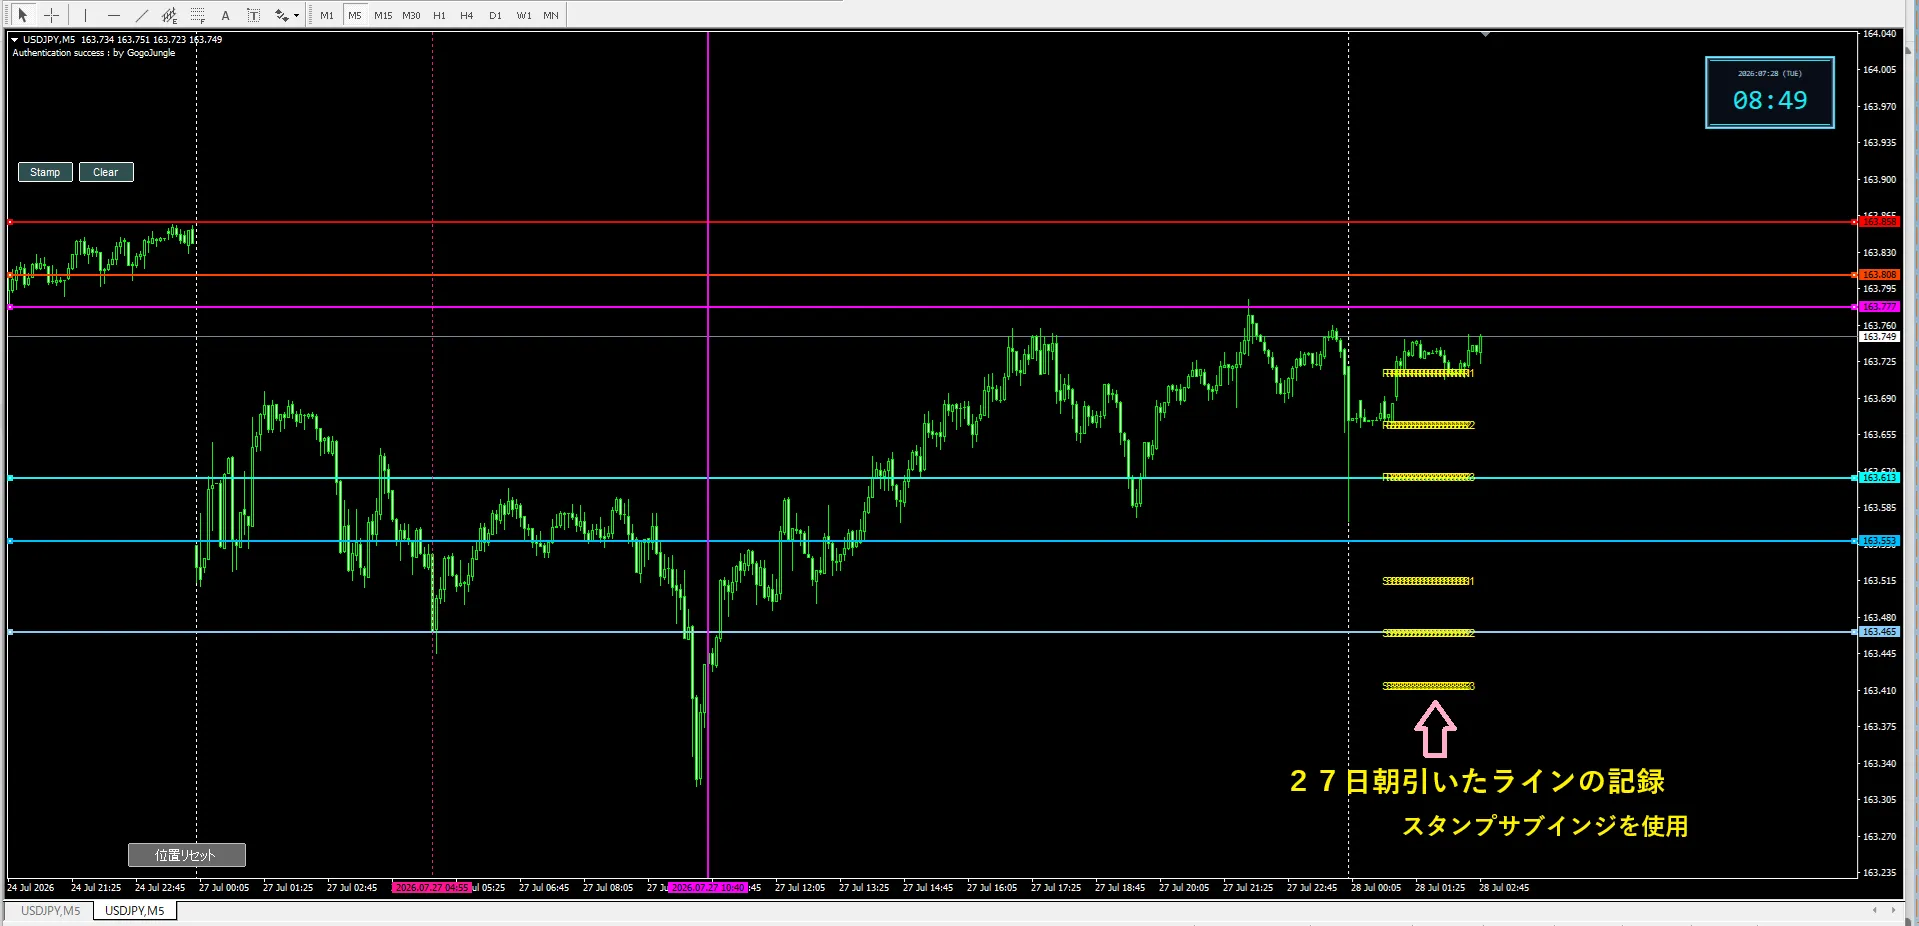
*② 28th, just before the Tokyo market opens
The line positions set on the 27th are recorded with the stamp sub-indicator.
After that, to verify whether the movement could respond to the trend after the range breakout, the lines were set at positions conscious as support and resistance.
※To explain the flow, the same image as the top image is shown.
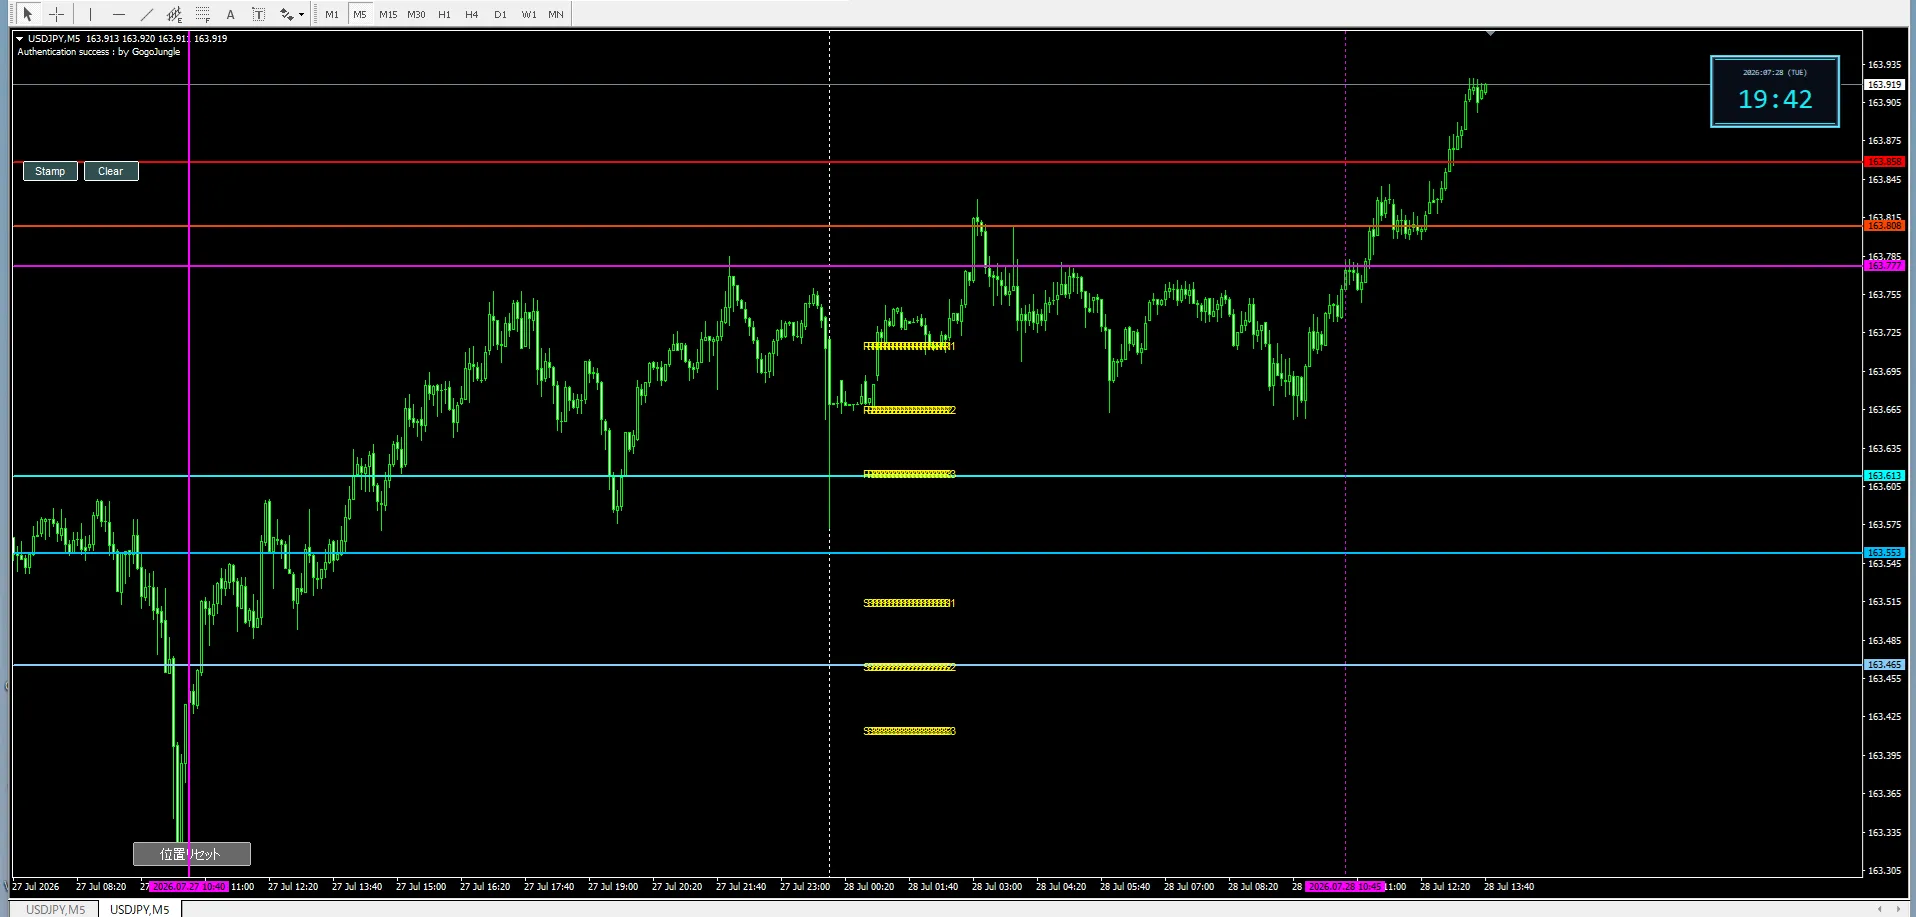
*③Chart of the night of the 28th
The resistance line that had been set was broken upward, and the upward movement continued thereafter.
※ This tool does not generate buy or sell signals.
It is an discretionary aid tool to make it easier to grasp price reach and proximity to resistance/support.
https://www.gogojungle.co.jp/tools/indicators/82089
The digital clock displayed on the screen is being distributed for free.
Please see yesterday's article for details.