
Everyday Nikkei 225: 2026/7/28
Details of analysis tools link
* We have steadily received high ratings.
■ New development profit + indicator DAVID (David)
https://www.gogojungle.co.jp/tools/indicators/73936?via=users_products
■ Skillful trendline drawing indicator "Unparalleled Sword"
https://www.gogojungle.co.jp/tools/indicators/54499?via=users_products
■ Indicator pack MT4/5 version, monthly
"Tenka Musou" Sync System
https://www.gogojungle.co.jp/tools/indicators/50319
"David" Sync System
https://www.gogojungle.co.jp/tools/indicators/73939?via=users_products
Trial version • Ultimate • Sync SystemMonthly
https://www.gogojungle.co.jp/tools/ebooks/50353
Below: Current situation analysis article
One-word comment: Is it range/declining trend?
Daily chart:MAX Oscillator: Sync Band“Strong decline”
4-hour chart“Neutral” indication and signal
Weekly chart』s “Weak decline” indication and signal
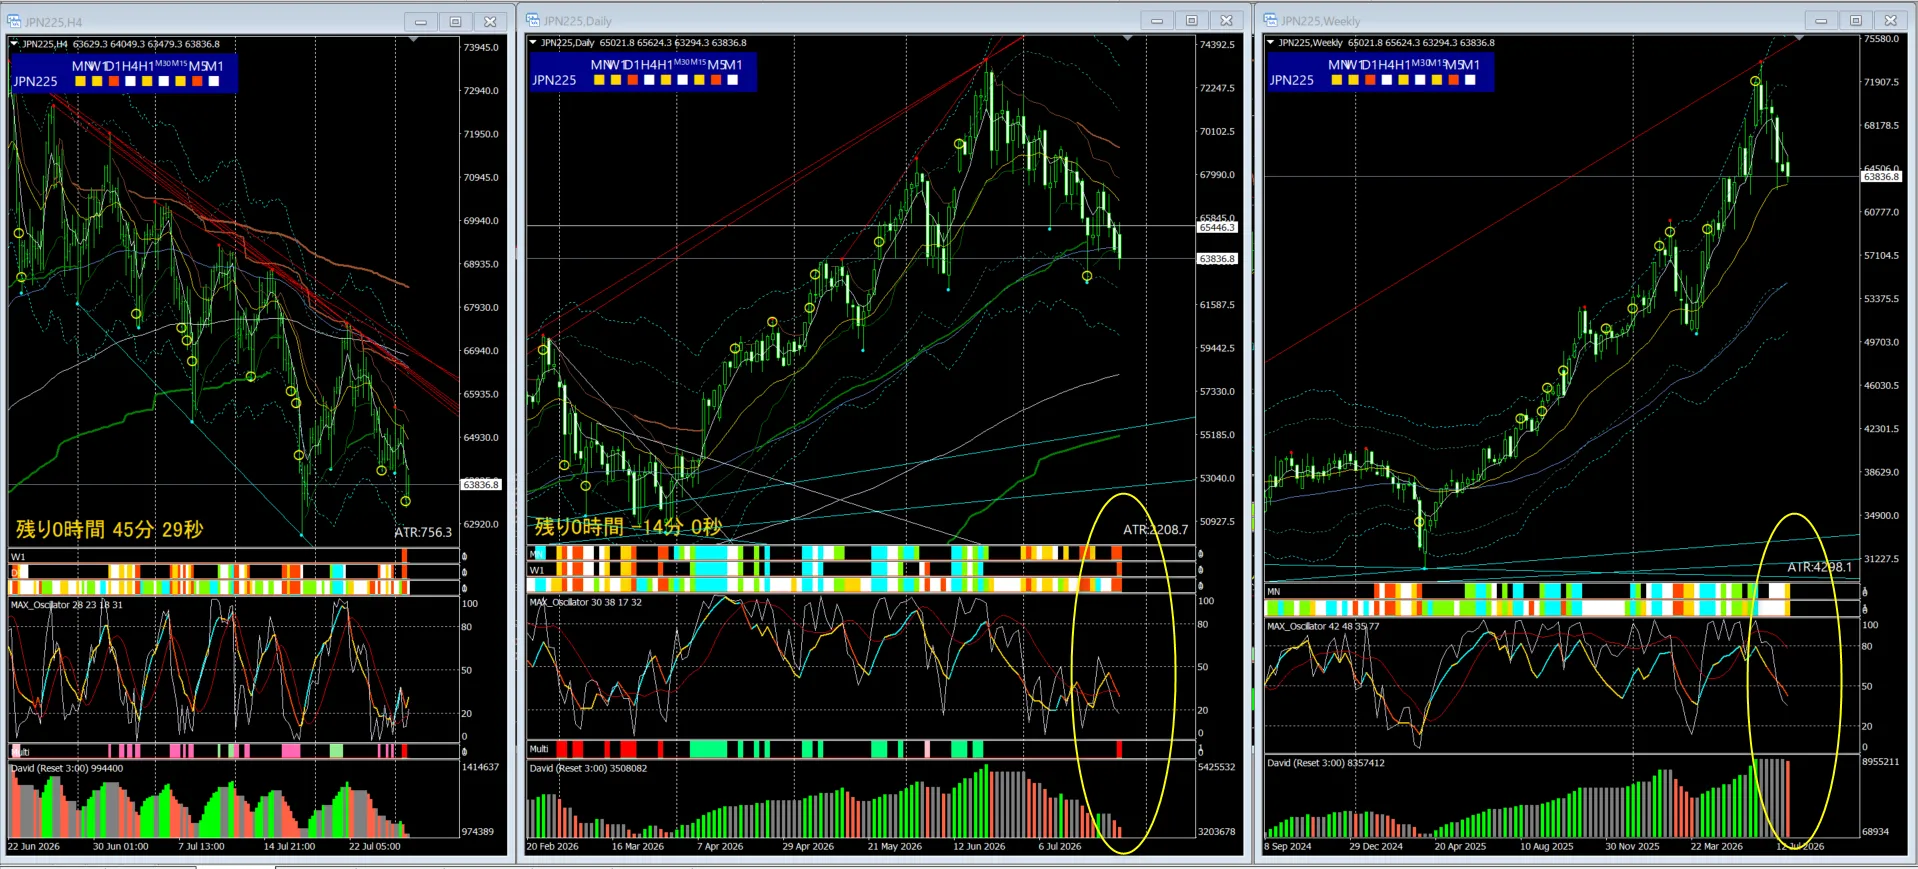
※ Range / downtrend
The positions of MAX Oscillator on weekly and daily charts align
Pointing downward
Monthly chart also lights a bearish signal
4-hour chart can be viewed as a range moving within a channel, but
should respond with a slightly bearish outlook
There are times when price movement becomes extremely volatile depending on the time frame
If you think it's dangerous, it's better to exit quickly, and risk management is also
still necessary to be cautious.
Do not ignore the near-term trend; keep a flexible stance to adapt to short-term waves
Be careful of sudden abrupt changes!
※ Important notes
Volatility is quite high, so pay close attention to capital management.
Caution
This is an analysis comment based on the original indicatorCurrent status analysisand does not constitute a buy/sell recommendation, nor a guarantee of future movements.
It does not guarantee future movements or provide buy/sell recommendations.