
This Week's USD/JPY Trading Strategy
2026 Latest Version!!
You can view the dialogue VTR with GoGoJyan President Hayakawa and me here
We also have a free gift.
Good morning, everyone.
This morning, the USD/JPY has opened slightly lower with a gap.
As you can see, we are in a very high price area, so we cannot predict what will happen next.
In such a situation, we should still prepare strategies and scenarios.
This week
the 30th
early hours, FOMC
BOE
the 31st
Bank of Japan
and, policy rate announcements will continue.
There were expectations of BOJ rate hikes at one point, but the forecast is for a hold.
Whether the current rise has already priced in a hold, or if rumors push it up and reality pulls it down is the question.
Either way, predicting it won’t directly make trades successful, so we should base our trades on the charts we are viewing now, set trading strategies, take profits if things go well, cut losses if they don’t, and this flow will not change.
USD/JPY 1-hour and 15-minute charts
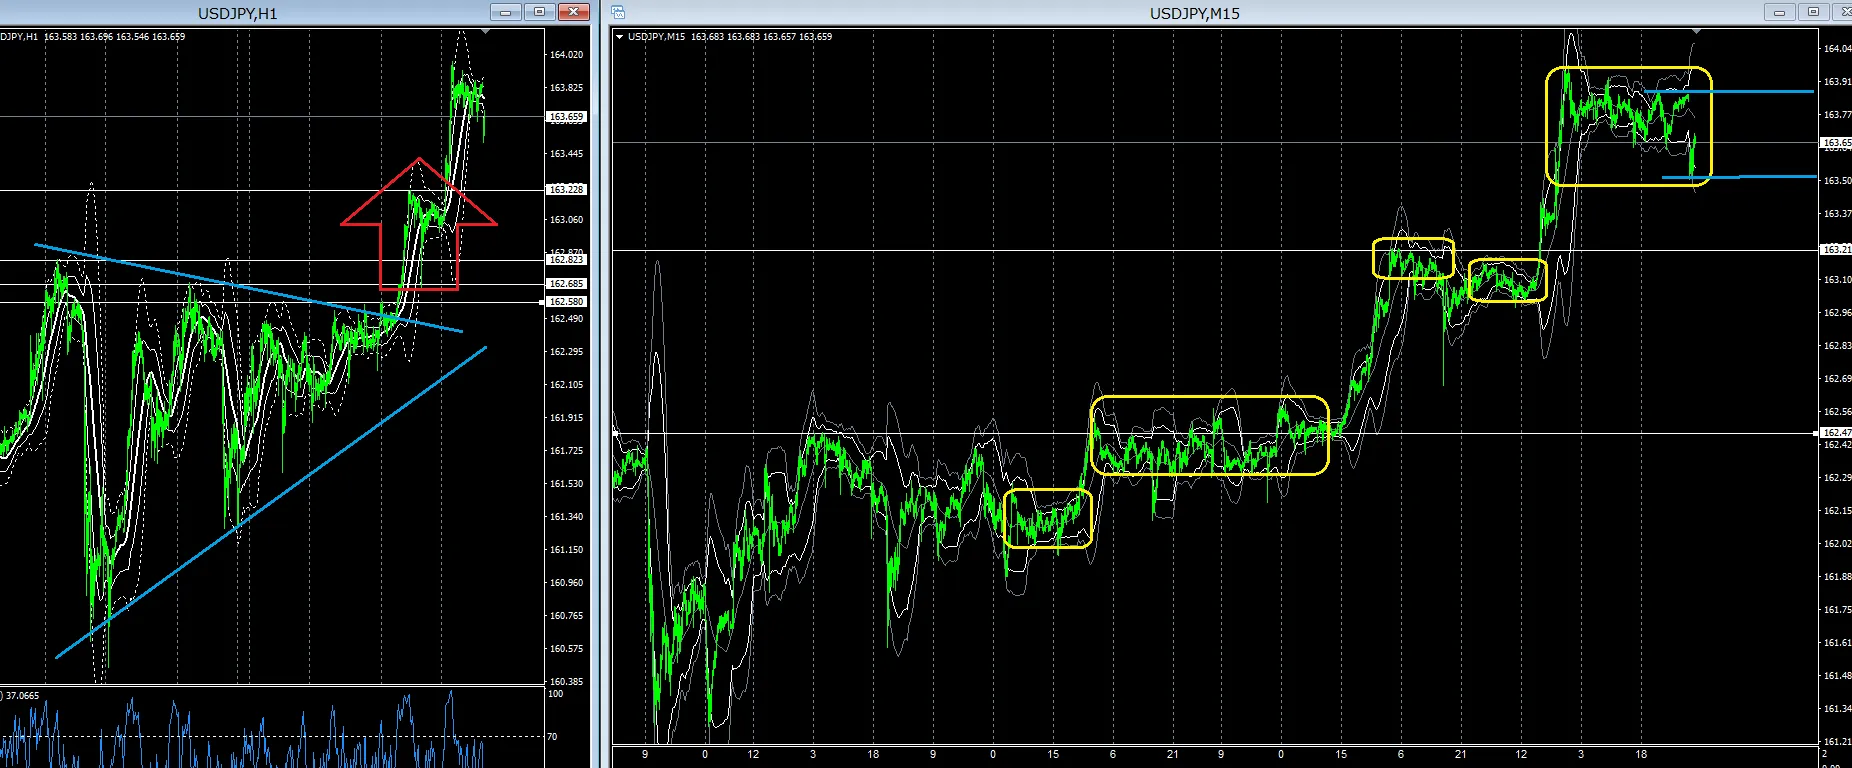
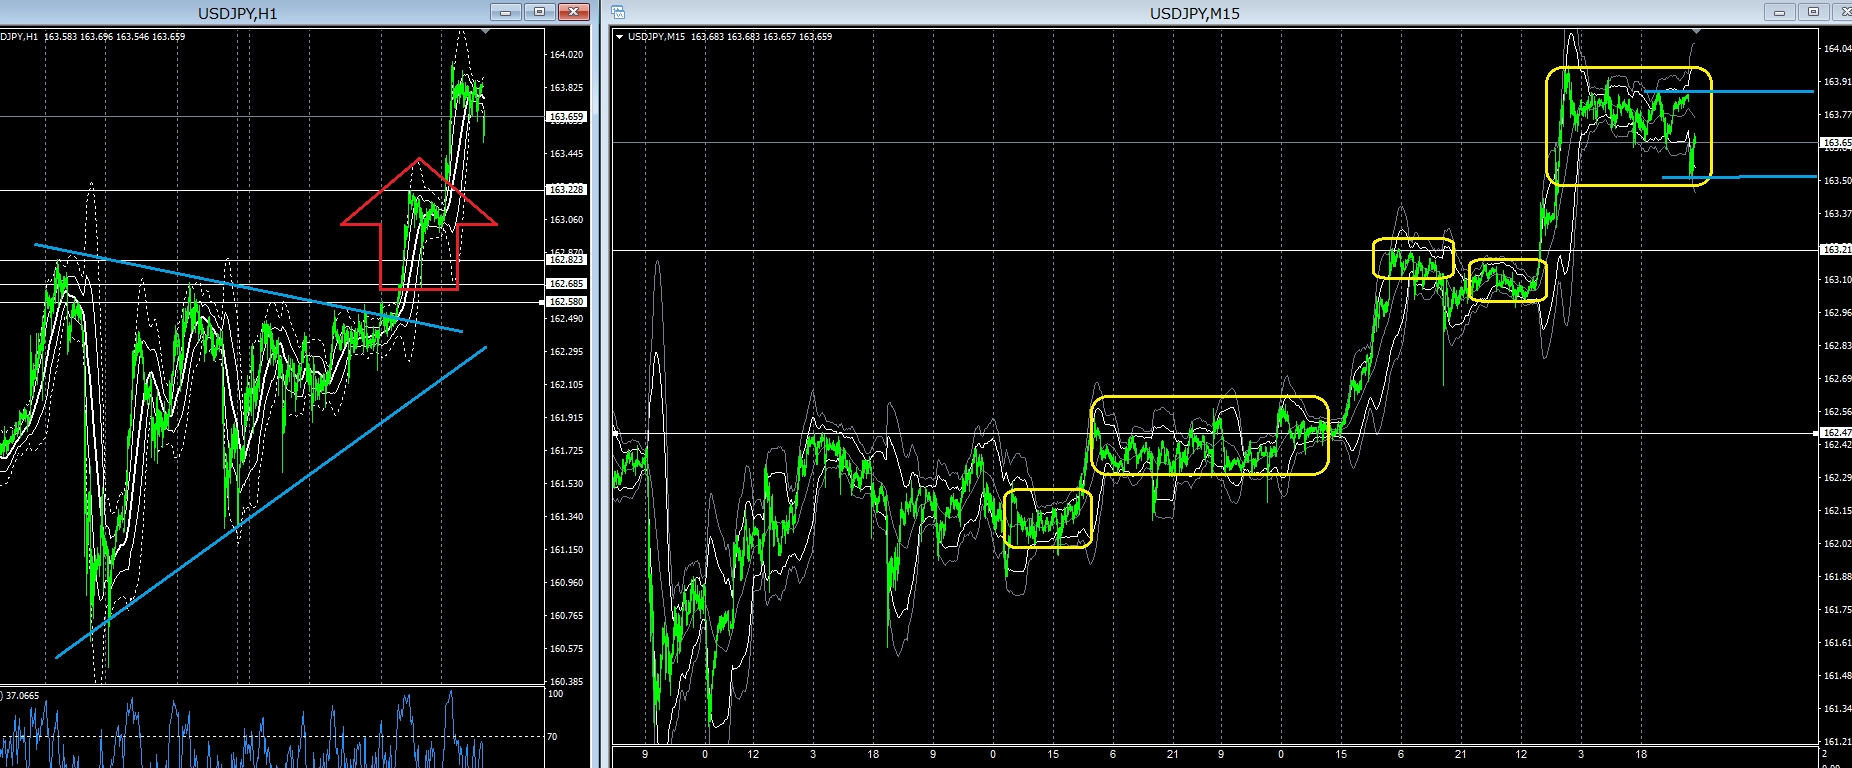
The 1-hour chart’s formation broke and rose.
This has been written about several times.
Let’s look at two weeks on the 15-minute chart.
From yellow □ sideways range, there is a continuing upward breakout. The market doesn’t move in a straight line but climbs like a staircase.
Check this sense on your preferred time frame or an easy-to-understand time frame.
In short, confirm that "it is happening."
If you look at billions of-trade charts for one-minute or five-minute billion-trade lines, it would be easier to understand, but even if you’re not a billion-trade user, depending on how you view the time frame you can vaguely imagine the breakout, pullback, or test.
In that context, the bridge strategy is, whether at a high level or not, still a bullish trend.
From the yellow □ zone on the 1-minute or 5-minute chart, the upward breakout is what we should first aim for.
Breakout trading is an easy-to-start and easy-to-understand trading point.
However, it is also a situation where it may not extend, and if it breaks, it may pull back, so execution timing and perseverance are required.
That said, "easy to understand" is the best point.
Since there are cases where it then enters an upward trend, it is also acceptable to enter based on position sizing without bias.
For Billionaire Trader users, in addition to the breakout, during the range you can watch for pullbacks starting from the Billionaire Trader line.
In any case, a high-price spike is possible, and that could be the peak.
We aim to stay bullish without becoming too excited about declines.
We will look at charts with the idea of buying low and selling high.
However, the bubble’s momentum is incredible.
There seems to be money everywhere to buy.
Naturally, there will also be cases of financing buying more by using stock as collateral.
We don’t know how long it will last, but I think the bubble collapse will be caused by
geopolitical risks
rising interest rates
bankruptcies of financial institutions
these are generally the reasons it happens.
Right now, any of these seem plausible, so eventually I think we will see a bubble burst.
Just like during the Lehman Brothers crash, downside trades profit quickly.
In fact, making profits can be quick.
The rise is gradual, but the fall is rapid.
There was a time when the pound-yen fell about 12 yen overnight, and although it was a time with 200x leverage domestically (tax rules aside), many people probably made money that night.
This summer, you may not be able to take your eyes off the market.
Thank you again for today.
For traders who just want to succeed in trading and earn a living from trading, here is my product, the trading technique that you can also learn on your own, this is it ↓