

[Free Distribution] The strongest divergence signal tool created by AI
That shroud of fuzziness, the culprit is “divergence”
When you look at a chart, have you ever encountered scenes like this?
“Prices keep falling, yet for some reason the indicators look like they’ve stopped declining.” “It feels like a reversal is near, but I can’t enter because there’s no basis.”
The source of this haze is often a condition called “divergence (convergence failure).” In this post, we’ll distribute a free indicator that tools this phenomenon with AI.
How divergence works when MACD and price drift apart
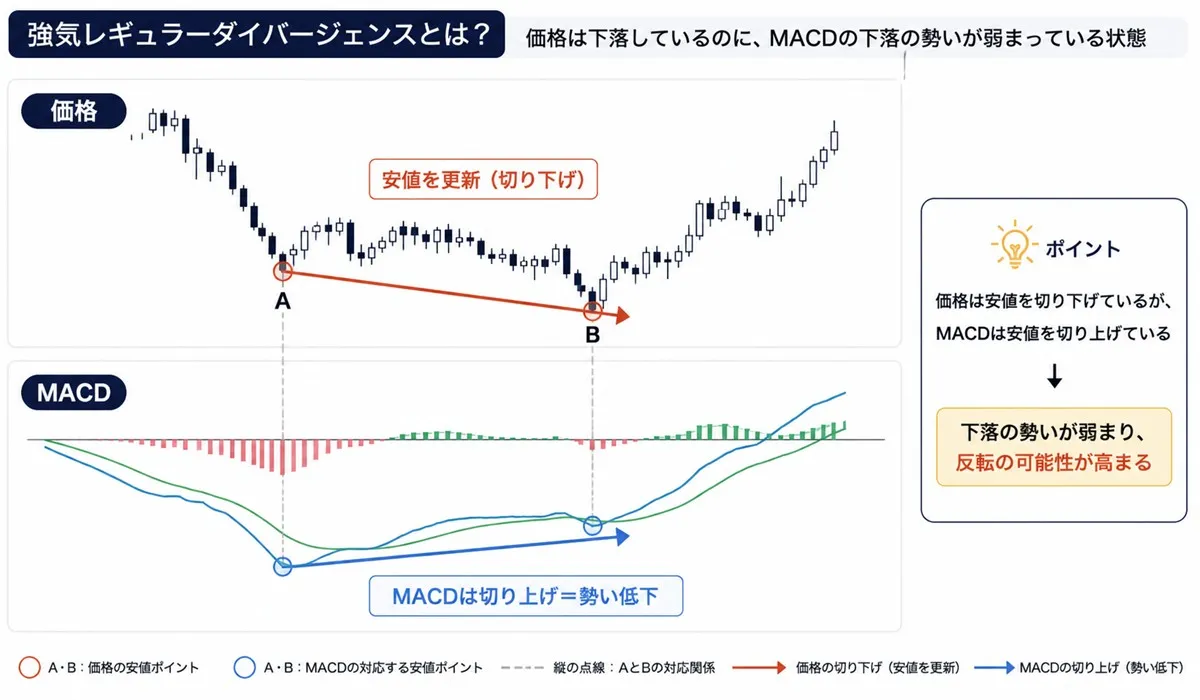
Divergence is a phenomenon where the movement of price and the movement of an indicator (MACD in this case) shift in opposite directions.
- The price makes a new low, but the MACD rises above the previous low → a sign that the downward momentum is weakening (potential early sign of a rebound)
- The price makes a new high, but the MACD falls below the previous high → a sign that the upside momentum is weakening (potential early sign of a decline)
This is a state where there is a discrepancy between the price itself and the indicator that measures price momentum, and it is commonly observed toward the end of a trend or during a pause. Divergence does not guarantee a reversal, but it can be used as a clue to notice momentum changes early.
undefinedTurn signals into numerical rules visible to anyone
Comparing “peaks and troughs of price” with “peaks and troughs of MACD” by eye every time is cumbersome, so we formalized the rules into numbers as follows.
- Peak/trough determination: Among the five bars (two bars before and after on each side), only when the middle bar is the lowest (or highest) is it labeled a trough (peak).
- The distance between the two compared troughs (or peaks) should neither be too close (exclude less than 5 bars) nor too far (exclude more than 60 bars).
- BUY signal: The new trough price is lower than the previous trough, while the MACD is higher than the previous trough.
- SELL signal: The new peak price is higher than the previous peak, while the MACD is lower than the previous peak.
In determining peaks/troughs, we use the concept of waiting for a few future price movements to confirm, so once a signal is confirmed, it does not disappear or drift (no repaint). This means signals come a bit later rather than earlier.
This rule has been turned into an AI MT4 indicator
We fed the above rules to AI and implemented them as an MT4 indicator. The base uses the existing signaling tool framework we already use here (backtesting feature, statistics panel, money management, alerts, TP/SL line display, etc.), with only the decision logic replaced by divergence detection.
Details and how to receive the free tool “MACD_Divergence_Signal”
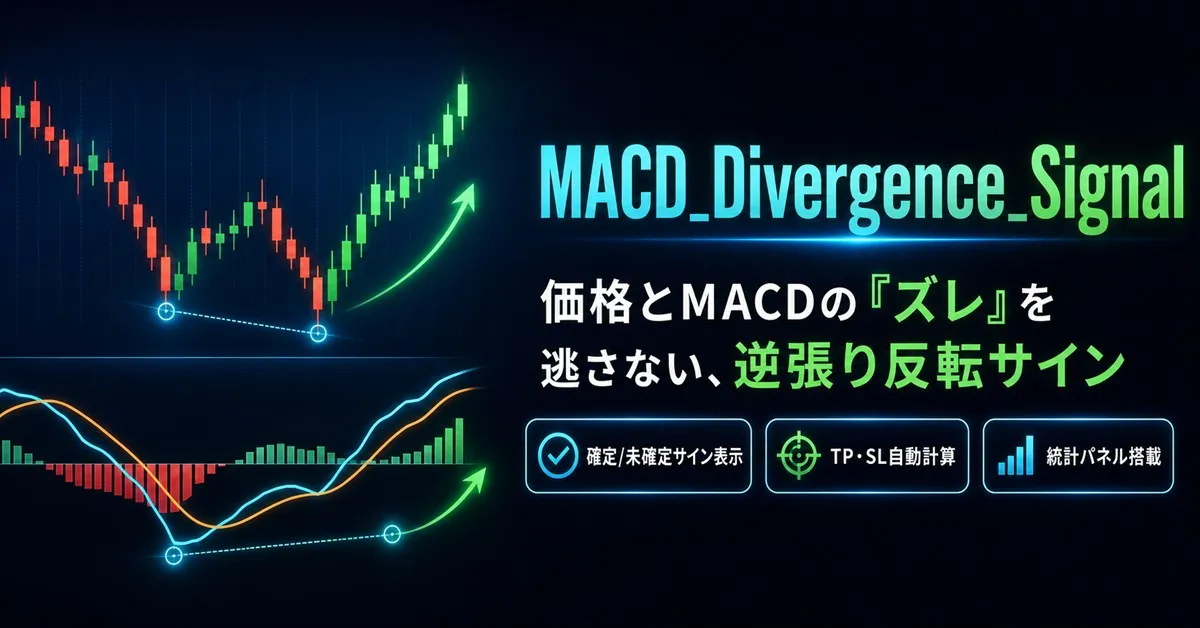
MACD_Divergence_Signal | FX Sign Tool
- Automatically detects MACD and price divergence and displays BUY/SELL with arrows
- Confirmed and forming-signal colored display (no repaint design)
- TP/SL line display, simple backtest statistics panel, money management (recommended lot calculation), and alert function
- Settlement mode (TP/SL only, logic only, or both) selectable