

2026/7/25 Dollar/Yen, Gold, SP500, and Nikkei 225 environment

For verification purposes, we provide weekly videos of the USD/JPY price movements.
USD/JPY
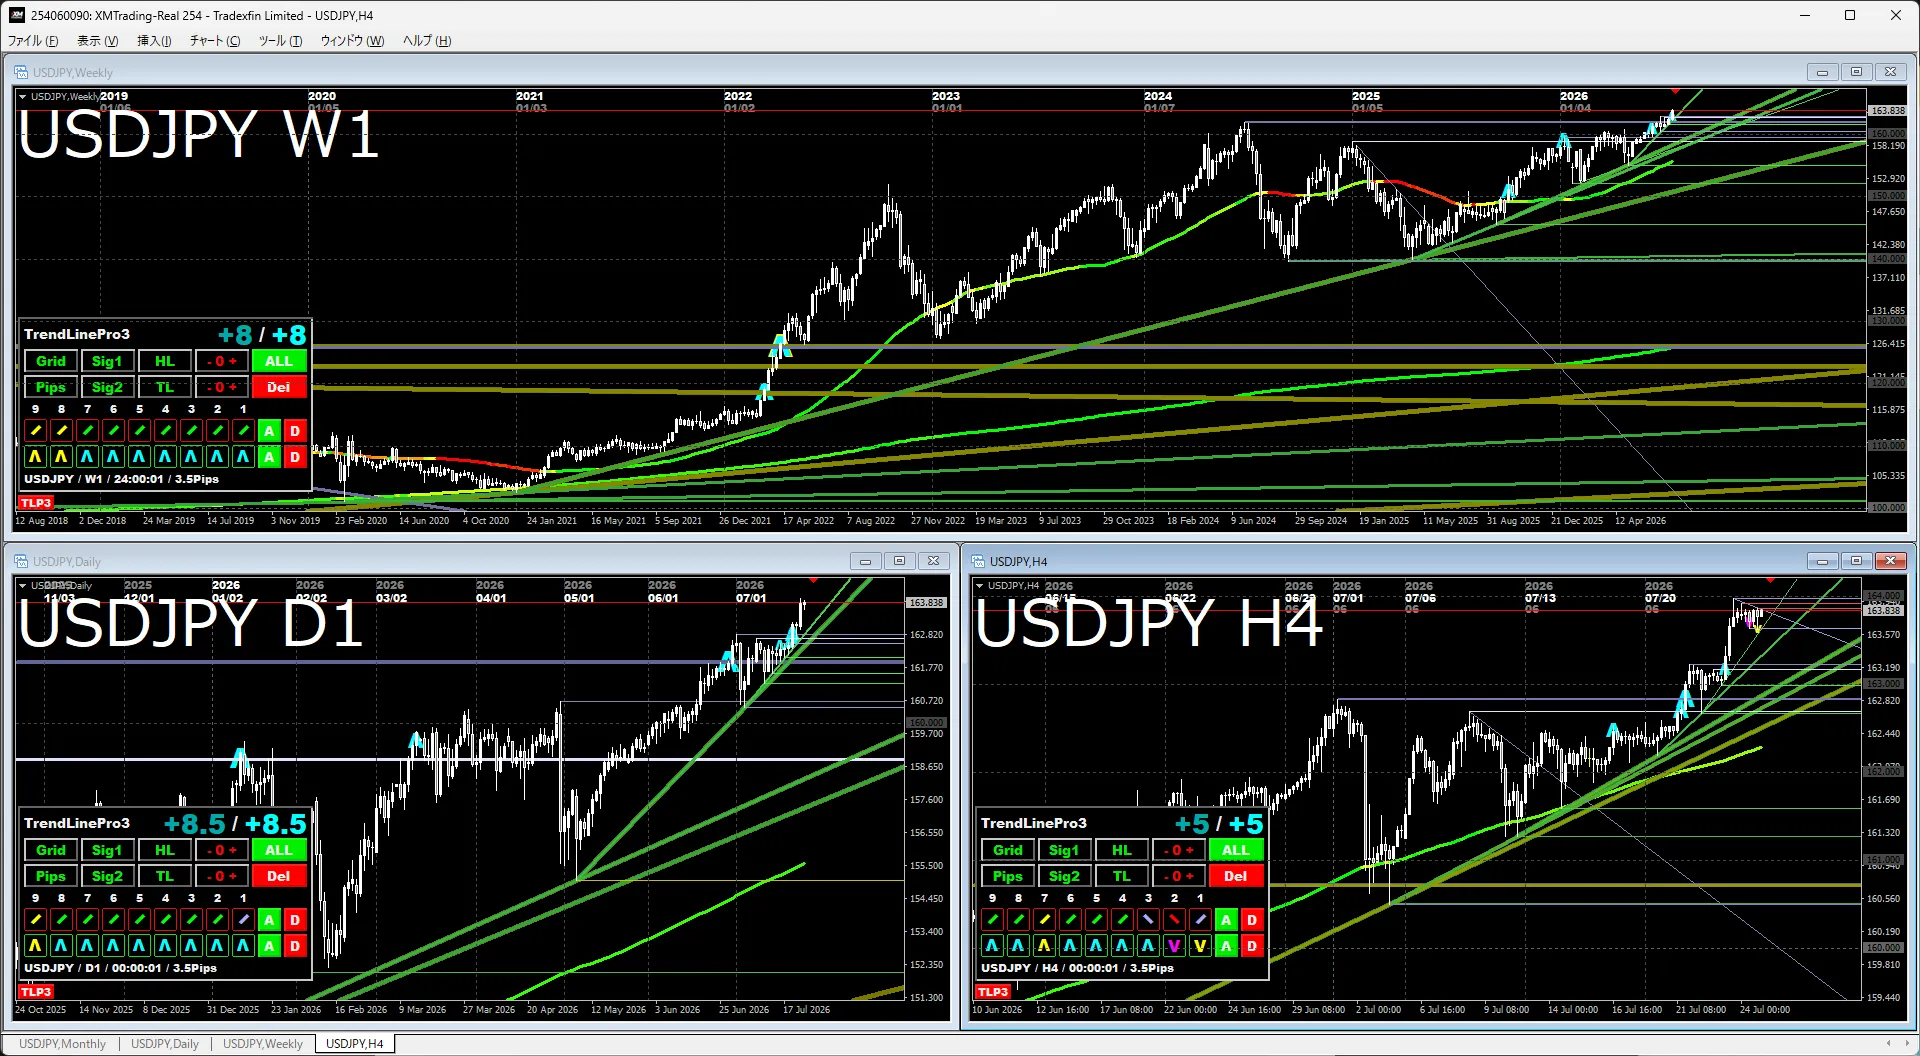
WeeklyThe trend remains upward with a solid higher high. Since this is a long-term breakout after confirming a bottom, the upward momentum has strong supporting elements.
Daily and 4-hourFor a while, the up-move has been in focus. The option we see is a pullback-buying scenario.
Gold
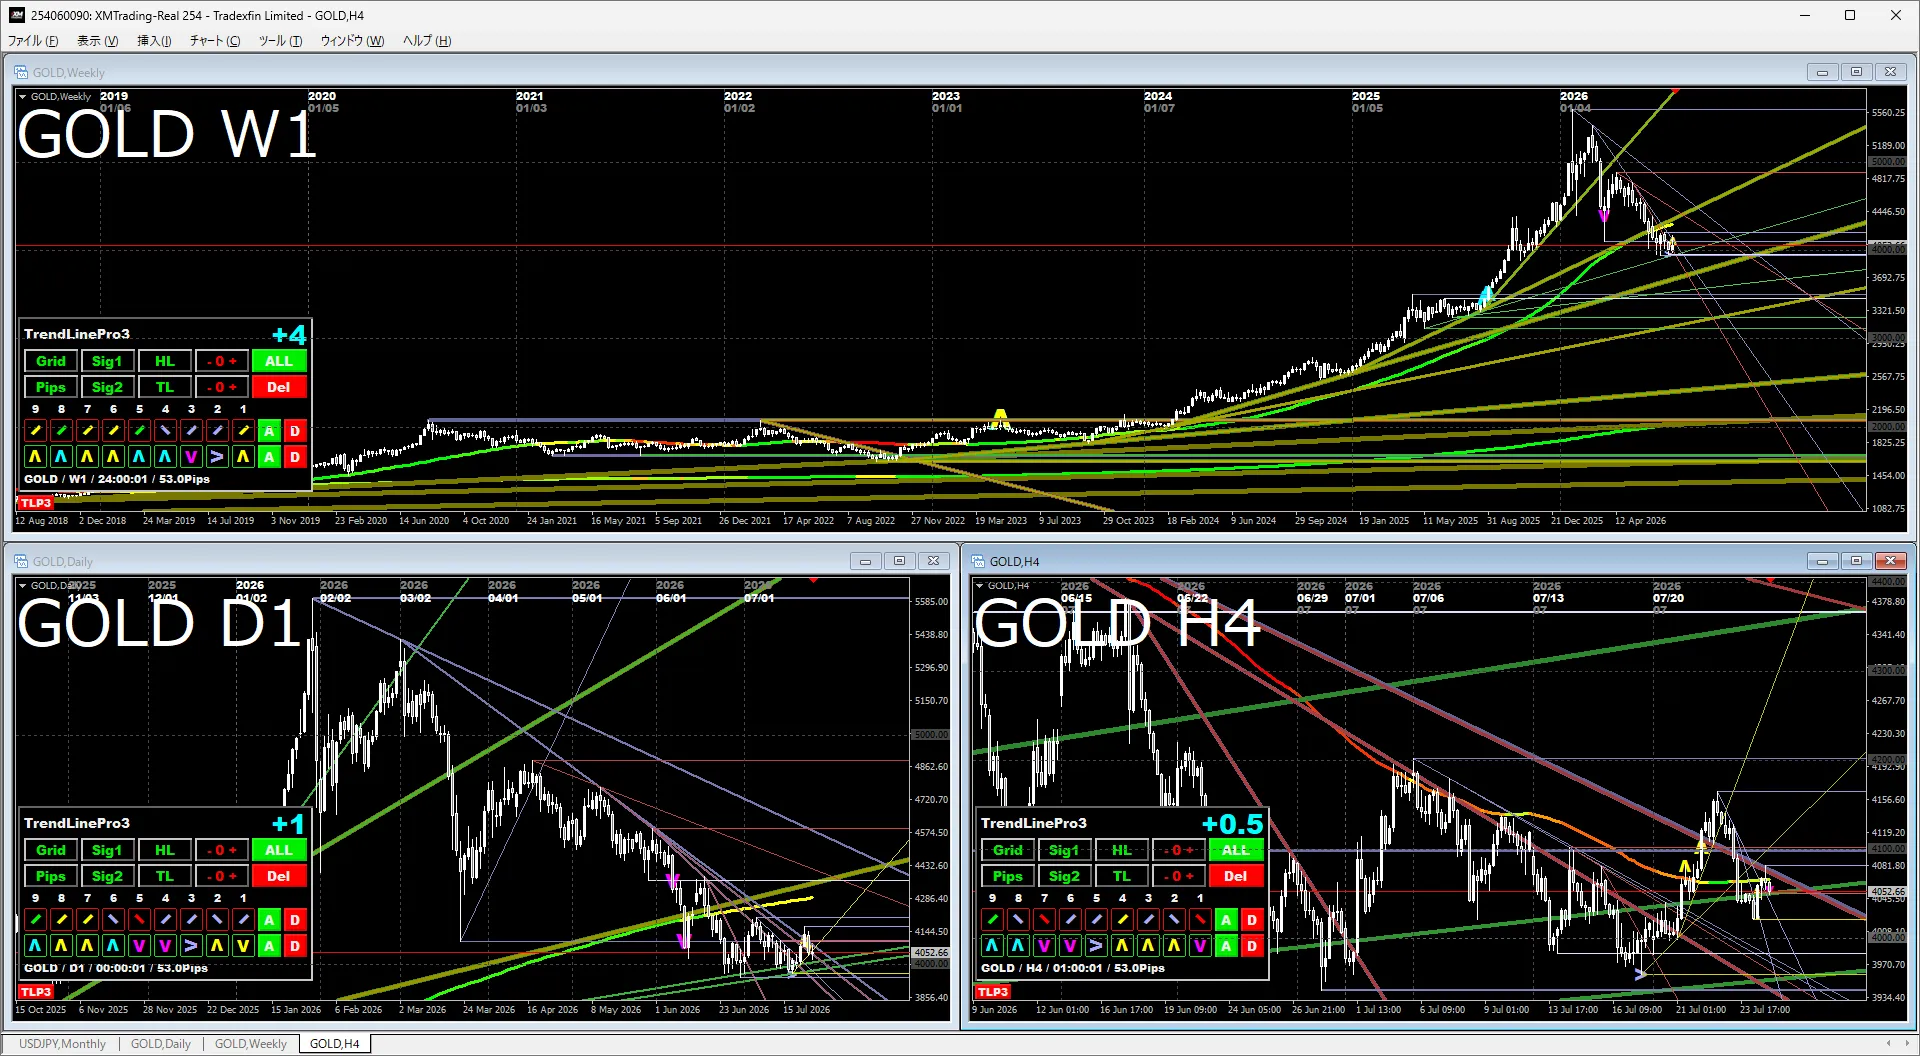
WeeklySince currency value is perceived to be declining, gold is expected to rise in the long term. However, the overbought condition has faded, and a long-term correction may be underway. The score shows a slight uptick.
Daily and 4-hourThe green and red triangles on the daily chart have broken above the red one, but there is no strong upward momentum. Next, a breakout above around 4,200 or a breakdown below around 3,950 is in focus. If it breaks lower, around 3,500 becomes a potential target. To attempt further upside, a bit more sideways consolidation is likely required.
S&P 500
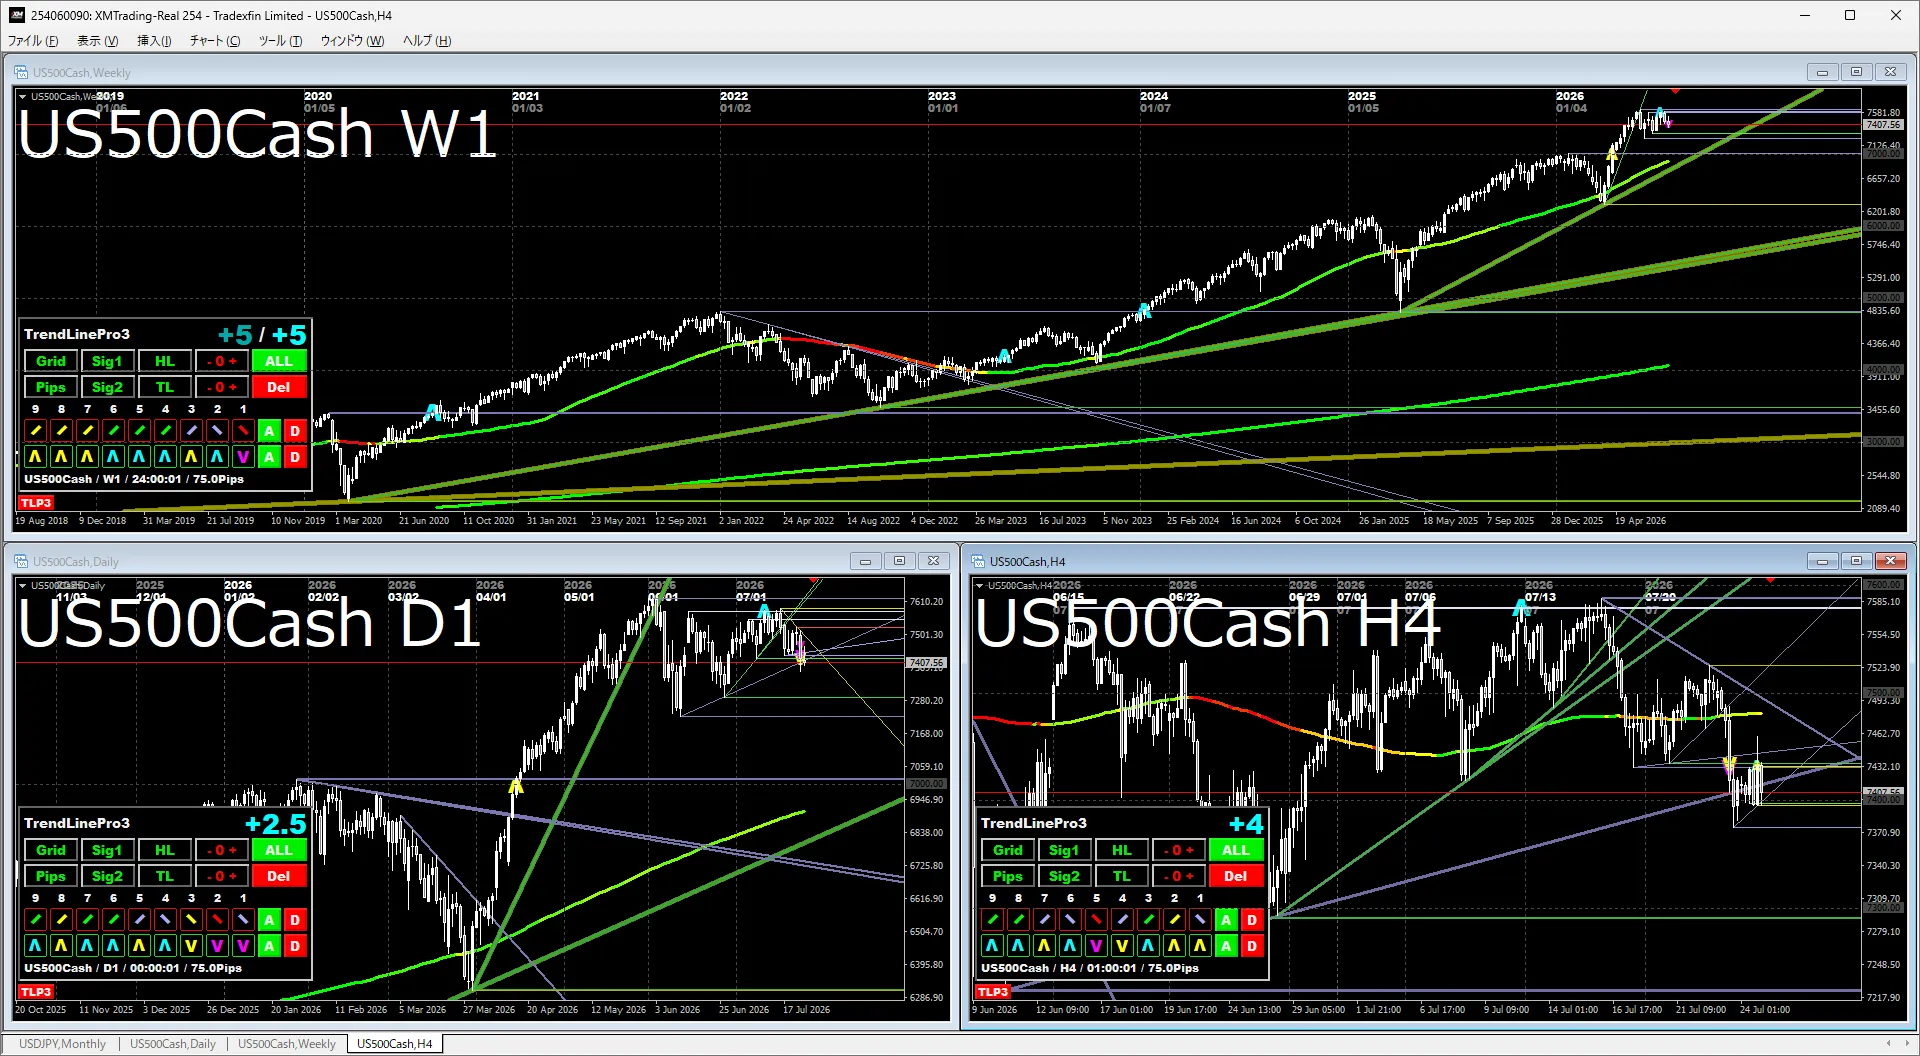
WeeklyThe recent high has been exceeded and the uptrend is confirmed. In this market environment, buying tends to be favored.
Daily and 4-hourThe uptrend remains, so buying is seen as favorable, but if it fails to make a new high soon, it may shift toward a decline. Once new highs begin, around 8,500 tends to be watched.
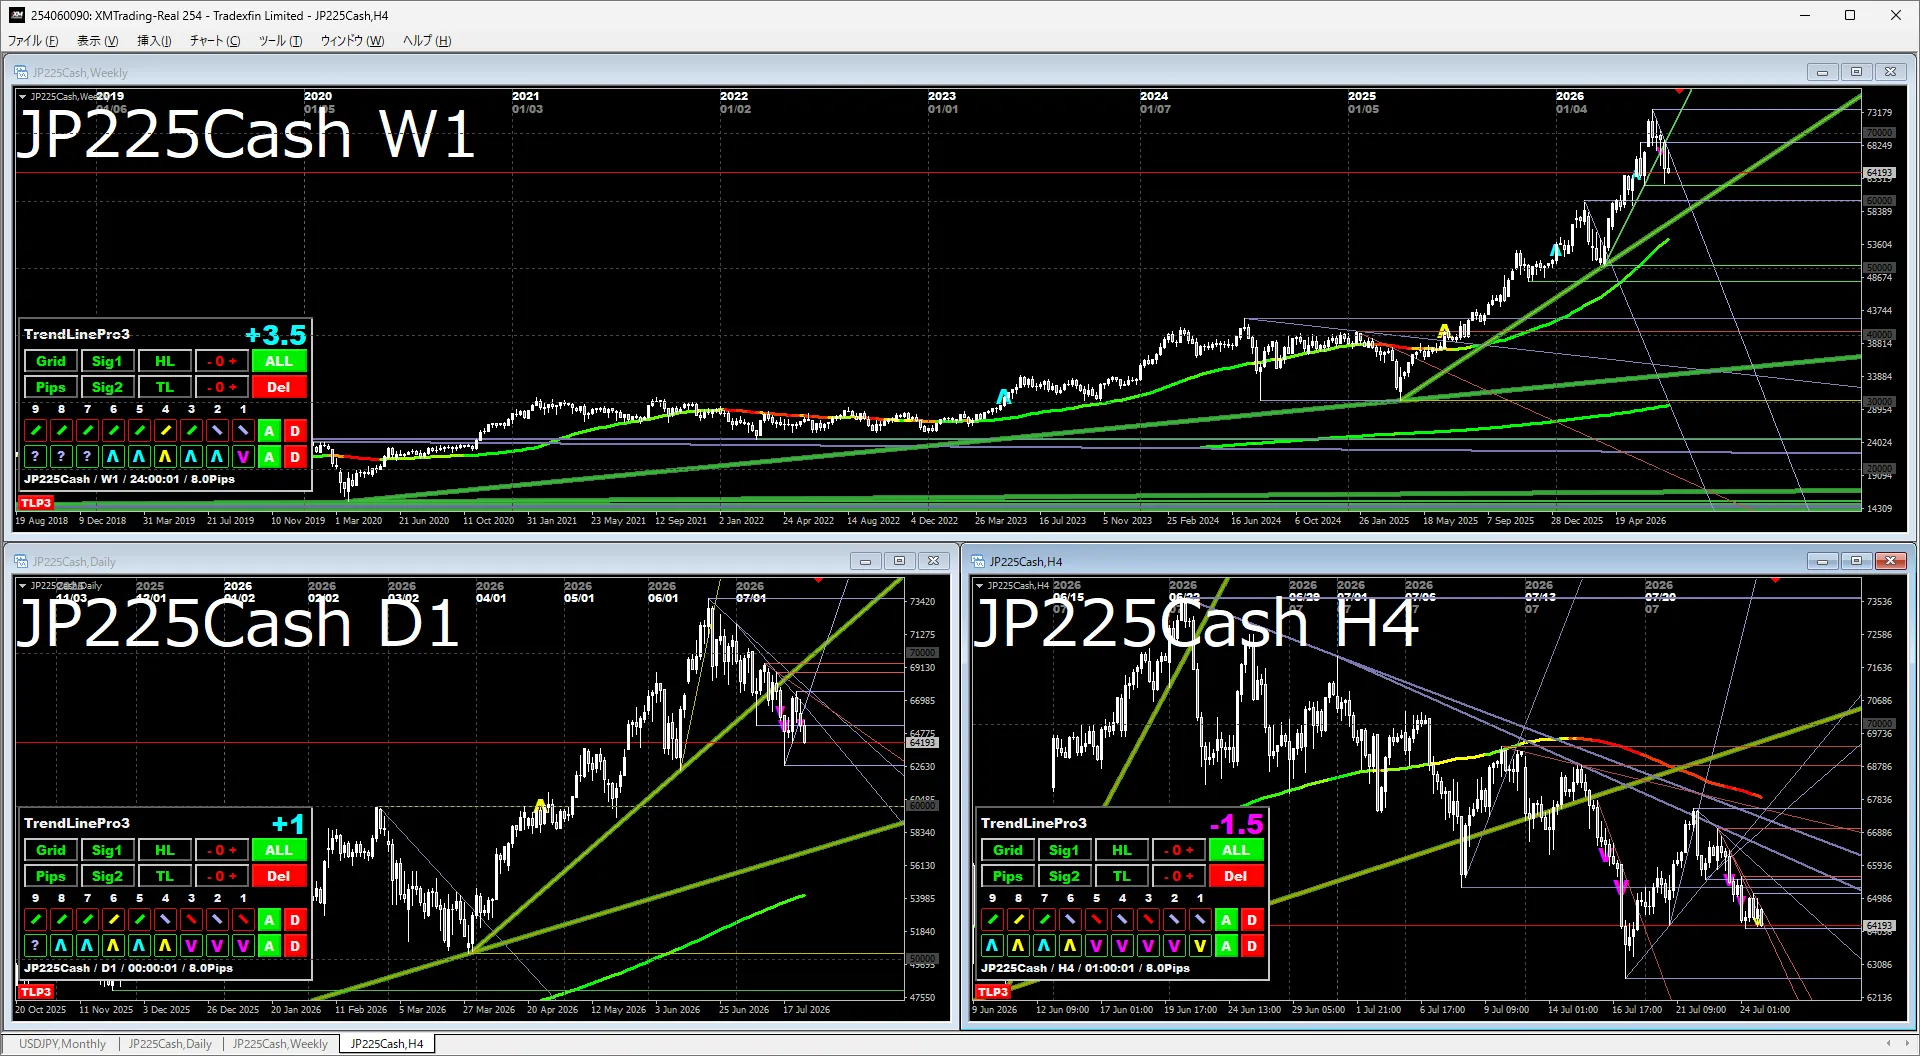
WeeklyThe uptrend continues, but it is uncertain whether it will rise rapidly to the near-term ceiling of 80,000.
Daily and 4-hourFor now, a cautious, horizontal consolidation is likely. Wait and see until the market stabilizes. On the 4-hour chart, a breakout above the blue Dow trendline is in focus.
The indicators in the attached image use the following indicators.
If you are interested, please take a look.