
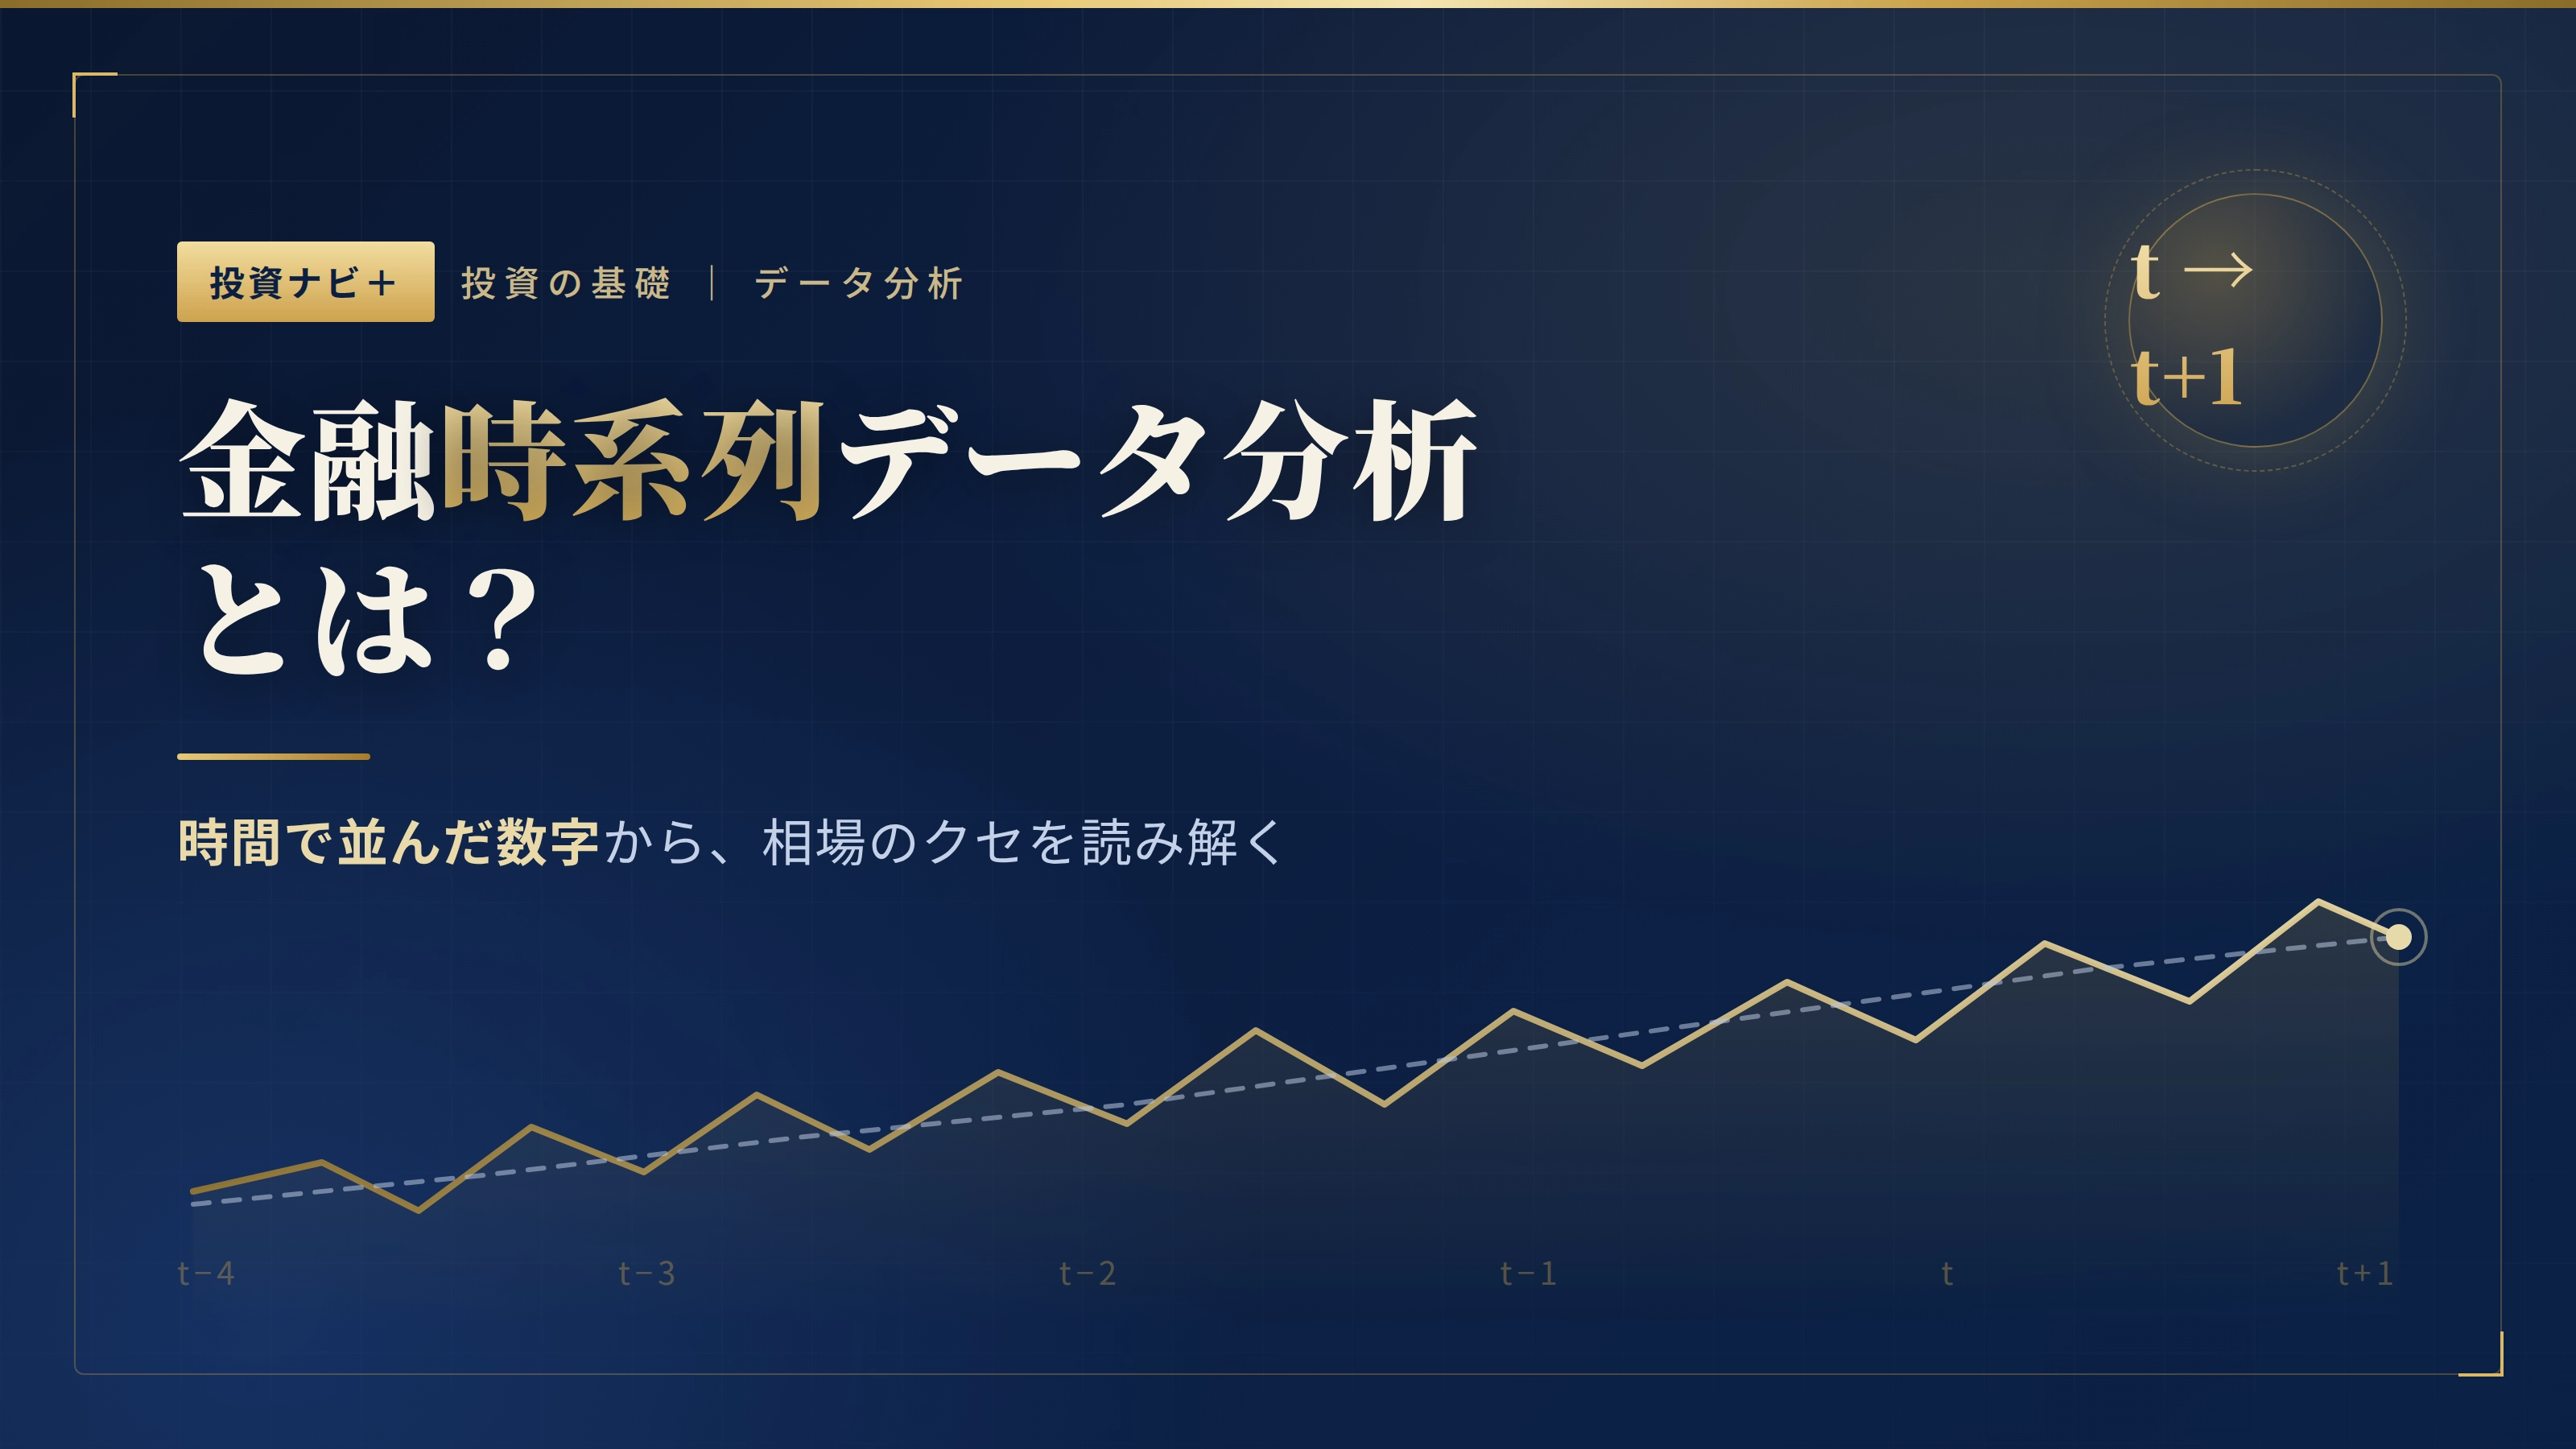
What is financial time series analysis?
What is Financial Time Series Analysis? — A beginner-friendly explanation of the technique to read the market from “numbers arranged in time”
In a word
Financial time series analysis is,the technique of analyzing “time-ordered numbers such as stock prices, exchange rates, and interest rates” to read patterns in price movements and hints about the future. It forms the foundation of the “quantitative investing” explained previously, linking the market to numbers, in a sensethe basic stamina to read market data.
What exactly is a “time series data”?
A “time series (time-ordered) data” refers todata recorded in chronological order. For example, “daily closing prices” or “1-minute USD/JPY rates.” Unlike ordinary data (e.g., a class roster of heights),the order itself has meaning. Yesterday’s price and today’s price are connected, and “changing the order would destroy the meaning” — this is what makes time-series analysis fascinating and challenging.
The unique quirks of financial data
Financial time series such as stock prices have properties not found in textbook data. First① Trends. They have a general direction—rising or falling. Next② Volatility clustering. Periods of turbulence and calm tend to cluster, and “big moves today tend to follow big moves tomorrow.” Furthermore③ Non-stationarity. Means and volatility change over time, so “rules that worked in the past may not work now.” And④ Fat tails. Large crashes that are rare in theory occur much more often in practice.
Understanding these four quirks is crucial to the success of analysis.
Basic steps of analysis
The general flow consists of four stages. First① Collect and clean the data. Fix gaps and outliers, and if needed convert “price” to “return (change rate)” (in finance, changes are often analyzed rather than raw prices). Next② Visualize. Plot charts to visually inspect trends, seasonality, and volatility. Then③ Model the data. Express price movements with mathematical formulations. Finally④ Validate. Test whether the model explains and predicts well on past data and improve it.
Common analysis methods (mini glossary)
Moving average:A line connecting the average of the most recent days. A fundamental method that smooths noise to reveal the trend.
Autocorrelation:“How much do past values and current values move together” as an index. It checks whether there is a pattern (continuity) in price movements.
ARIMA model:A classic time-series model that uses past values and their errors to predict the future.
GARCH model:A representative method to forecast the volatility itself—the swings between calm and turbulent periods. It is valuable in risk management.
Stationarity tests:Statistically checking whether data is in a stable state that is easy to analyze. A crucial step to verify assumptions before analysis.
Machine learning and deep learning:In recent years, approaches using AI such as LSTM have become more common to learn more complex patterns.
What is it good for?
Financial time series analysis is not only aboutmarket forecasting. In practice, the important part isrisk management. If you can estimate “how turbulent tomorrow might be,” you can adjust the size of your positions accordingly. It can also measure the co-movement of multiple assets to informdiversified investing, or detect mispricing to help withstrategy development. The applications are broad.
Common pitfalls to watch out for
Three issues beginners should especially beware. FirstOverfitting (curve-fitting). A model that fits past data perfectly may crumble in reality. Second ispeek-ahead bias (information leakage). If, during validation, you inadvertently use information that would not have been known at that time, performance appears better than it really is. Third isconfusing correlation with causation. Just because two things move together doesn’t mean one causes the other. Avoiding these three dramatically improves the reliability of analysis.
Summary
Financial time-series analysis isthe skill to read market quirks from “numbers ordered by time” and apply it to forecasting and risk management. While stock prices cannot be predicted perfectly,knowing roughly how turbulent it will be and what patterns exist in the datacan already significantly change investment decisions. For those who want to move beyond intuition, this is the foundational “number-based view of the market.”
※This article provides general guidance for investment education. It does not recommend buying or selling any particular method or product. Investments should be made at your own risk and judgment.
This article is a beginner-friendly general explanation. Please make actual investment decisions at your own risk.