

NK225 futures MTF Dow Theory 4-scenario analysis report 2026-07-24
NK225 Futures MTF Dow Theory Analysis Report
Date and Time: July 24, 2026 06:01 JST / Night Session
Current Value: 65,430 JPY
Subject: For intraday session (Fri 7/24)
Conclusion
In summary, after retracing to 67,090 during the day on 7/23, it fell below 66,040 in the night session to 65,000, closing at 65,430. The 1H chart turned into a downtrend with the lower high and a break of the key support at 65,640; the 4H chart held the support at 64,310 and maintained a rising trend within a down-move, while the 15m chart pivoted from 65,000 into a rising wave in a mixed phase. Throughout Friday, the battle centered around support at 65,150–65,000 and resistance at 65,640–66,040, with direction determined by where the close breaks.
If 65,640 is penetrated by the 15m close, go long on a reversal; if a rebound occurs from 65,150–65,000, buy on dips. Upward resistance at 65,640–66,040 and 66,530–66,880 may cause a pullback on the 1H short-term uptrend. If 65,000 is closed below on the 15m, decline resumes; a break below 64,310 (1H/4H support) would flip the 4H to a rising trend. A recovery to 66,030 (1H turning point) would end the 1H downleg, and a recovery to 66,880 (4H turning point) would restart the 4H uptrend. Protect positions early in all outcomes.
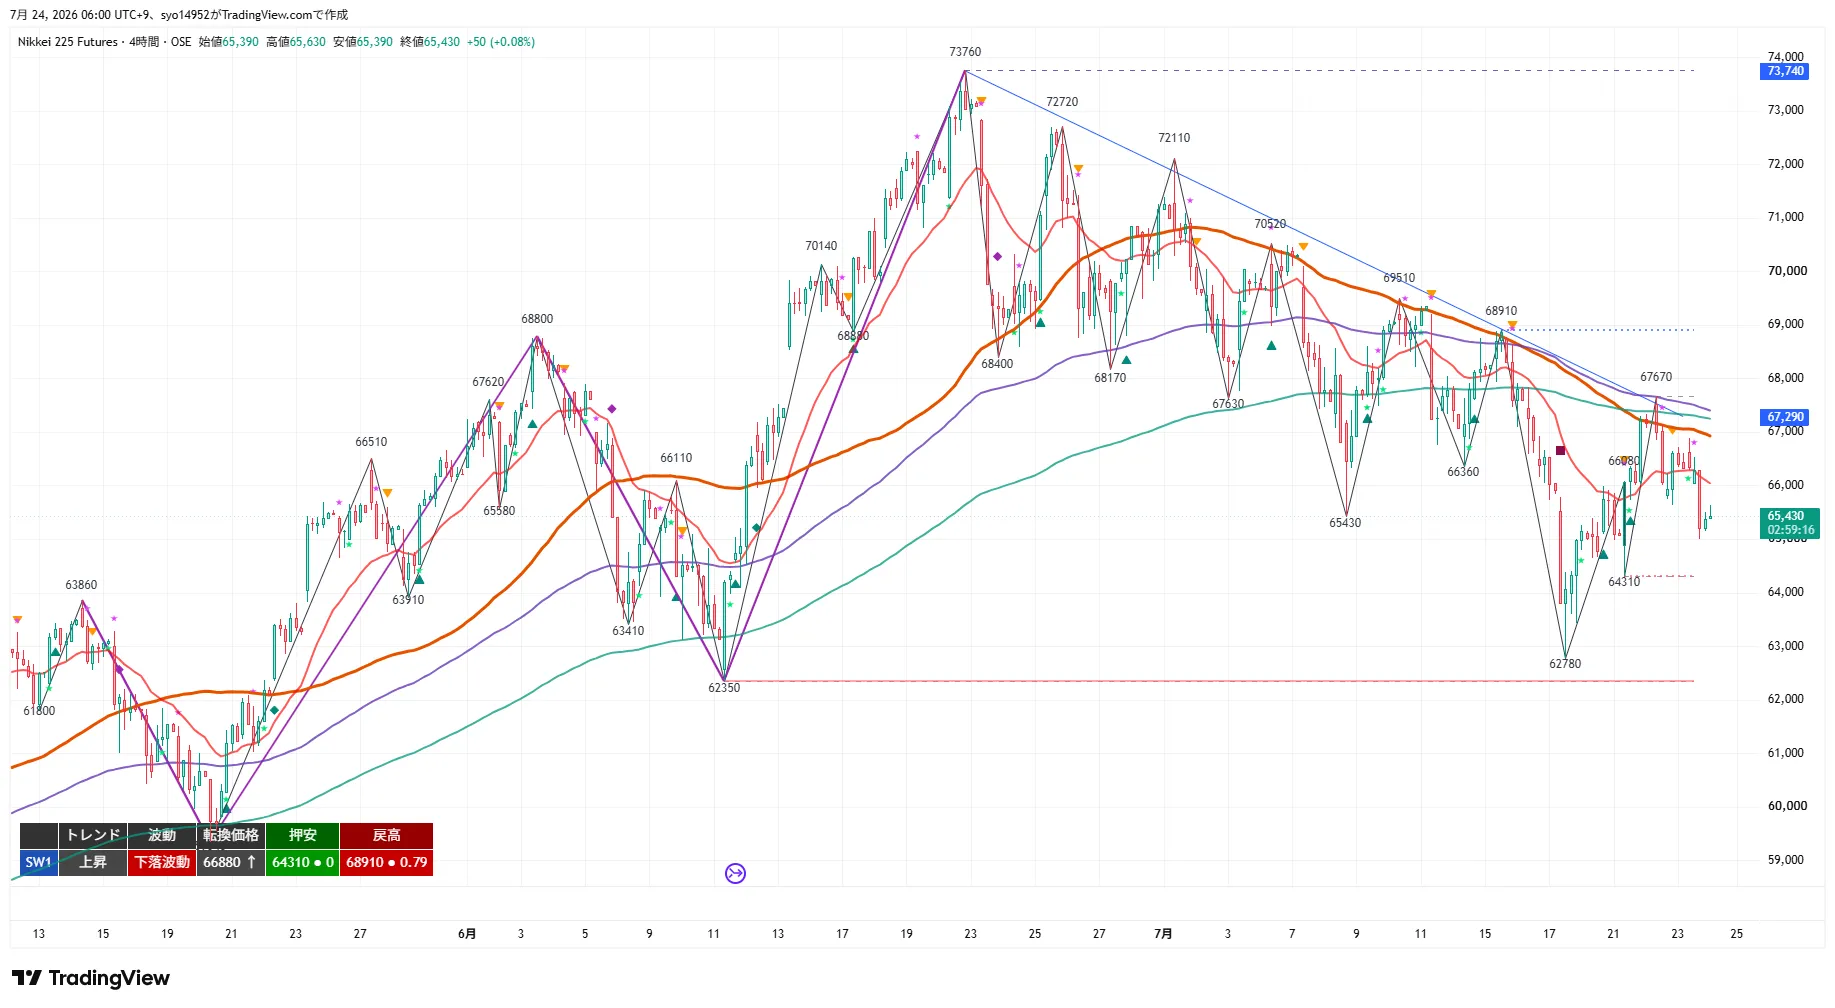
4H Analysis
The 4H chart is maintaining an uptrend, but the waves are still in a down-move sequence. After falling from 67,670 to below 66,040 and down to 65,000 before closing at 65,430, the turning price shifted from 67,670 to 66,880, and only a close back above this level would resume the up-wave. The 20EMA has turned downward, price sits below it, and the 120EMA (daily 20EMA equivalent) and 200EMA are positioned above the price.
Key upper levels are 66,030 (1H turning point), 66,530, 66,880 (4H turning), 67,090, and 68,910. Key lower levels are 65,150 (15m support), 65,000 (Night session low), 64,830, and 64,310 (support line). As long as 64,310 holds, the 4H uptrend remains intact, but given a clear break below the 20EMA with ongoing down-move, the market is entering a zone where rebounds are more likely to be sold.
1H Analysis
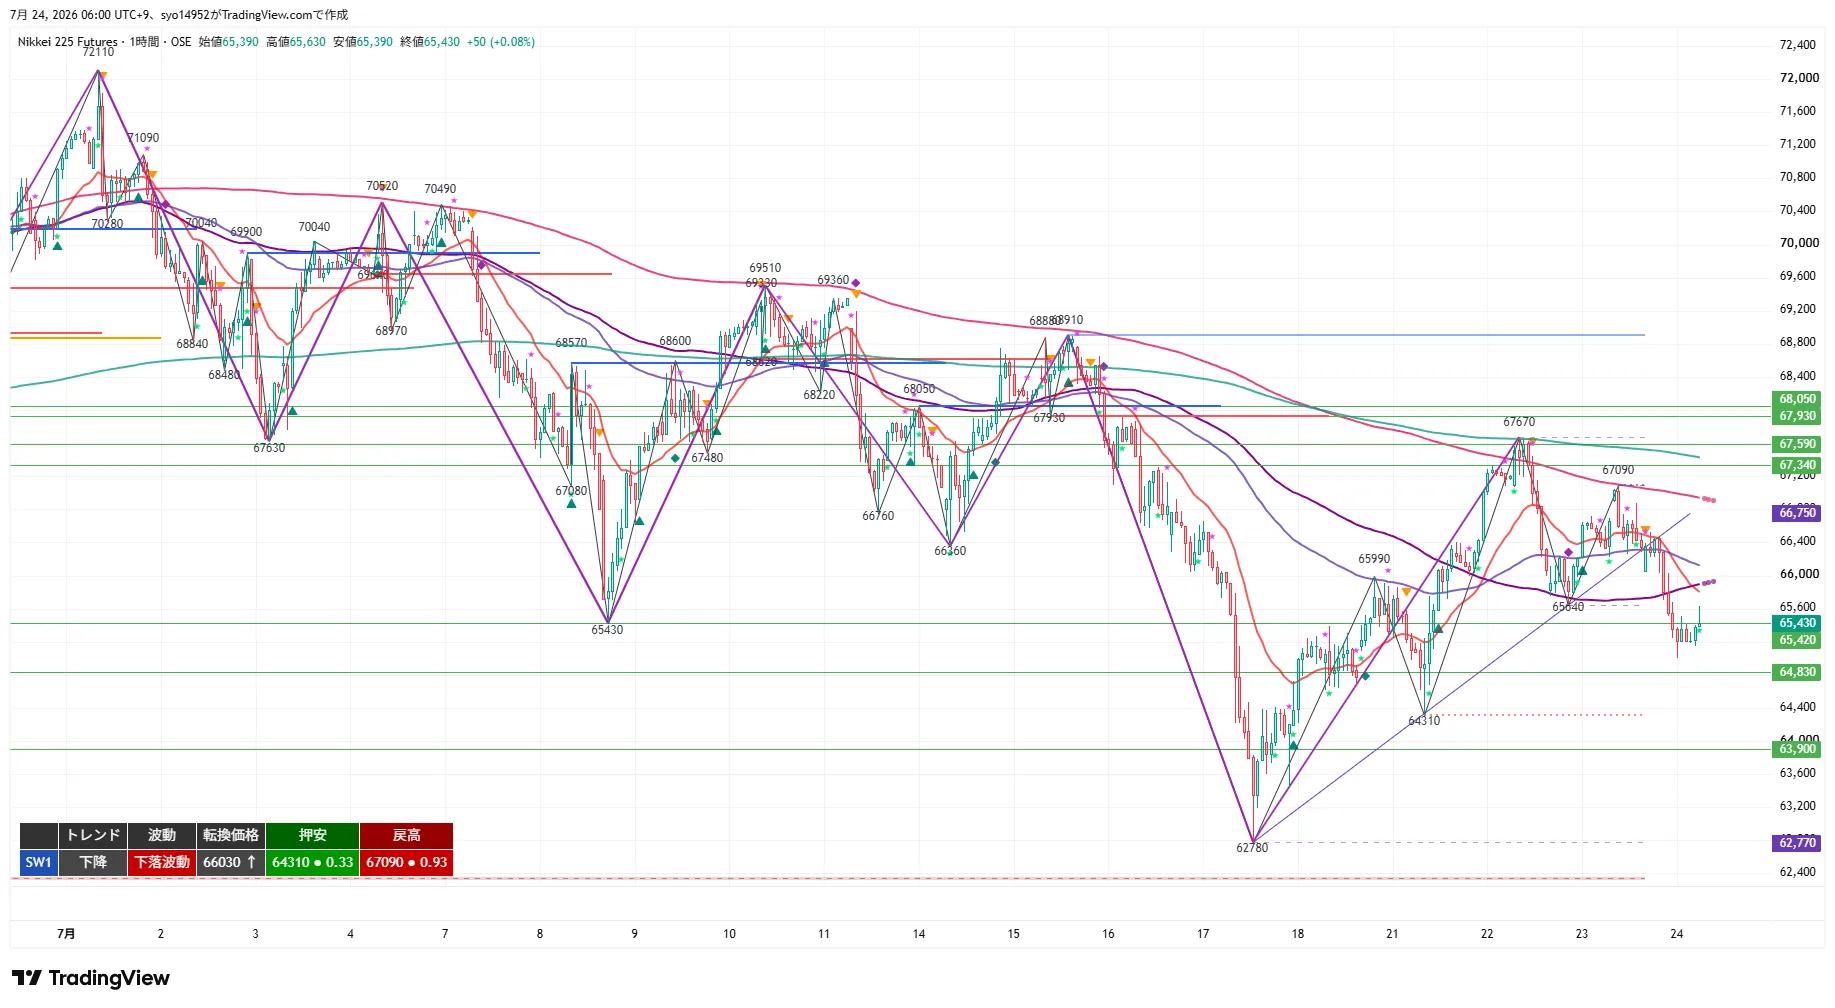
The 1H has shifted to a downtrend and down-move. The higher low of the rebound fell from 68,910 to 67,090 (7/23 high), and a close below 65,640 confirms the downtrend. Turning price is 66,030. All major moving averages (20EMA, 80EMA (4H 20EMA equivalent), 480EMA (daily 20EMA equivalent)) are downward sloping, with price below them.
Until a 1H close recovers above 66,030, the short-side remains dominant with rebounds only considered after a true recovery. If price closes below 65,000 on a 1H basis, downside continues; a break below 64,310 would flip the 4H upward trend. Resistance zones are 65,640–66,040 and 66,530–66,880.
15m Analysis
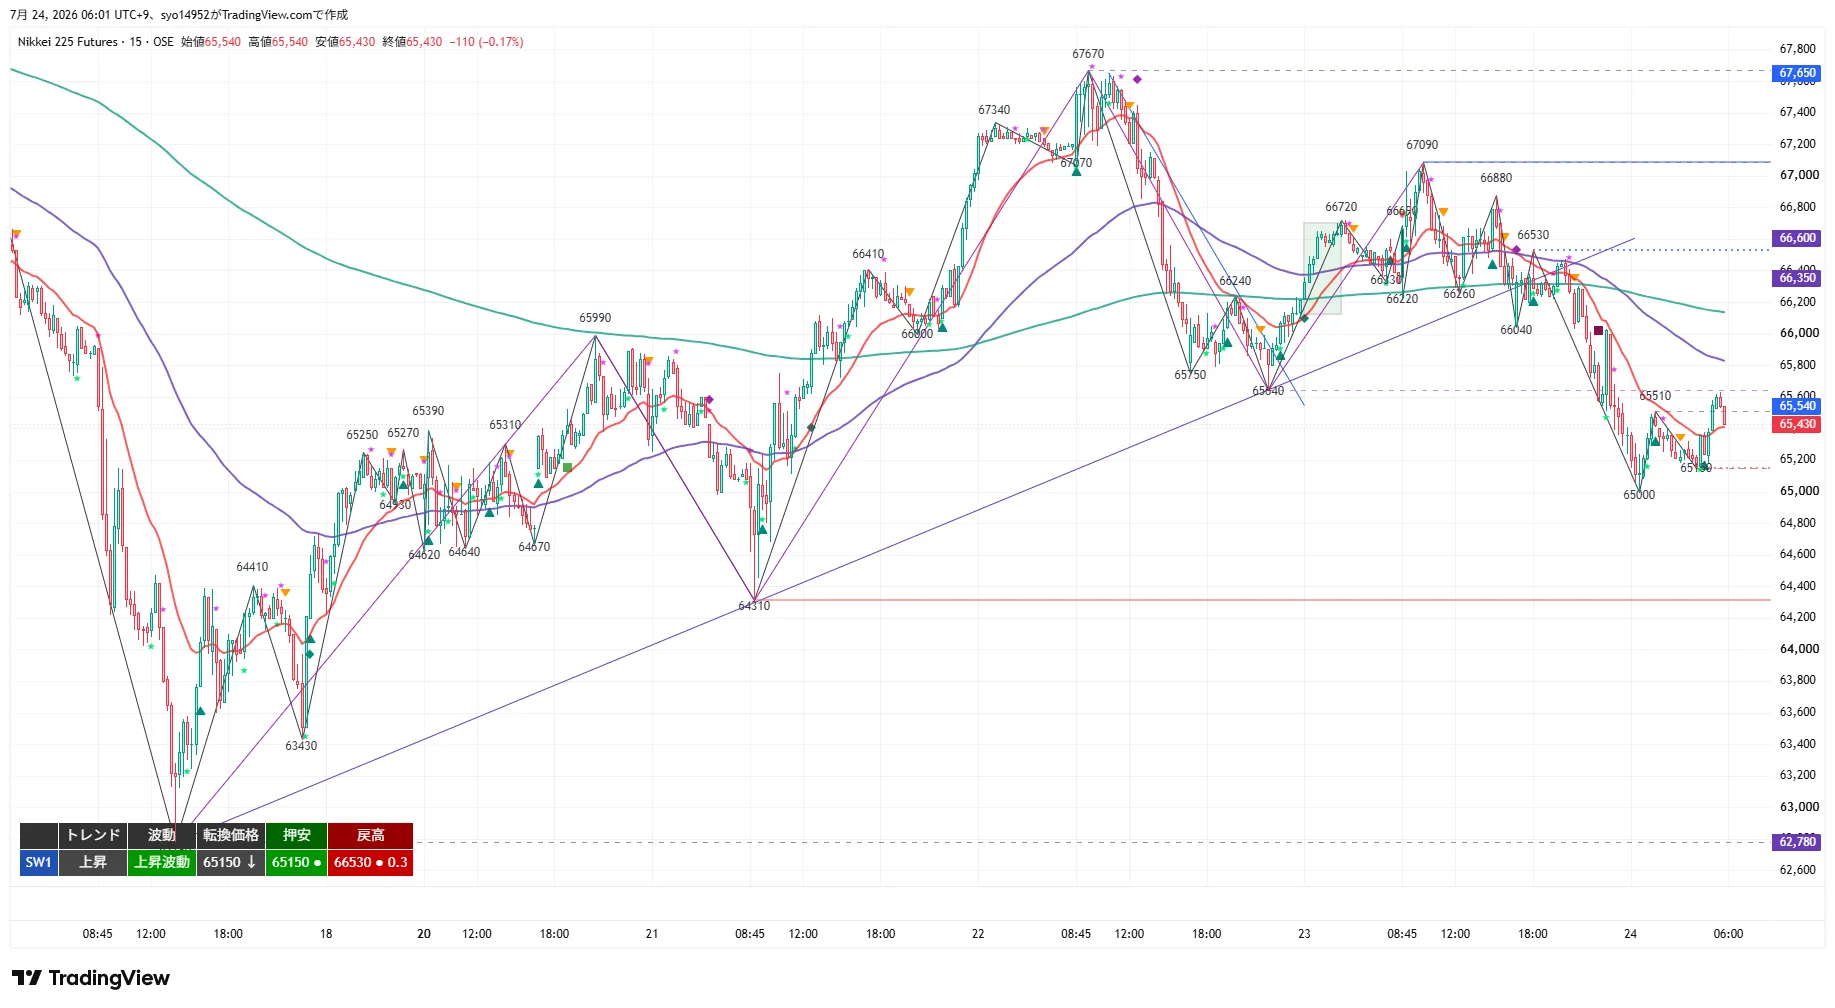
The 15m chart has reversed from 65,000 into an upward move. Turning price and support are 65,150, with a rebound high at 66,530. It retraced from 65,000 to 65,510, dipped to 65,150, then ended at 65,430. The 20EMA has turned positive with price above it, while the 80EMA (around 65,900) and 320EMA (around 66,200) sit above.
In the short term, 65,150–65,000 acts as support, with 65,640 as a break-even line turning into resistance. A breakout above 65,640 on a close can extend the rebound toward 66,220–66,530; a dip to 65,000 would negate the upmove.
MTF State
- 4H: Up/Down-move. Fell from 67,670, breached 66,040 to 65,000, closing at 65,430. Turning level 66,880; support 64,310; rebound high 68,910. 20EMA downward; price below it.
- 1H: Down/Down-move. Rebound high to 67,090, broke 65,640 support to turn down. Turning price 66,030; support 64,310; rebound high 67,090. All MAs downward; price below.
- 15m: Up/Up-move. Rebounded from 65,000 to 65,430. Turning/breaking levels 65,150; rebound high 66,530. 20EMA positive slope; price above it.
- Consistency: 4H uptrend (down-move), 1H downtrend (down-move), 15m uptrend (up-move) are mixed. 4H holds 64,310, but 1H down indicates rebounds are sold. Treat the four frames as equally valid, with price action in the 65,150–65,000 support and 65,640–66,040 resistance as the main battleground.
Key Prices
- 68,910 JPY: 4H rebound high. The main resistance.
- 67,670 JPY: 7/22 high.
- 67,090 JPY: 1H rebound high (7/23 high). Major resistance.
- 66,880 JPY: 4H turning price. A close back above would resume the 4H up-move.
- 66,530 JPY: 15m rebound high. Upper bound of rebound sell zone 2.
- 66,220 JPY: Upper hurdle. ①T1.
- 66,040 JPY: 7/23 night rebound low = resistance turned; upper bound of rebound sell zone 1.
- 66,030 JPY: 1H turning price. ①② main consolidation line.
- 65,640 JPY: Old 15m support (broken) = resistance turned. ① Trigger; ② T1 / lower bound of rebound sell zone 1.
- 65,540 JPY: Recent 15m high.
- 65,430 JPY: Current price / night close price.
- 65,150 JPY: 15m support / turning price. Upper bound of rebound buy zone 1.
- 65,000 JPY: 7/24 night low. Lower bound of rebound buy zone 1 / break triggers continuation of decline / ④ Trigger.
- 64,830 JPY: 1H lower support. Upper bound of deep pullback zone (minor level).
- 64,310 JPY: 1H/4H support and 4H uptrend lifeline (as of 7/21).
- 63,900 JPY: Downside pivot.
- 62,780 JPY: 4H structural low.
Trade Ideas
① Break-following (Long)
- Trigger: Break above 65,640 (old 15m support turned resistance) with a 15m close.
- Lead: After the break, pullback toward the breakout level or along the inclined 20MA in 1m/5m mini-bars as a back-entry, price-based.
- Core condition: 66,030 (1H turning price) recovers on a 1H close = end of the 1H down-move.
- Stop/Invalidation: Front-run at or below 65,290; core leg at or below 65,150.
- Targets: 66,220 (partial take + base), 66,530 / 66,880.
- RR: T1 (66,220) = 1.7 / T2 (66,530) = 2.5.
- MFE protection: close or small profit exit at +200; secure at least +100 with +300 or use trailing. Protect early when 1H is turning down.
② Buying on Dips (Long)
- Standard: Dip to 65,150–65,000 (15m support / turning price ~ 7/24 night low) and confirm with a 15m close; deeper pullback to 64,830–64,310.
- Core condition: 66,030 recovers on a 1H close.
- Stop/Invalidation: Front-run at 64,930; core at 64,830; full exit below 64,310; clear break below 65,000 can be avoided; 64,310 break flips 4H to uptrend (switch to ④).
- Targets: 65,640 (partial take + base), 66,030 / 66,530.
- RR: T1 (65,640) = 1.6 / T2 (66,030) = 3.1.
- MFE protection: +200 for base or small profit exit, +300 for at least +100 or trailing. On 4H the trend is still up while the 1H is declining, so rely on strong support confirmations; if the trigger is confirmed, T1 may be skipped.
③ Retrace Sell (Short)
- Standard: From 65,640–66,040 (resistance turned to) where it stalls; confirm the stall with a 15m close. Zone 2 is 66,530–66,880 (15m rebound high to 4H turning price).
- Core condition: Break below 65,000 (Night low) on a 1H close = downtrend continuation.
- Stop/Invalidation: Front-run recovers to 66,220 (or 67,000 if a deep pullback occurs); core recovers 66,030. Strong invalidation at 66,880 (4H turning back).
- Targets: 65,000 (partial take + base), 64,310 / 63,900.
- RR: T1 (65,000) = 2.8 / T2 (64,310) = 5.0.
- MFE protection: +200 for base or small profit exit, +300 for at least +100 or trailing. On 1H the bias is still long, but since 4H remains in uptrend, avoid chasing too deep; if the 20EMA on the 15m is positively sloped, do not press early. If a confirmed trigger reaches T1, skip.
④ Break-following (Short)
- Trigger: Break below 65,000 (7/24 night low) with a 15m close (collapse of 15m up-move, downtrend resumes).
- Lead: After the break, pull back toward the breakout price vicinity or along the inclined 20MA using short time frames like 1m/5m to lead entry (back-entry, breakout price baseline).
- Core condition: Break below 64,310 on a 1H close (1H/4H support breaks = 4H uptrend reversal). At this point the front-run has already reached T1, so take partial profit + adjust base, and add the core position.
- Stop/Invalidation: Front-run recovers to 65,350; core recovers to 65,640. Full exit at 66,030.
- Targets: 64,310 (partial take + base), 63,900 / 62,780.
- RR: T1 (64,310) = 2.0 / T2 (63,900) = 3.1. 64,830 is a minor resistance with RR < 1.0, so not used for T1.
- MFE protection: +200 for base or small profit exit, +300 for at least +100 or trailing. While 4H remains in uptrend, avoid overextending on the risk; wait for confirmation on the 15m 20EMA positive slope and skip if not confirmed. If the trigger is confirmed and T1 is reached, skip risk.
Action at present
- Most important Line 1: 65,150–65,000. 15m support; turning price to Night low. Use for dip buys; break below 65,000 on 15m close would resume decline (switch from ② to ④), with a break below 64,310 flipping the 4H to uptrend.
- Most important Line 2: 65,640–66,040. Resistance turn to support from 7/23 night low; a close above 65,640 opens the path for a rebound long (66,220 → 66,530), otherwise use 1H uptrend pullback sells if it stalls. If 66,030 recovers, 1H down move ends; 66,880 recovery restarts 4H upmove.
Entry prices, triggers, and stop levels are set based on the chart shape at the time of close (turning price, support, and rebound highs of each timeframe). If the structure evolves over time, and there is no higher-frame structural change, entry prices will be adjusted based on the lower-timeframe wave turning points (e.g., a short timeframe that switches from a down-move to an up-move) to better reflect actual conditions and will be compared to the initially set values to adopt the more accurate one.
※This report is provided for information purposes and is not investment advice; please make your own trading decisions.