
Market expectations for BOJ rate hike ???
Latest 2026 Edition!!
Watch the interview with Go Go Japan president Hayakawa and me here
There are also free gifts available.
Good morning everyone.
Yesterday’s USD/JPY traded in a high range with no clear direction, forming a range.
After the Bank of Japan rate hike rumor at around 4:30 PM, it briefly fell, then recovered, and now is waiting at a price level as if nothing happened.
There is a saying “summer doldrums,” but recently it feels like yen appreciation in summer.
What about you?
Two years ago, on August 5-6, the Nikkei briefly plunged and USD/JPY also tumbled.
With the extreme heat, are politicians getting their heads heated as well?
On the last business day of this month, Friday the 31st, the BOJ Monetary Policy Meeting will take place.
・Will there finally be a large intervention to push the yen higher
・Or will they only bluff with rhetoric to shake the market
・Or will they push prices down just to buy them back up
・Will interventions create momentum for an upward move after a pullback
Well, in the past BOJ has done various things, but we’d like an impact close to the Koeda Bazooka’s scale.
And preferably a downward move...
Those holding long positions should be cautious on the 31st, I think.
To be clear, if the BOJ policy announcement exceeds 12:40, it generally moves surprisingly in ridiculous ways.
More precisely, after 12:37 it starts moving.
Whether they keep rates unchanged or not, it’s better to watch the announcement time closely.
Someone on the internet is probably writing about the announcement time, so please google it.
USD/JPY 1-hour & 1-minute charts
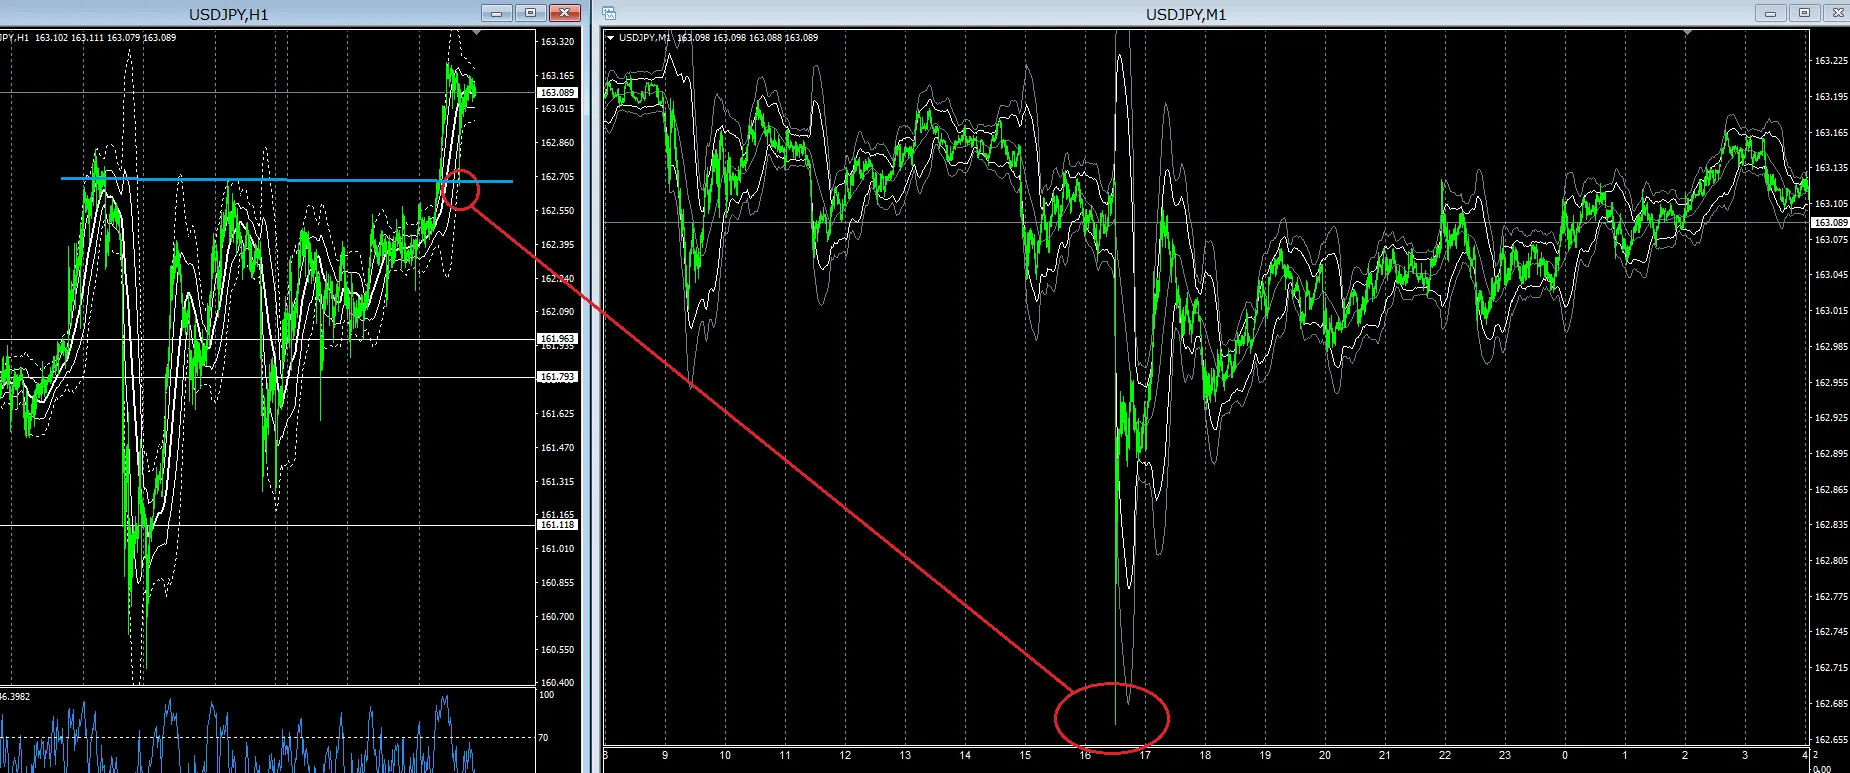
The USD/JPY briefly fell on expectations of an earlier BOJ rate hike.
It was a doping-like move, so it quickly returned, but if BOJ shows real seriousness, will it fall more?
Over the past 2-3 years, currency interventions have seemed to fail, but perhaps they were actually successful as a strategy to push lower.
Well, this is hard to say, but when we’re watching the chart, if it’s rising, it may be because they want to push it up to make the drop appear as a rise.
If you think that when it’s falling they’re pushing it down to later push it up, you’ll be able to view the chart more calmly.
It’s often easier to take a long position during a rising trend than during a fall; if it’s falling, you’ll have a better chance by taking a long position after the decline ends and it starts to rise again.
Entering an L-position during a downtrend is difficult, but if you have a strategy to enter L around the blue horizontal line drawn under the red circle in the attached chart, there are times when it works out in the end.
This is just a post-hoc reasoning, but looking at past charts, reversals often occurred around such levels.
So, there is value in trying an L-position at least once.
That sounds like an obscure contrarian approach, doesn’t it?
If you think so,
is a simple way to start.
For users, you probably understand what is being implied, but unpredictable spikes can occur at any time, so if you happen to encounter such a setup, it might be wise to take on risk and position yourself.
Those can quickly become profits, so not taking action isn’t an option.
That’s why FX trading not your ordinary hedged position
also exist.
Ways to use it are varied.
What to watch for is…
・Right after the Tokyo stock market opens
・The Tokyo interbank rate
・The start of the Chinese stock market
・The start of the London stock market
・The start of the New York stock market
・London Fix
・The high/low and rebounds up to London time
These are the moments to monitor.
For multi-millionaire traders, monitor the 1-minute chart’s buy/sell transitions around the above events.
Especially after the day’s high and low are set, it’s a key check.
Thank you for your continued support today as well.
If you want to succeed in trading, if you want to earn a living from trading, this is the training method I highly recommend, a technique you can master on your own: