
NK225 Futures MTF Dow Theory 4-Scenario Analysis Report 2026-07-23
NK225 Futures MTF Dow Theory Analysis Report
Date and time: July 23, 2026 06:01 JST / Night session close
Current value: 66,330 yen
Subject: For intraday session (Thu, 7/23)
Conclusion
In summary, it rose to 67,670 intraday on 7/22 and then reversed, pushed down to 65,640 at night, then recovered to 66,720, and closed at 66,330. The 4H is in a rising trend but the wave is in a corrective (downward) phase, while 1H and 15m have returned to an ascending wave, indicating a continuation of the uptrend within a corrective phase. On Thursday, we expect a renewed rise with pullbacks, but the 4H upper moving average band at 67,300–67,600 is capping the upside, so upward chasing should be approached with caution.
If there is a pullback to 66,190–65,980 and it rebounds, buy on pullbacks; if the 15m close above 66,720, follow with a breakout trade. Upside zones are 66,720–67,340 and 67,590–67,670 (return-rally zone); if momentum stalls, take profits on a contrarian rebound. If 65,640 closes below on the 15m, the upward wave would fail; a break below 64,310 (support line) would flip the trend to uptrend. Only after a close above 67,670 on the 4H will the 4H upwave resume. Protect all levels promptly.
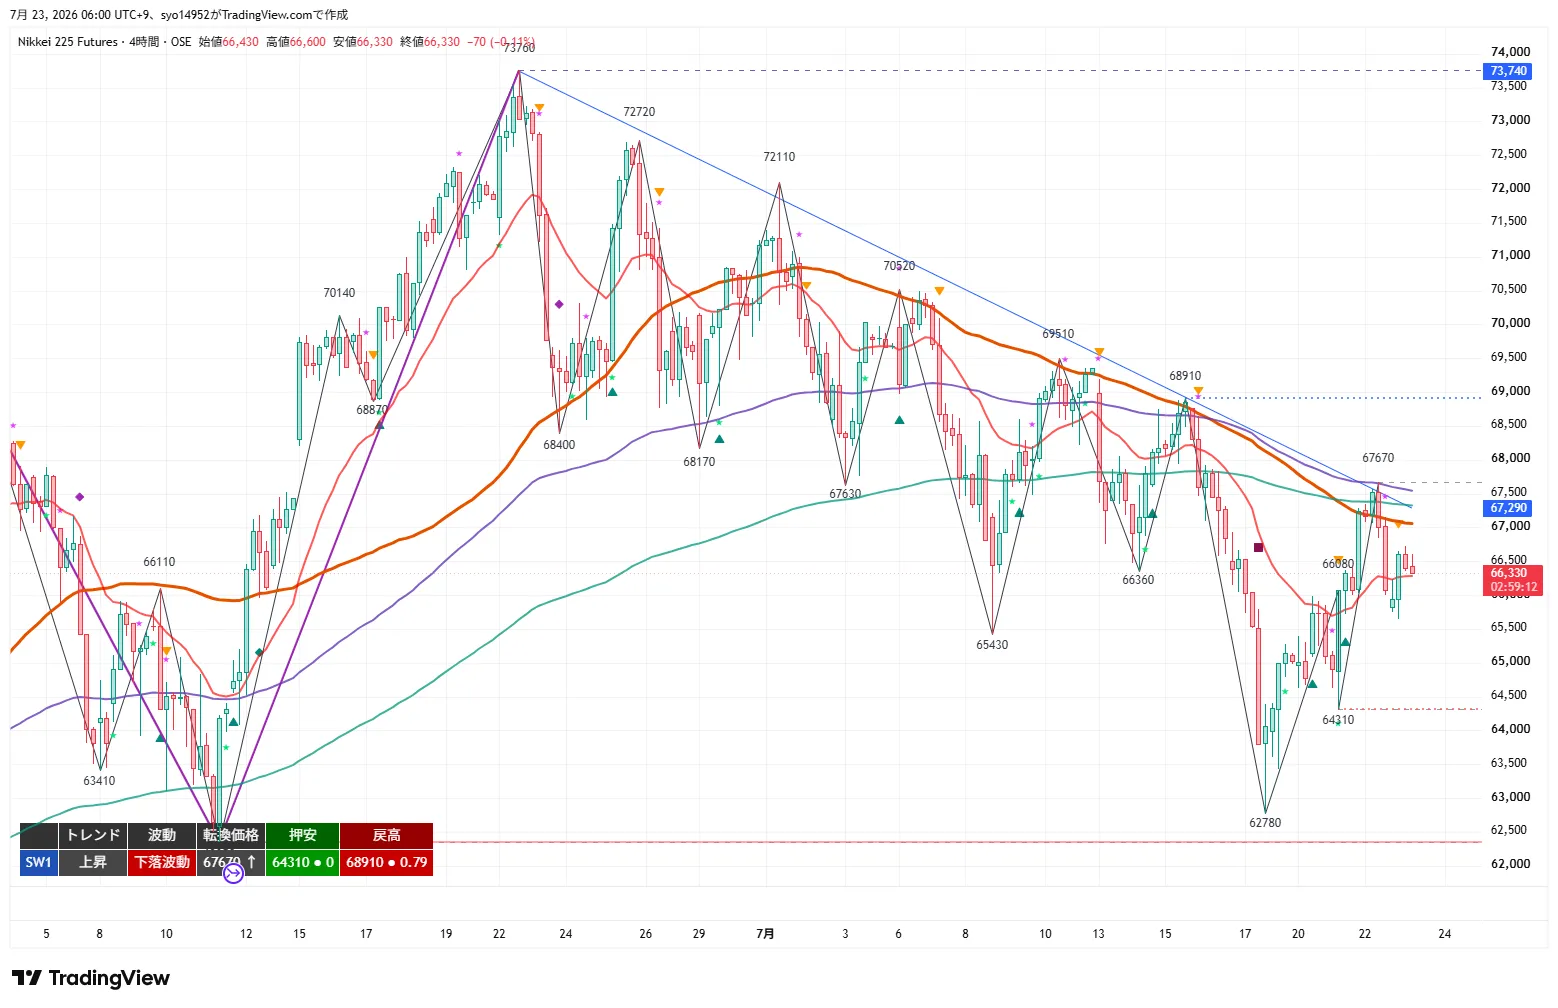
4H Analysis
The 4H maintains an uptrend while the wave turns into a downward wave. It rose to 67,670 (7/22 high) and then reversed, with a bearish candle closing at 66,330. The turning price is 67,670; only closing above this level will restart the upward wave. The 20EMA is rising and near price, but the 120EMA (daily 20EMA equivalent) and 200EMA form a band around 67,300–67,600 that caps upside.
Key resistance levels: 67,340, 67,590 (upper MA band), 67,670 (turning price), 67,930, 68,910 (retracement high / major wall). Support levels: 65,980 (1H turning price), 65,640 (15m pullback low), 64,310 (pullback low / lifeline). As long as 64,310 holds, the uptrend remains intact, but given it has been rejected by the upper MA band, upside may be heavy with pullbacks anticipated.
1H Analysis
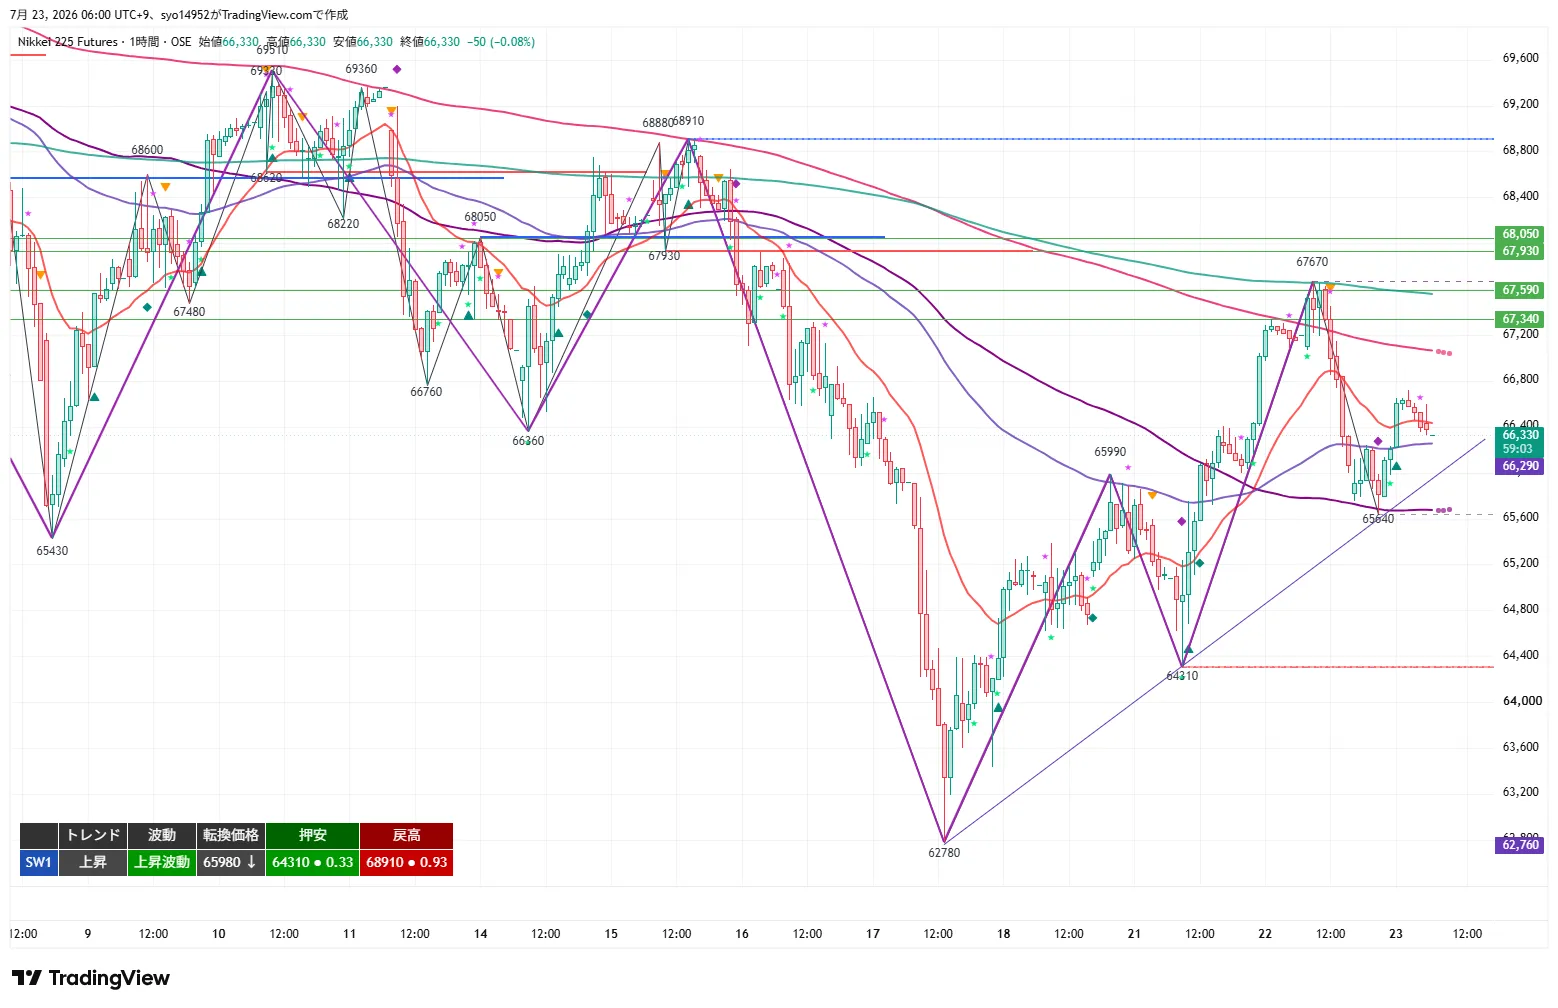
The 1H remains in an uptrend and rising wave. After a pullback from 67,670 to 65,640 and rebound, it moved through 66,720 and closed at 66,330, with turning price at 65,980. The 20EMA is rising, and the price sits above it, with the 80EMA (4H 20EMA equivalent) near 66,290 just below price.
As long as 65,980 closes above on the 1H, the upwave should continue, and a break above 66,720 should extend the retracement. If 65,980 closes below on the 1H, the upwave would fail and a break below 64,310 would flip to an uptrend. Upside zones to watch are 66,720–67,340 and 67,590–67,670 as retracement sell zones.
15m Analysis
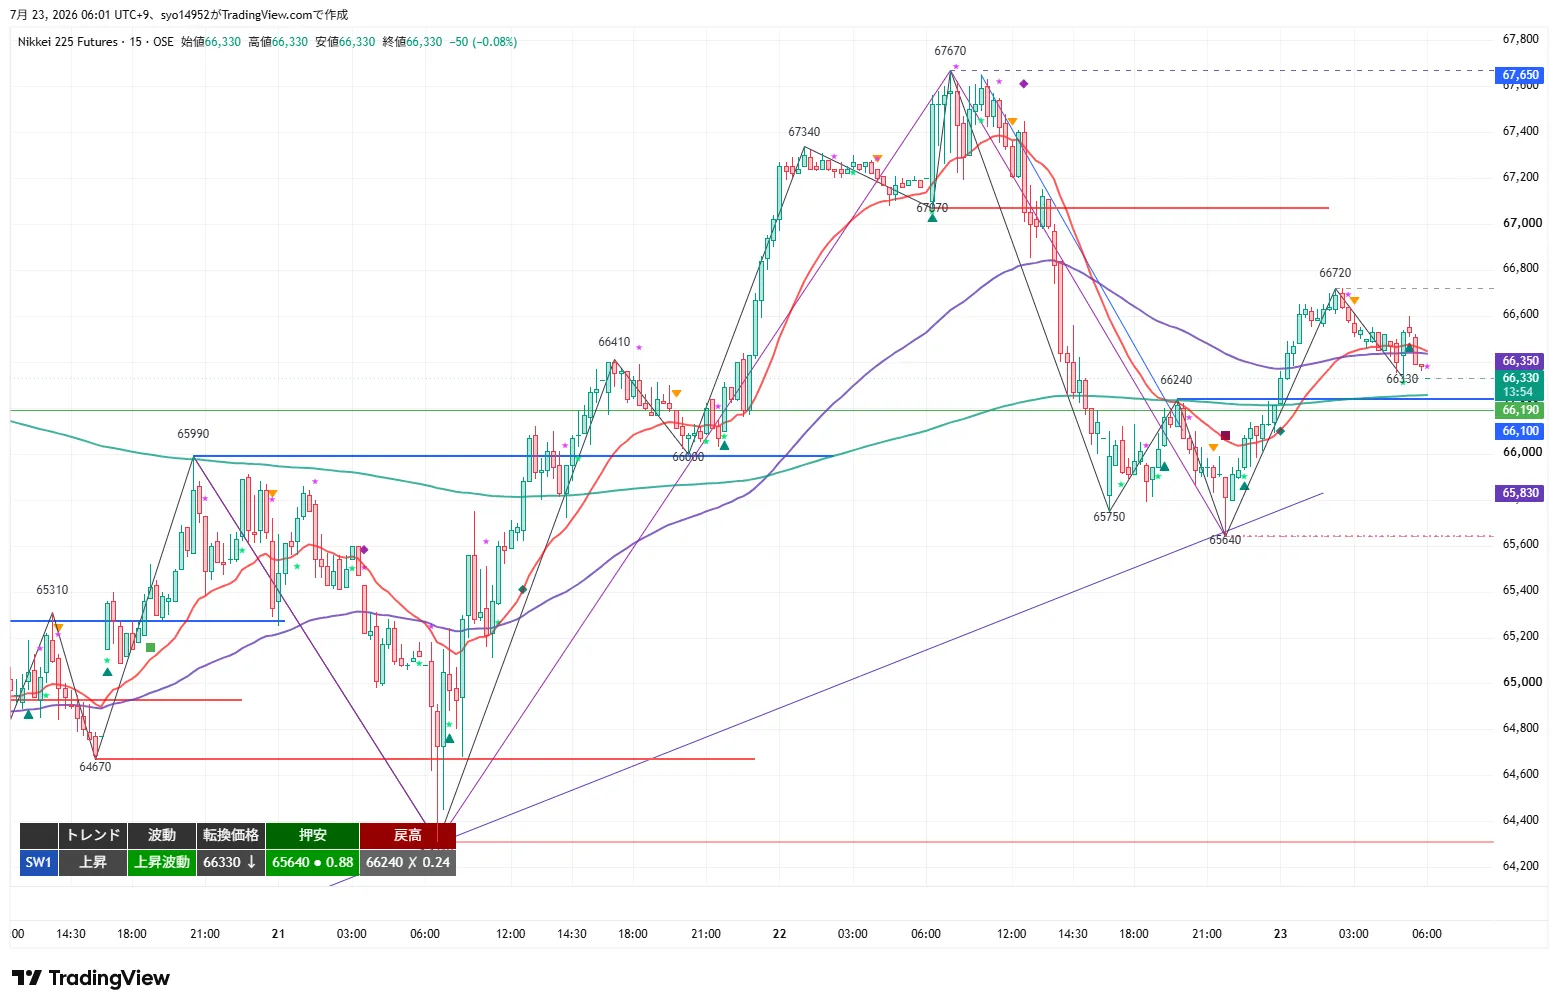
The 15m shows an uptrend and rising wave, with turning price 66,330, pullback low 65,640, and retracement high 66,240 already broken above. It retraced from 66,720 back to 66,330 and closed there. The 20EMA has turned negative and sits near price; the 80EMA (1H 20EMA equivalent around 66,190) and 320EMA (4H 20EMA equivalent) provide support below.
Near-term support for pullbacks is 66,190–65,980, with 66,720 as the immediate breakout level. A close above 66,720 would push the upwave to new highs (follow-through path); a pullback to 66,190–65,980 and rebound would suggest buy on pullback; a close below 65,640 would break the upmove.
MTF Status
- 4H: Uptrend / Downward wave. Rallied to 67,670 then reversed with a -0.11% bearish candle at 66,330. Turning price 67,670; support at 64,310; retracement high 68,910. 20EMA rising, upper band of 120/200EMA near 67,300–67,600 acting as resistance.
- 1H: Uptrend / Upward wave. Rebound from 65,640 to 66,330. Turning price 65,980; support at 64,310; retracement high 68,910. 20EMA rising; price above it.
- 15m: Uptrend / Upward wave. Retraced to 66,330 after returning to 66,720. Turning price 66,330; pullback low 65,640; retracement high 66,240 (already broken above). 20EMA negative slope.
- Consistency: All four hours, 1H, and 15m are in an uptrend with aligned direction, but the 4H wave is a downward wave, while 1H and 15m have returned to upwaves. Following trades: buy on pullbacks and breakouts (trend-following long), sell on rallies (counter-trend = take profits on retracements). Upward movement extends until breaking 64,310, and 67,670 is the breakout point to resume the upwave.
Key Prices
- 68,910 yen: 4H / 1H retracement high. The biggest upside barrier.
- 67,930 yen: 1H prior pullback low = resistance turned. ①T2.
- 67,670 yen: 4H turning price; high of 7/22. A close above this level will restart the 4H upwave.
- 67,590 yen: 4H upper MA band (120EMA = daily 20EMA) / 200EMA. Retracement zone 2.
- 67,340 yen: 7/22 key level. Upper boundary of the main position / T1 of retracement sell zone.
- 66,720 yen: 15m recent retracement high. Trigger 1 / lower boundary of retracement sell zone 1 (and entry point for breakout).
- 66,330 yen: Current price / Night close. 15m turning price.
- 66,240 yen: 15m retracement high (X = already broken above).
- 66,190 yen: 15m 80EMA (1H 20EMA equivalent) support. Upper boundary of pullback buy zone 1.
- 65,980 yen: 1H turning price. Lower boundary of pullback buy zone 1.
- 65,830 yen: Breakpoint while rebounding. Upper boundary of deep pullback zone.
- 65,750 yen: Night low of 7/22.
- 65,640 yen: 15m pullback low (7/23 night low). Breaking this would invalidate the upward wave and trigger ④.
- 65,310 yen: Downward turning point.
- 64,670 yen: Downward turning point. ④T1.
- 64,310 yen: 1H/4H pullback lows (7/21). Lifeline of the uptrend.
- 62,780 yen: 4H structural low.
Trade Ideas
① Breakout Follow-Through (Long)
- Trigger: Close above 66,720 (15m recent retracement high) on 15m close (new high in rising wave).
- Premise: After the breakout, pullback toward breakout price vicinity or near the inclined 20MA on short timeframes (1m, 5m) as a back-entry based on breakout price.
- Positioning: Break-even recovery above 67,340 on 1H close.
- Stop / invalidation: Exits if 66,290 is crossed on the breakout side; main position invalidates below 65,980.
- Targets: 67,340 (partial profit + entry price), 67,930 / 68,910.
- RR: T1 (67,340) = 1.4 / T2 (67,930) = 2.8. Since T1 isn’t thick, emphasize back-entry and focus on main position.
- MFE protection: +200 yen to break-even or small profit exit, +300 yen to secure at least +100 yen or trail. 4H upper MA band and 67,670 tend to be resistance, so protect early.
② Buy the Dip (Long)
- Standard conditions: Pull back to 66,190–65,980 (support zone equivalent to 15m 80EMA ~ 1H 20EMA) and confirm rebound on 15m close. Deep pullback around 65,830–65,640.
- Positioning: 66,720 recovery on 1H close.
- Stop / invalidation: Break below 65,780 (65,560 on deep pullbacks) for the head position; head position breaks 65,560. Full exit below 64,310. If 65,640 breaks clearly, skip the upmove (switch to ④).
- Targets: 66,720 (partial profit + entry), 67,340 / 67,670.
- RR: T1 (66,720) = 1.9 / T2 (67,340) = 3.9.
- MFE protection: +200 to break-even or small profit exit, +300 to ensure at least +100 or trail. Since 4H is in a downward wave, protect early for pullbacks.
③ Sell the Rally (Short)
- Standard conditions: 66,720–67,340 (15m recent retracement high – 7/22 key level) capped on upside; confirm stall with 15m close. Zone 2 is 67,590–67,670 (4H upper MA band / 4H turning price).
- Head position: Break below 65,640 on 1H close (upward wave fail).
- Stop / invalidation: Break above 67,000 recovers (deep pullback may go to 67,760), head position recovers above 66,720. Strong invalidation at 67,670 (4H turning recovery).
- Targets: 65,640 (partial profit + entry), 65,310 / 64,670.
- RR: T1 (65,640) = 3.5 / T2 (65,310) = 4.6.
- MFE protection: +200 to break-even or small profit exit, +300 to secure at least +100 or trail. Since it's a contrarian move in an uptrend on higher timeframes, take profits on retracements only, avoid chasing; avoid aggressive entries above the 20MA. If the trigger bar has reached T1, wait.
④ Breakout Follow-Through (Short)
- Trigger: Break below 65,640 (15m pullback low / 7/23 night low) on 15m close (structure of rising wave breaks).
- Premise: After the breakdown, pullback toward the breakout price vicinity or the inclined 20MA on short timeframes (1m, 5m) as a back-entry based on breakout price.
- Head position: Break below 64,310 on 1H close (pullback lows on 1H/4H = uptrend reversal).
- Stop / invalidation: Break above 66,000 recovers; main position above 65,980 recovers. Full exit at 66,720.
- Targets: 64,670 (partial profit + entry), 64,310 / 62,780.
- RR: T1 (64,670) = 2.7 / T2 (64,310) = 3.7. 65,310 has RR below 1.0, so not used as T1.
- MFE protection: +200 to break-even or small profit exit, +300 to ensure at least +100 or trail. Since all higher timeframes are in uptrend, avoid downward turn below 65,640 and be mindful of false breaks and sharp reversals.
Current Action
- Most important line 1: 66,190–65,980. Support zone for buying the dip (15m 80EMA ≈ 1H 20EMA to 1H turning price). If rebound, continue buy-the-dip; if 65,640 closes below on 15m, upward wave would break and 64,310 would flip to uptrend (switch from ② to ④).
- Most important line 2: 66,720–67,670. 15m recent retracement high to 4H upper MA band / 4H turning price. A close above 66,720 triggers follow-through toward 67,340 → 67,930, and if fading, revert to counter-trend profit-taking. A close above 67,670 on 4H close restarts the 4H upwave.
Entry price, trigger, and stop are set based on the chart shape at the close time (turning price, pullback lows, and retracement highs for each timeframe). If the structure changes with time, unless there is a higher-timeframe structural change, entry price will be adjusted using the turning price of lower-timeframe waves (e.g., a short-term timeframe first enters a down wave and then turns up) to align with actual conditions, selecting the approach that best matches reality.
※ This report is for information purposes and is not investment advice; please make investment decisions at your own risk.