

【Method】A simple explanation of the Dow theory trading method for Tomira? (知楼) Wait: The original Japanese reads: 【手法】知楼のダウ理論トレードの手法をカンタンに解説 Translation: 【Method】A quick explanation of Zhirou's Dow Theory trading method Notes: - 知楼 (知楼) could be a name o
Shirou here!
Currently, I am supporting the indicators for Heaven and Earth,
- to deeply understand crowd psychology and the market
- to alleviate as much as possible the anxiety of the students during trading
and I trade using Dow Theory for that purpose.
In this article, I will clearly share my personal method.
Dow Theory
This time I will explain the method, so I will omit detailed explanations, but the basic structure is as follows.
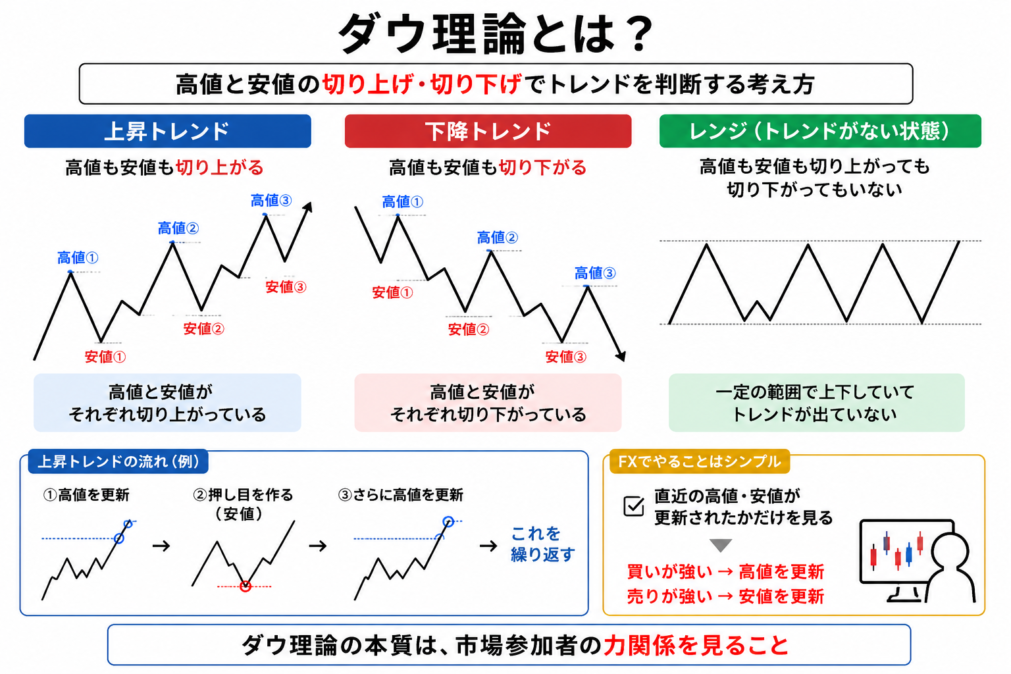
Dow Theory trading method
Basically,any time frame is OK.
Personally, on the 1-hour chart you can trade in line with the daily chart.
It is better to follow the daily chart, which tends to form a larger trend.
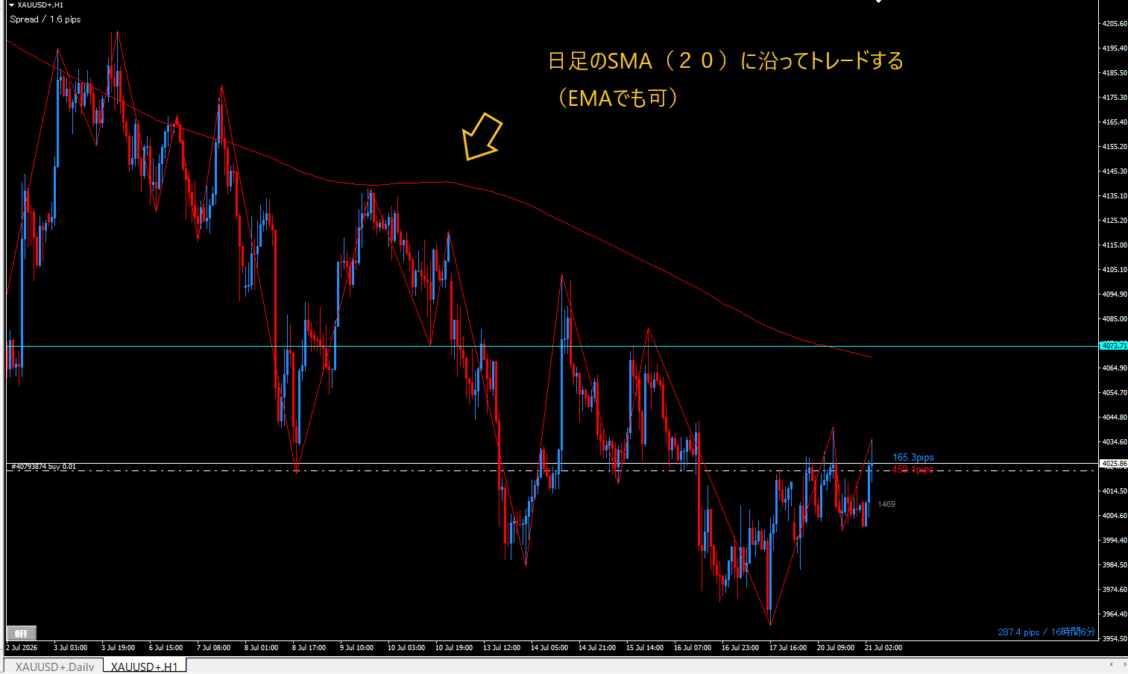
The usage is very simple.
Trade along the daily SMA (EMA is also fine) 20.
In actual settings, for the 1-hour chart,set SMA to 480 (equivalent to the daily SMA 20)
- If the candlestick is below the SMA, it is a downtrend
- If the candlestick is above the SMA, it is an uptrend
that is how I view it.
The direction is better when it is slanted, but it is hard to judge in actual entry price action, so for now, as long as it is not the opposite, it is OK.
Places where it actually hits
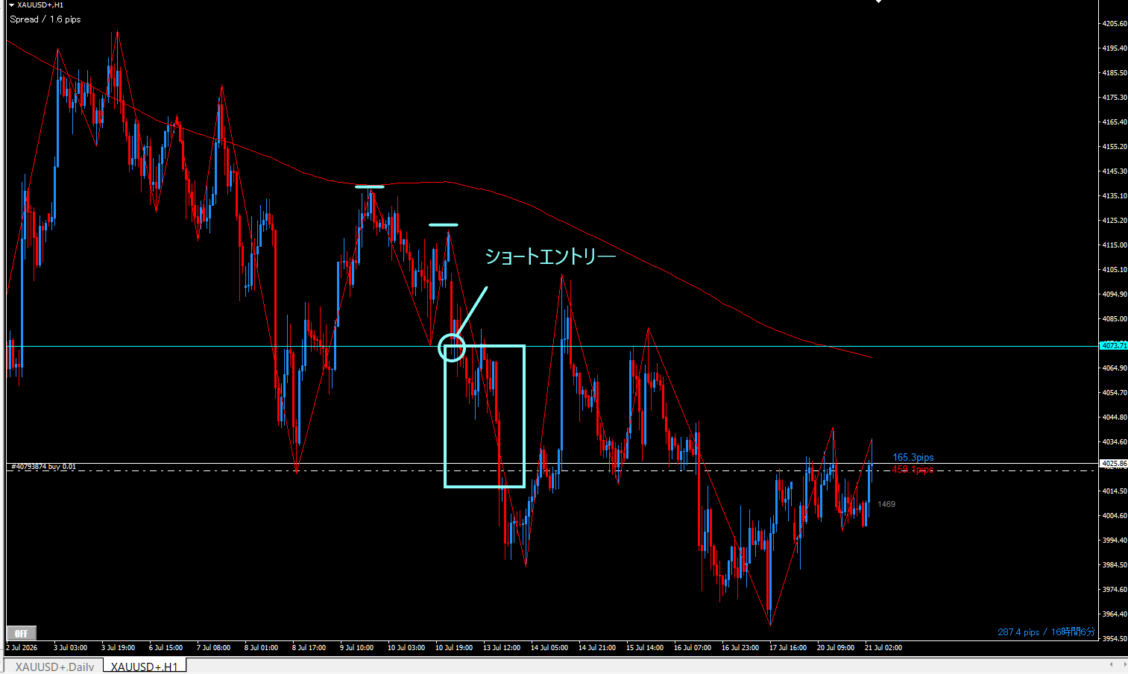
Gold, 1-hour chart.
- Below the SMA, so a downtrend
- Forms a double top
- Right peak did not get updated
- Then breaks the neck line
- Entry
In Dow Theory, that marks the start of a downtrend. It is also an entry point.
Basically, I trade 1:1 from the most recent high.
If you understand Dow Theoryyou could cut losses at the point of negating a downtrend, but I will skip that here.
In my case, I make two entries at 1:1 and otherwise let profits run as much as possible before taking profit.

Meaning of Zigzag

In Dow Theory trading, identifying highs and lows is extremely important.
Many people use swing highs and lows, but I personally use Zigzag.
It has high visibility and is easy to understand.
The default settings apply. However,one caution exists.
1-hour Gold
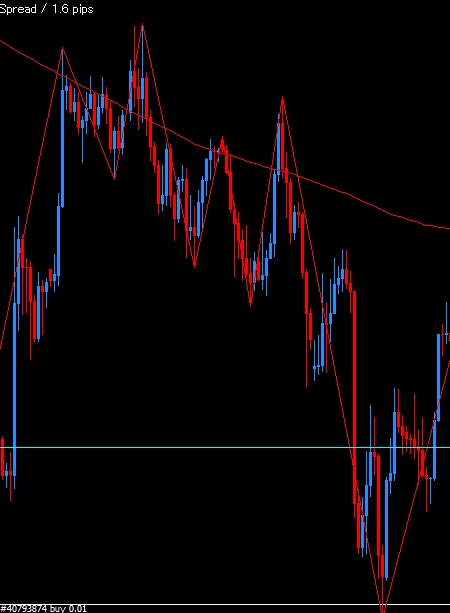
With default settings, it tends to show approximate highs and lows.
Then, would it be hard to establish Dow Theory?
You might think so, but regarding this,I consider the highs and lows on the 4-hour chartinstead.
In other words,
I am aiming for the necklines of double tops and double bottoms on the 4-hour chart in line with the daily chart
.
The Zigzag on the 1-hour chart tends to correspond to the highs and lows on the 4-hour chart.
Therefore, you can perform a trend-following trade on the higher time frames of the daily and 4-hour charts.
Of course, I also perform environment recognition on the daily and 4-hour charts, but I will skip that here for now.
Summary

Even those who use Heaven and Earth indicators, I would like you to learn Dow Theory if possible.
Many people aim for line touches to the points, which is also the orthodox method of the Heaven and Earth series.
These line touches can sometimes already negate the trend on the trading timeframe.
If you notice, you can cancel orders before entry and cut losses early.
With these advantages being substantial, and above all as a skill to deeply understand crowd psychology and the market, I personally feel it is essential.