
[Method] 1-hour TF2 color reversal oscillator shorting technique explained!
Shirou here!
Recently I hadn't been able to公开 much of my methods, but in this article I will clearly explain a short method that can be completed using only the 1-hour chart for
Oscillator TF2 color-change after the move
.
【Method】1-hour chart - short method after TF2 oscillator color-change
First, about this method
- 1-hour timeframe
- All currency pairs
- Oscillator TF2 (LV1) color-change after +80
- Entry at line touch
- Only the first retracement sell/short
.
This is the first retracement sell after the market becomes overbought.
Image
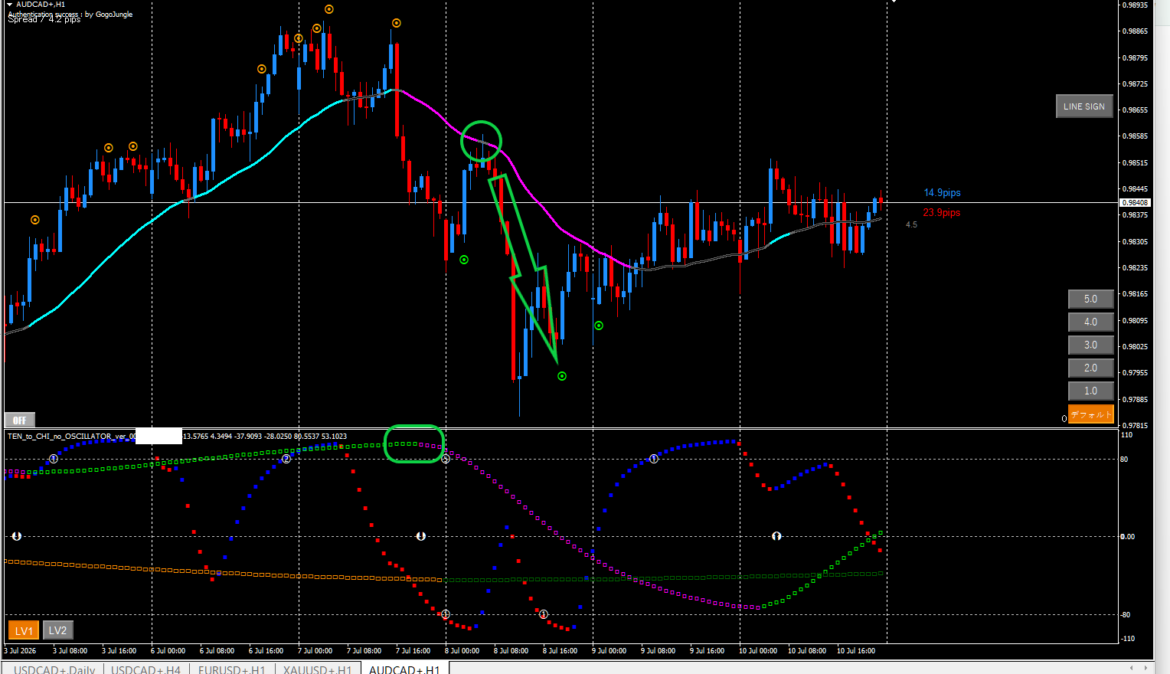
Since it can be completed with only the oscillator, it is very simple and suitable for beginners.
Why is the first retracement sell after overbought good?
In market movements, Elliott Wave is famous, right?
First, let's look at the movement of the Elliott Wave.
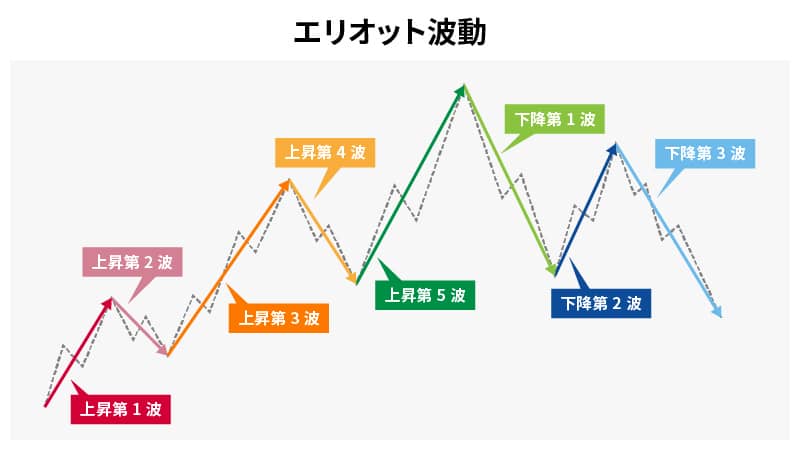
As a concept, the Elliott Wave is thought of as:
- A gradual rise (Impulse waves 1–5)
- Entering the period where buyers settle their positions
- Buy positions are settled with sell orders, so it declines.
- A downward trend reversal (Oscillator TF2 color-change)
- Sell traders enter
- Selling accelerates
Not all markets follow this, but there is a tendency for this psychological state.
This psychology is what this method exploits.
We aim for thethird down wave
In the image below, this would be wave C.
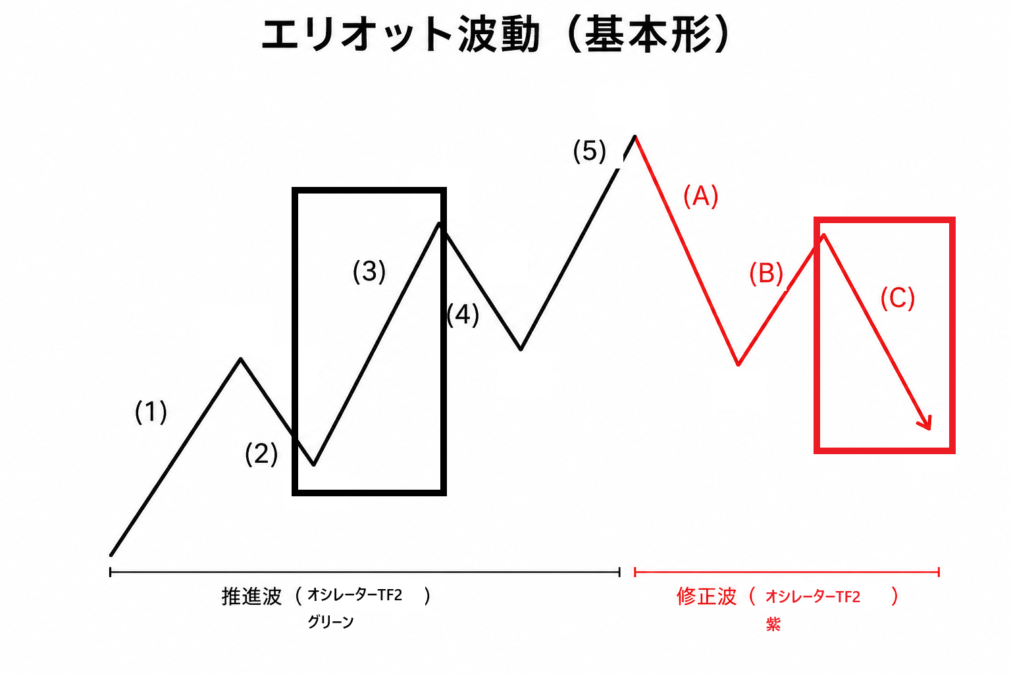
This first retracement sell,the start of C pairs very well with line touch.

Conditions and entries
Absolute condition is the color-change of Oscillator TF2 (LV1) from +80.
Reason:
Because it tends to be the starting point of the Elliott Wave's down move..
Then, enter short at the line touch of heaven and earth.
About the entry
AUDNZD 1-hour chart.
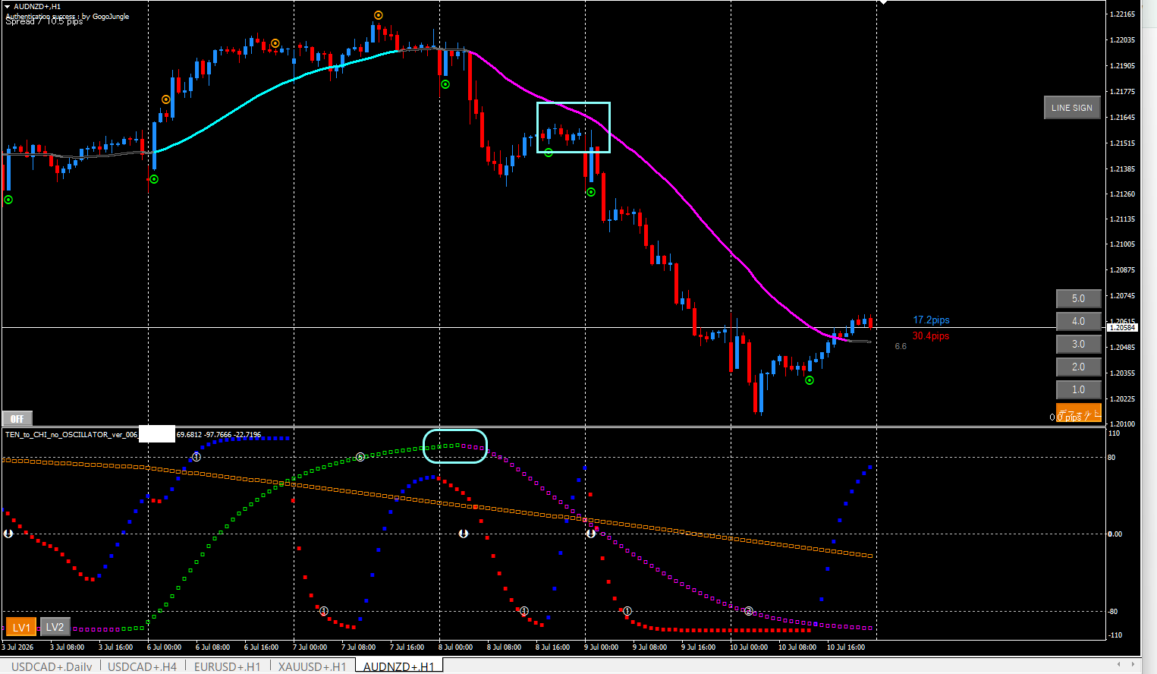
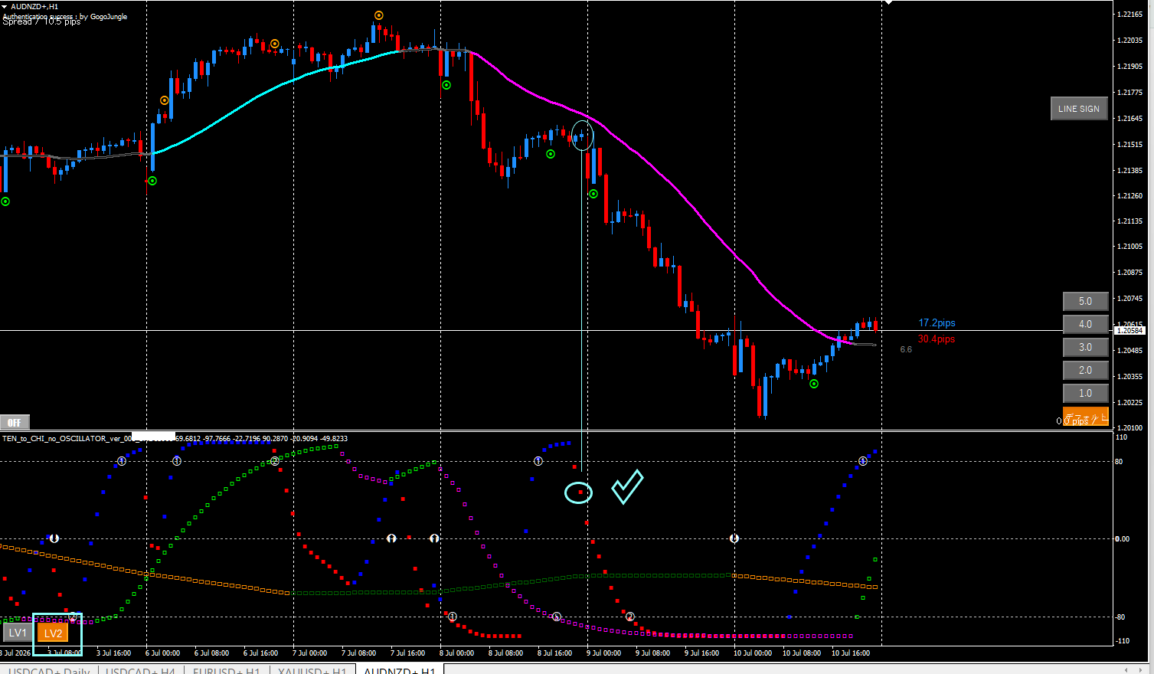
When the decline is strong, as shown in the image, the first retracement sell maynot touch the line and descend.
In that case, you may enter with the oscillator'sCurrent LV2 color-change.
About the exit method
For the exit method,
- Oscillator LV2 color-change
- Point 2 or Point 1
- Band touch
are options, but the most stable is the oscillator current LV2 color-change.
About the stop-loss method
Nearest highis OK.
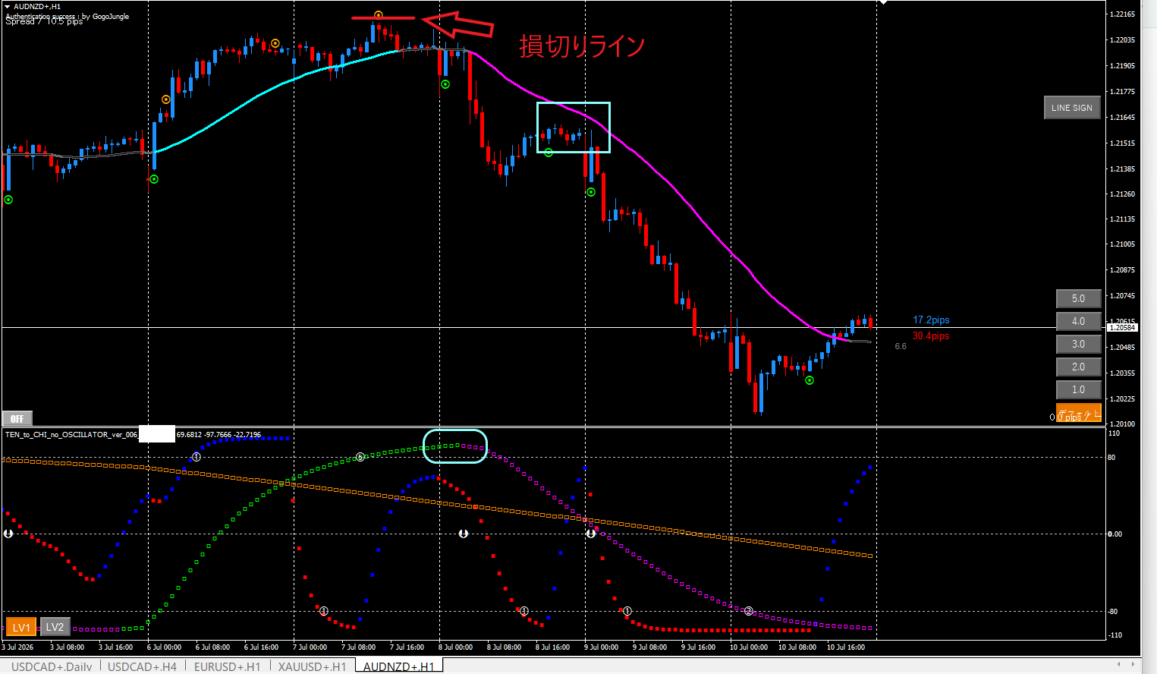
As in the image, personallya little above the nearest high is recommended.
If you find it hard to identify the nearest high, ABUATR around 2–3 may also be fine.
That was the first retracement short method using the Elliott Wave pattern.
Of course, adding environment awareness helps stabilize win rate and profit growth.
However, I believe it is a method that still works reasonably well even if daily and 4-hour charts are reversed.