
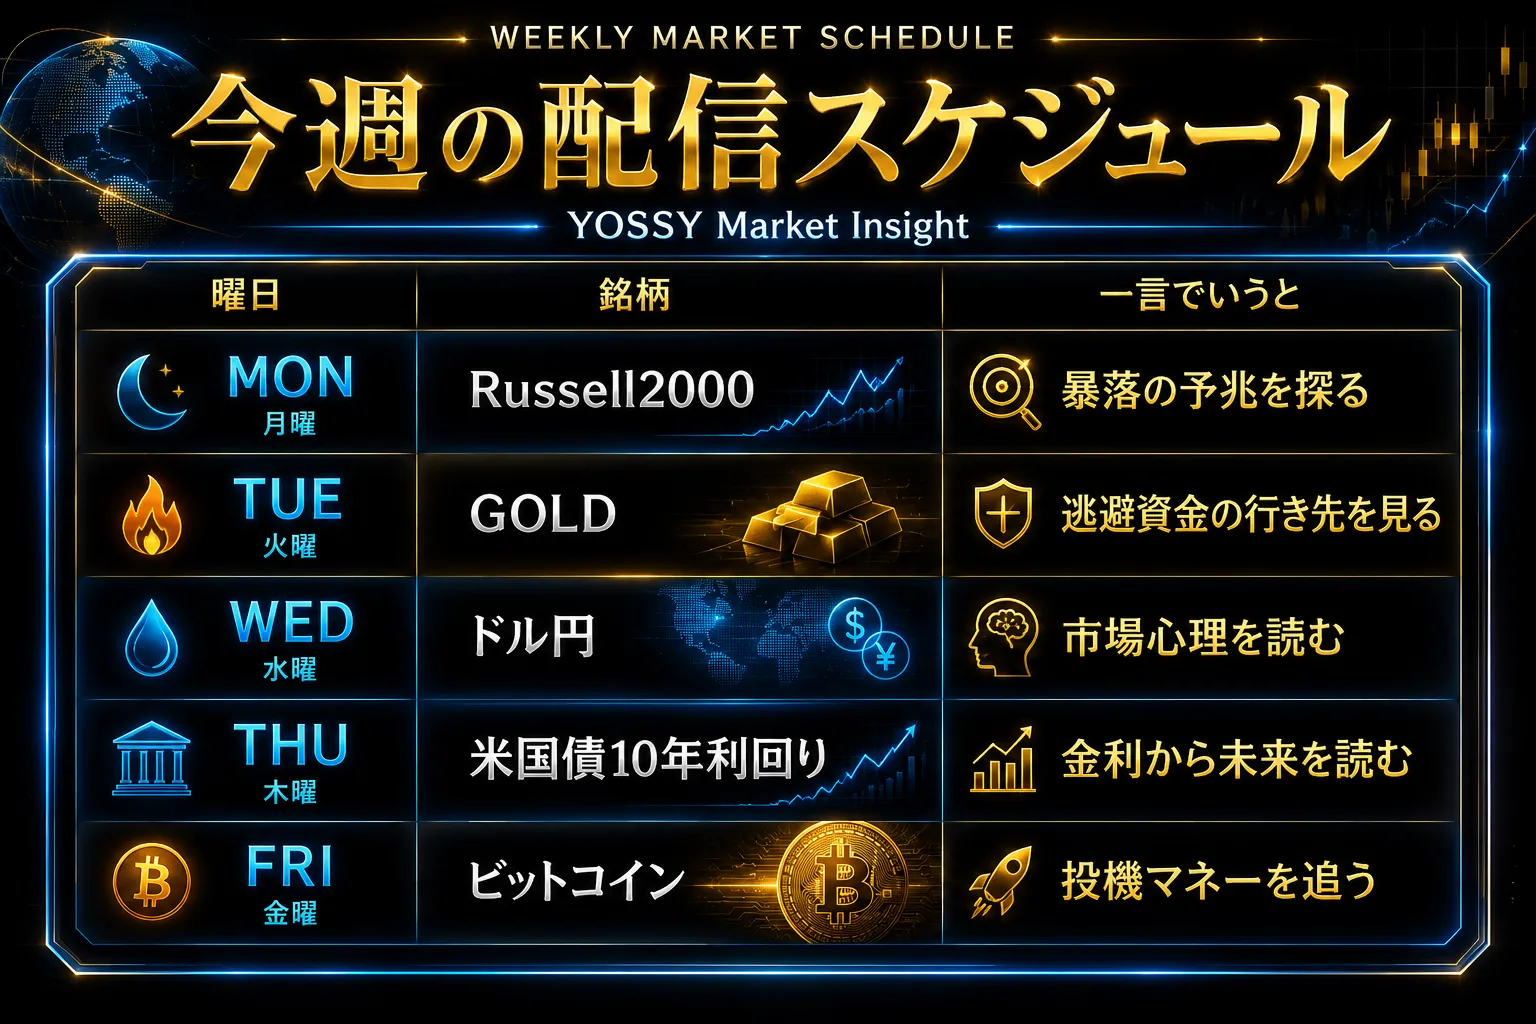
July 23 (Thu): 【BB & HM】 Nikkei 225 vs. U.S. 10-year Treasury yield
[Notice]
I will be returning to my parents' home until the end of July.
Therefore, there may be delays in newsletter posting times and replies to inquiries; please understand.
This time
is called
"Economic Temperature"
and we will compare it with
[Overall Scenario Probability]
This week's overall market is…
"Rise: 40% / Fall: 60%"
Because the upward wave of the USD/JPY and the 10-year US Treasury yield continues, and due to the [negative correlation] pressure on the four major US indices and the Nikkei 225, downward pressure is dominant
For reference level only.
[This Week's Market Watch Points]
This week's market has USD/JPY and the 10-year US Treasury yield in an upward wave, and from the perspective of [negative correlation], downward pressure on the four major US indices and the Nikkei 225 continues.
On the other hand, signals suggesting a renewed rise in the US 10-year yield have appeared, and a new scenario of returning from [negative correlation] to the original [positive correlation] has emerged. The Nikkei 225 is at an important crossroads, and the future direction is becoming clearer. Because multiple correlation scenarios intersect in a difficult situation, it is necessary to carefully discern this week's price movements. See the paid section for details.
➥The rest is explained in detail in the members-only report.
If you are not registered yet, please go here ↓
[Integrated Version]
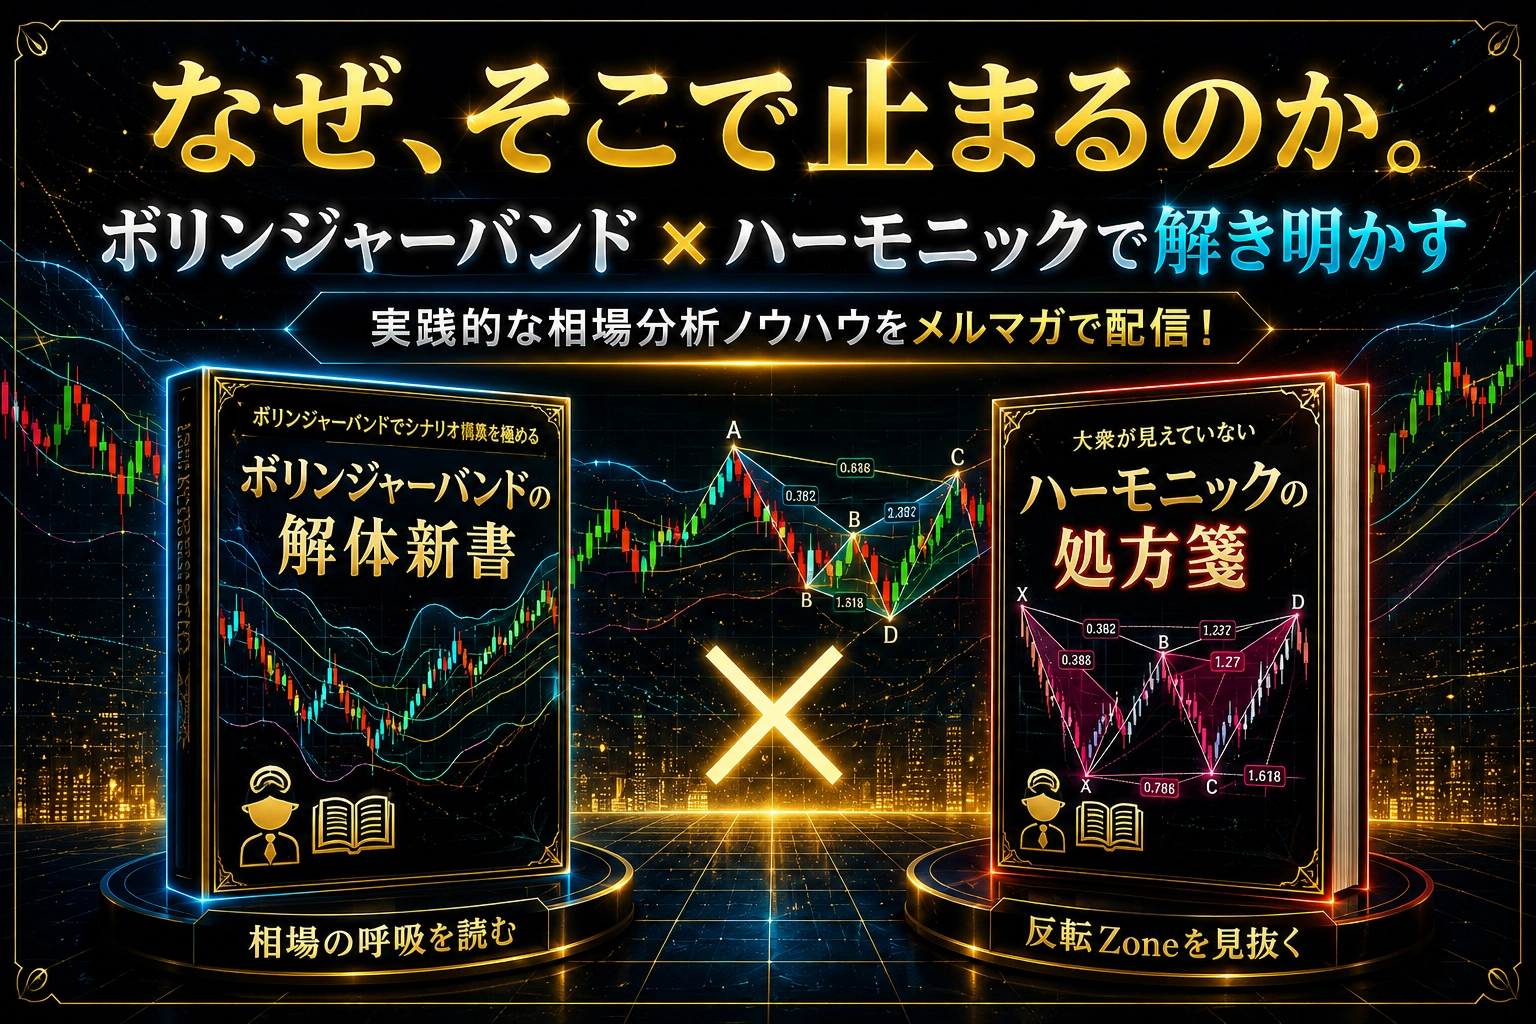
“Why does the market stop there? Bollinger Bands ✕ Harmonics: A fusion of statistics and geometry to capture market turning points with high precision!”
https://www.gogojungle.co.jp/finance/navi/series/1613?via=articles_detail_aside
(*Below this, it is limited to members。)
-----------------------------------------------
[Environmental Recognition]