
Today’s USD/JPY trading strategy
2026 Latest Version!!
You can watch the interview VTR with Gojozan President Hayakawa and me here
There is also a free gift available.
Good morning everyone.
Yesterday’s USD/JPY moved in a pattern that continued the "ascending triangle" in the chart formation and broke up after 3 am.It moved as described in yesterday’s article, but today I’m writing with the image of whether it will continue upward or form a range by pulling back toward the 16,300 area where the starting point was yesterday.
As described in yesterday’s articleIt has become that, but I’m considering whether there will be further upward movement or not, imagining whether it will push back toward the 16,300 area and form a range.
This early morning rise wasn’t caused by Trump barking or some indicator, so I think it was a natural move.
The Nikkei 225 rose almost simultaneously with the New York Stock Market opening and has since been trading in a range this morning.
Depending on how you view it, it can be seen as following the stock market, but even if you understand that, it does not directly translate to FX profits, so I think you still need FX-specific assessment and strategy.
Dollar-Yen 1-hour & 1-minute & Nikkei daily chart
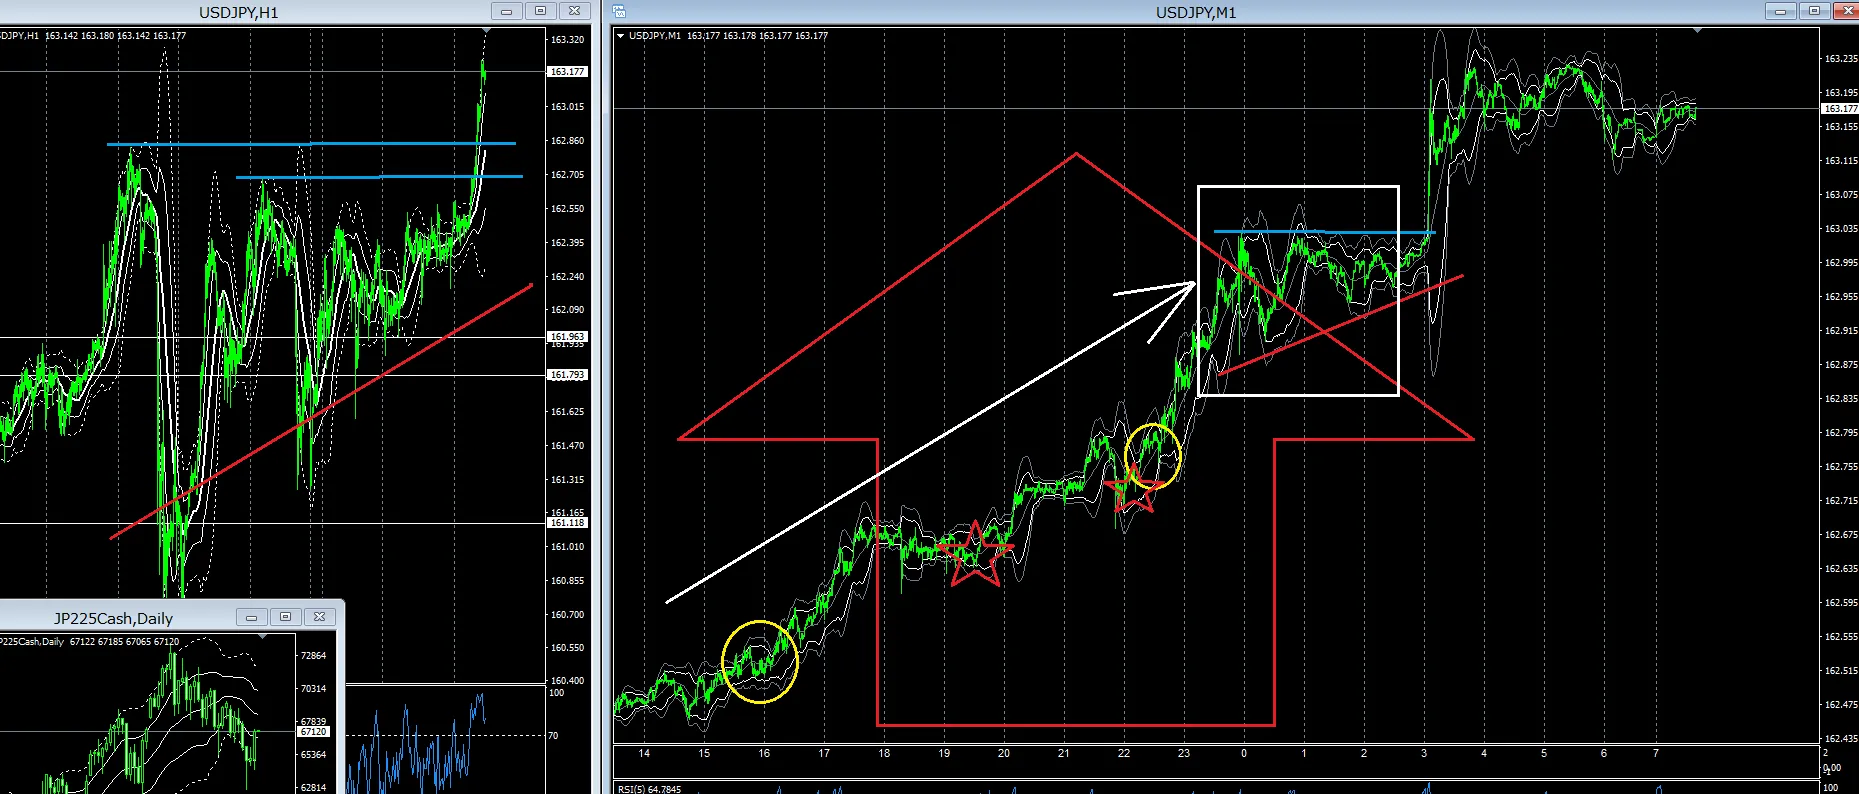
The 1-hour chart shows a breakout to the upside.
Even if this were the opposite of the long-term downtrend, and the 1-hour chart formed this type of chart pattern, there can still be a temporary breakout, so you need to prepare the next move assuming an upward breakout.
There are only two possibilities: up or down, so even if the breakout proves to be wrong, you should accept that and plan a forward scenario accordingly.
A technique that can be useful in such times is
A non-standard FX double position
that is, hedging positions to convert a losing position into profit.
This is a hedging method that turns wrong positions into profits.
In such breakout moments, a contrarian position after waiting for the breakout can be the first move.
The right chart is a 1-minute chart.
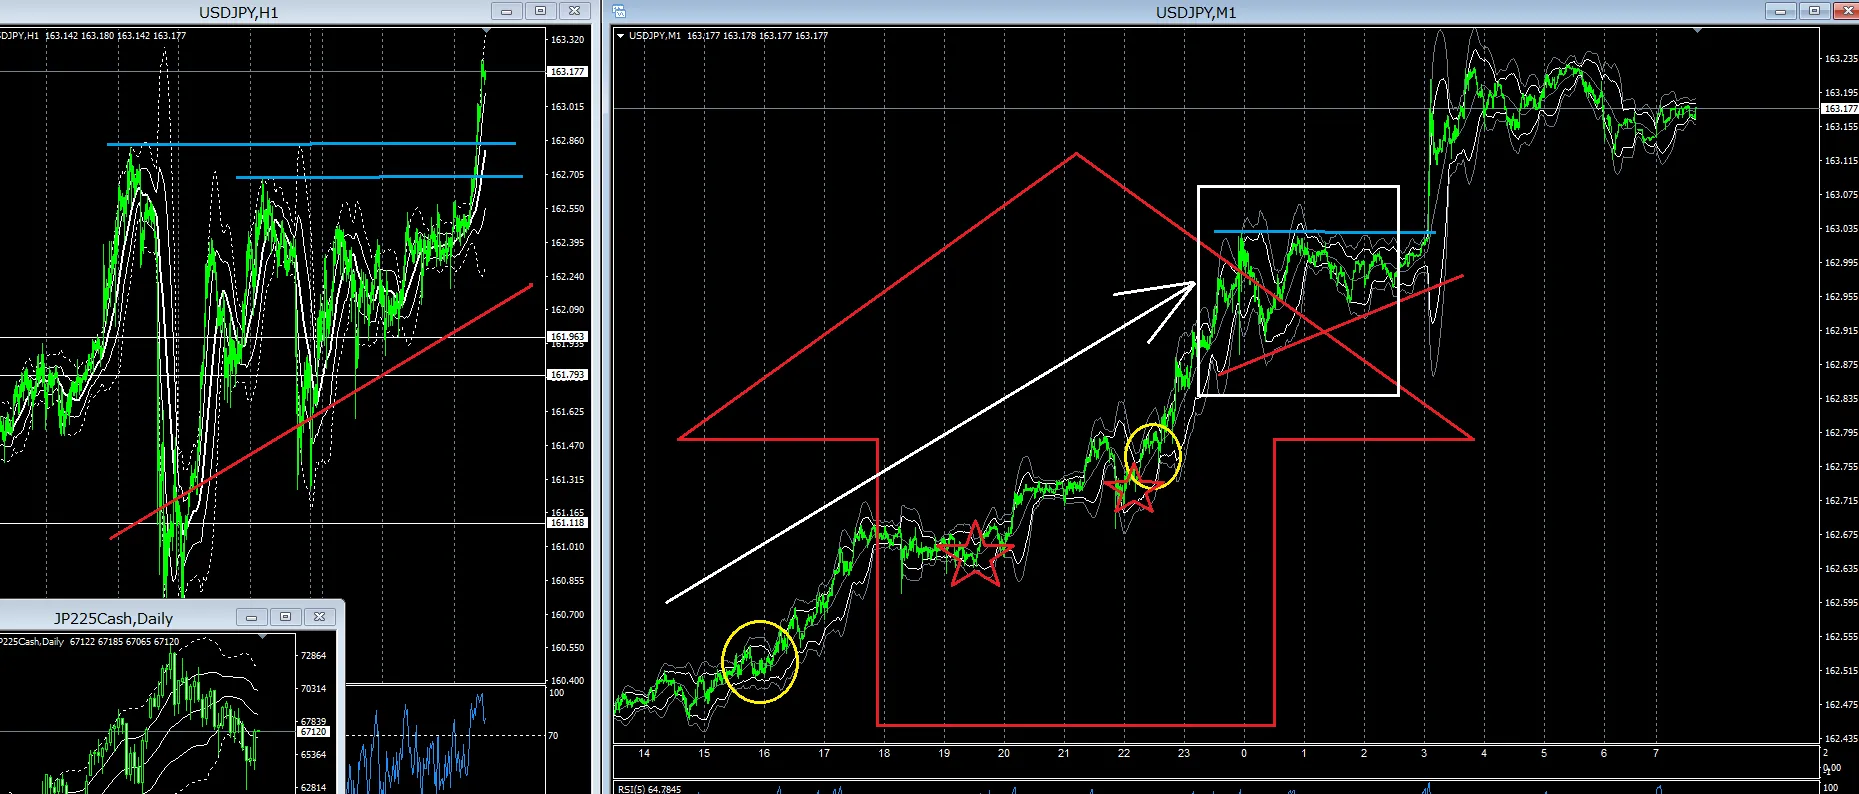
The yellow circles indicate the London and New York stock market open times.
Although an upward trend ultimately formed in the evening, riding the trend to take positions is surprisingly difficult.
There are few traders who can trade by following volume, which isn’t a feature of FX, but
would allow you to determine volume and take positions even on charts with no technicals.
For example, a red star scene shows the chart signaling a sell-to-buy transition.
From there, an L-position (long) is the only option, so where to buy becomes important.
To pinpoint where to buy, you monitor "volume" and the "Billionaire Trader line," and if the pullback is deep, you take another L-position on the next Billionaire line, enabling L-position-focused trading strategy.
Experienced traders who have traded for years naturally know how to judge pullbacks and retracements.
Breakouts and contrarian trading are similar.
That’s how you build your own trading style.
Whether today’s trading result is a win or a loss, whether profits remain after closing, this is the result that matters.
I don’t trade with the goal of winning everything.
Trying to win everything leads you to chase after course-after-course of products.
In my personal view, a simple method that can be tested many times is best.
And a chart that can instantly tell you whether to buy or sell is needed.
This can be resolved with the Billionaire Trader Chart.
If you make trading too complicated, you won’t know what was good or bad, so it’s better not to complicate it too much.
Many commercial products are designed to be complicated because that benefits the seller.
That also depends on the buyer’s ability to see through it.
I’m not focusing on that; I believe in something anyone can understand, and that anyone will make the same judgment when looking at it—this is important as a foothold for trading, especially for those just starting FX or traders who want to restart from the basics.
With that in mind, I write product listings and this blog.
If you’re interested, please take a look at the products.
Today’s USD/JPY shows
Further upward movement
Ranging
A drop to around 16280–16270
These three are the key points, I think.
Please have a good day as well.
For traders who simply want to succeed in trading or make a living from it, my recommended products, which you can learn on your own, are below: