
Things to check when looking at the chart
2026 Latest Edition!!
You can watch the interview VTR with GoGoJan President Hayakawa and me here
There are also free gifts available.
Good morning, everyone.
Yesterday's USD/JPY moved in a pattern that can be described as an "Ascending Triangle" in chart formation.It is continuing this morning as well.
As I always say, the market repeats in the sequence "trend" → "range" → "trend," around the clock without end. I have written many articles defining trend and range; those who do not know or understand should Google and confirm.
Mastering that will make chart-reading feel intuitive.
The Nikkei average fell about 10,000 points from its peak last week and briefly rebounded, but it’s facing resistance and is trending down this morning.
For billionaire traders, please switch the Nikkei daily chart to Billionaire Trader Chart and view it.
I think you can understand the overall movement.
As I mentioned recently, according to the Nikkei Billionaire Trader daily chart, the first downside target is around 55,000 to 60,000 yen.
Those trading the 225 index might consider short-side reversals and short-term trades chasing breaks at key levels.
Even though the downtrend is clear, initiating very short-term selling on rallies might be somewhat more difficult than selling USD/JPY rallies.
This is a matter of preference, so I can't say definitively; if you do what you enjoy, even if you fail you can accept it. Be flexible and diversify your judgment when acting.
Still, the daily range of the Nikkei staying around 1,000 to 3,000 points is an abnormal situation.
Almost 20 years have passed since the Lehman Brothers collapse, and one could say the current market is an uptrend rising from Lehman’s bottom.
That said, the numbers are large, but the substance is hardly meaningful—it's a market that’s basically a bubble.
Institutional investors around the world buy aggressively while prices rise, and pull back their money once the hype subsides.
Individual investors are swayed by this and only benefit if luck is on their side.
Well, grabbing that luck is part daily consistency and verification, and I think being able to repeat that every day is essential to surviving in the market.
We are currently in an unprecedented bubble, with excess liquidity and money games.
I believe the market movements that feel detached from the real economy will eventually collapse.
That is what I think a “bubble burst” is.
And if the bubble never bursts and it continues to rise, I fear an unparalleled hyperinflation may follow—something no one has experienced before.
On a different note, two families of my hometown classmates separated from their parents who began receiving welfare once living apart as households.
One set’s parents are in their 80s and have dementia
↓
The parents are at home during the day, and one was worried about a fall and broke a bone
↓
Dementia requires care, and even with day services, costs accumulate and their classmates’ income alone cannot cover them (about 200,000 yen per month).
↓
Move the parents to a facility, separate households, and apply for welfare
↓
Cost concerns are temporarily resolved
↓
But the family’s mental burden continues
This is something I have experienced for about a year due to my father, and it is a serious issue for the family.
What is serious is that the surrounding family’s daily life cannot function day or night.
Especially for those who are employed, this situation makes it impossible to work...
In our case, fortunately my father’s pension was substantial enough to cover everything, but looking back, usually pensions alone aren’t enough.
Admin services aren’t free either...
Considering this, money becomes a key factor, and as life expectancy increases, so do the financial risks.
If those risks can be mitigated by earning a little money through the market, I think not taking that option would be unwise.
However, this is a matter of personal preference, so if you want certainty, working a second job is wiser and more secure.
Readers of this blog are obviously in the former camp, so I think you should develop a habit of viewing charts in a broader context, make flexible and multi-angle judgments, and translate that into trading.
USD/JPY hourly & 1-minute charts & Nikkei daily charts MT4
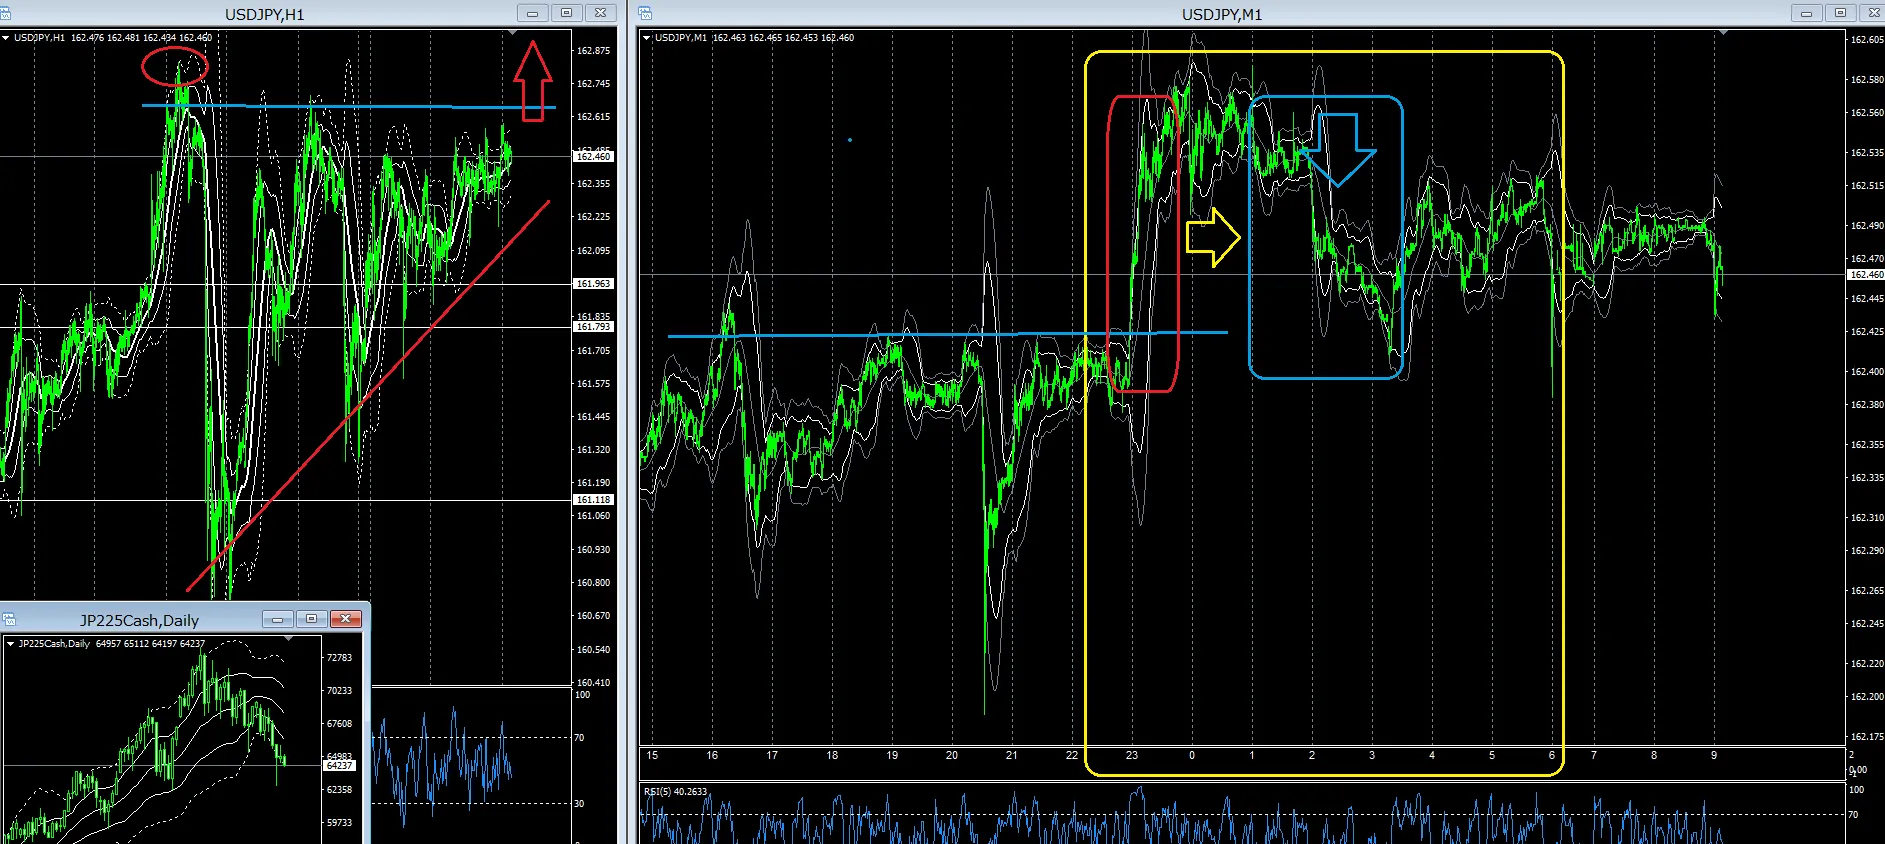
The hourly chart shows the chart formation explained in the opening article.
Generally, an upward breakout from here is common, but since we are in the peak region, we should proceed cautiously.
The 1-minute yellow square zone is from last night's NY session start.
Before NY opens, we need to confirm whether there is a range, i.e., a headwind that has formed, like a blue horizontal line.
Markets repeat trend → range → trend, so the next move is likely to be a trend formation.
Often, the first move begins with a range breakout like this.
In particular, NY session tends to have high volume toward the London fix, creating volatility and visually clear charts.
We should aim for such moments, but more important is whether you have the intent to target them, so start trading now!
When you sit down, cultivate the habit of checking whether such points exist in advance.
If you know that, your own method and the products I sell will increase in value.
For traders who have not yet established a method or have tried various things with little success, please
to purchase and learn what you should do as one option.
Thank you for your continued readership today as well.
If you want to succeed in trading and make a living from trading, here is the product I recommend, a trading technique you can learn on your own: