

NK225 Futures MTF Dow Theory 4-Scenario Analysis Report 2026-07-21
NK225 Futures MTF Dow Theory Analysis Report
Date and Time: July 21, 2026 06:04 JST / Night Session Close
Current Value: 65,080 JPY
Subject: For the intraday session (Tue 7/21)
Conclusion
In conclusion, the autonomous rebound from 62,780 progressed to 65,990 (July 20 high) during the night, then pulled back to 65,080 at the close. The 4H is in a downward-to-upward wave, the 1H is in a downtrend/downward wave, and the 15m shows rising/falling waves, with the rebound temporarily stalling and forming a pullback. Throughout Tuesday, the key is whether the pullback will lead to a breakout above 65,990 or whether a break below 64,670 will result in a completed rebound and resumption of the downtrend.
If there is a rebound from 64,930–64,670 pullback and a close above 65,990 on the 15m chart, it becomes a buy; if the price closes below 64,670 on the 15m, the rebound completes and the downward move resumes. The zones above 65,880–65,990 and 66,360–66,660 are selling zones, with a potential for renewed selling if the price stalls. If 64,670 is breached on a 15m close, the rebound completes and the downtrend resumes; a recovery back to 66,520 (4H turning point) could propose a 4H bullish turn. The upside is considered heavy within the selling zone, and protective stops should be placed early for all scenarios.
4H Analysis
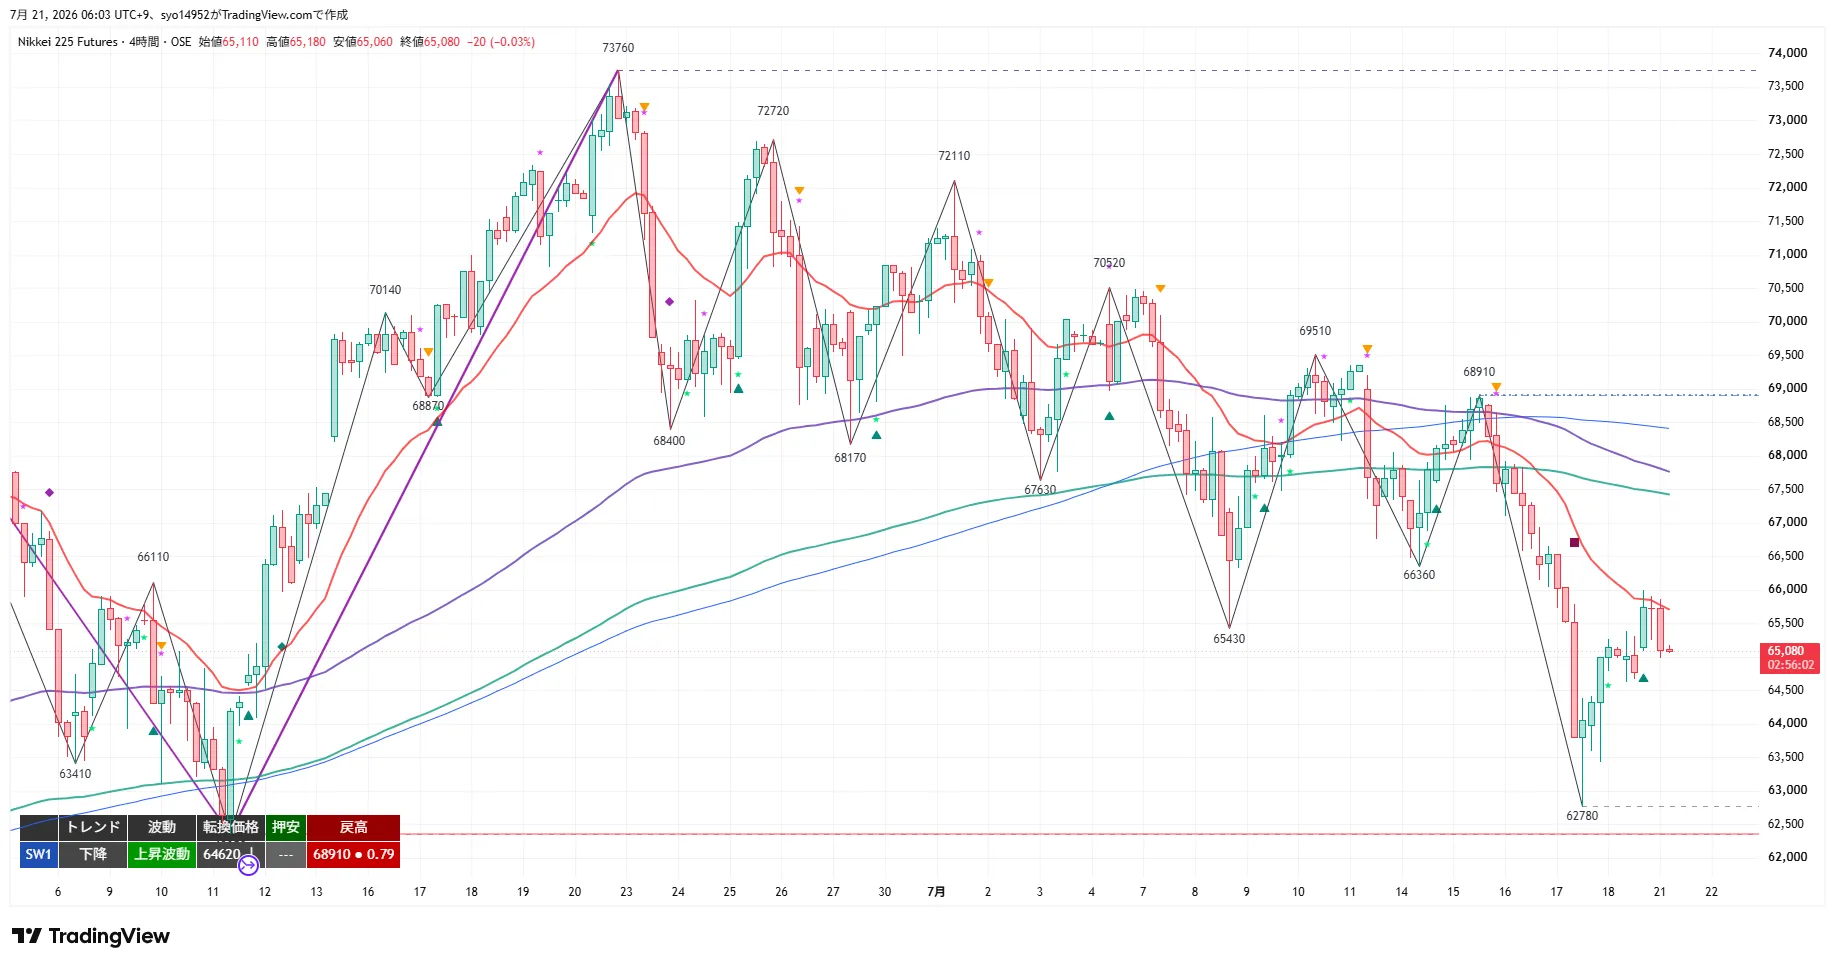
The 4H timeframe continues the downtrend while the wave is turning into an upward wave. After an autonomous rebound from 62,780 to 65,080, the turning price is 64,620. The 20EMA is downward-sloping, and the price remains below the 20EMA (around 65,700), the 120EMA (roughly 67,700 on the daily) and the 200EMA (around 67,500). Although there is a rebound, the downtrend itself has not yet been broken.
Upward steps to watch are around 65,990 (recent high), 66,360, 66,520 (4H turning), 66,660, 67,930, 68,910. Downward steps are 64,620 (4H turning), 63,430, 62,780 (recent low), 62,350 (structural low). While recovery above 66,520 on a close reduces selling pressure, as long as 64,620 is not breached, there remains room for a rebound.
1H Analysis
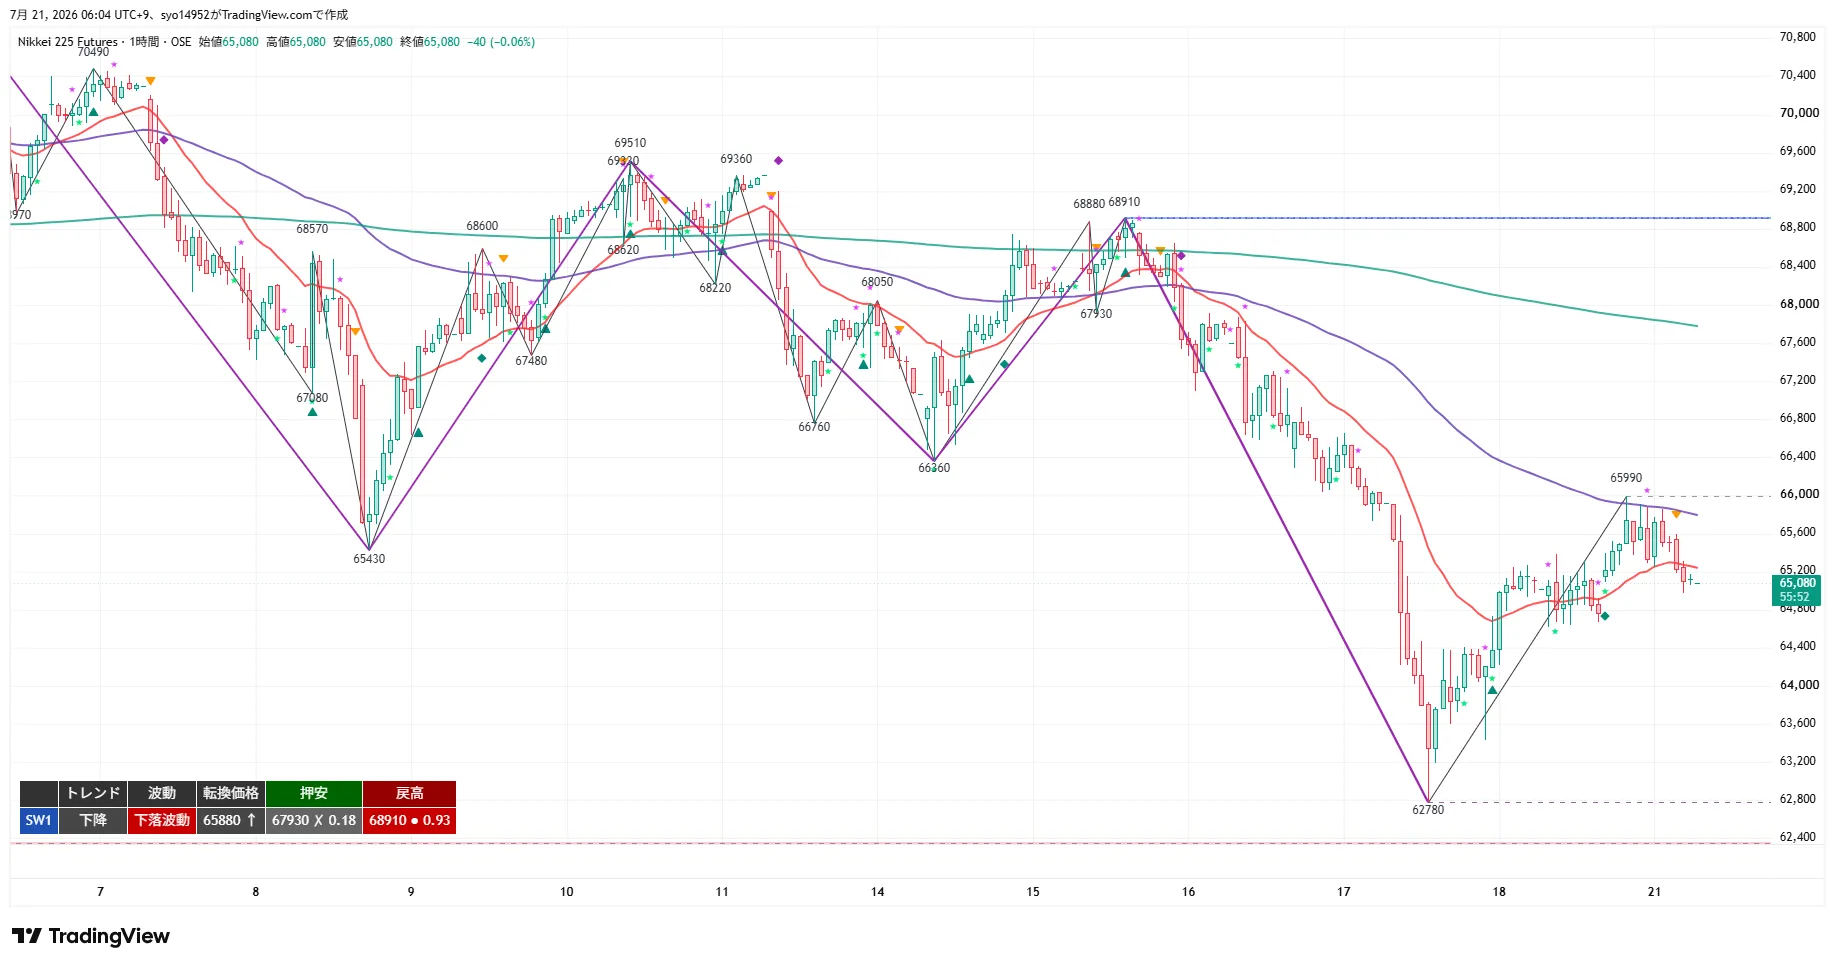
The 1H is in a downtrend/downward wave. After a rebound from 62,780 to 65,990, it pulled back and closed at 65,080, with turning price at 65,880. The 20EMA is flat to downward, price hovering near that level, with the 80EMA (1H equivalent of 20EMA) and 480EMA (daily equivalent of 20EMA) remaining above.
If 65,880 is recovered on a 1H close, the upward wave resumes and retracements may extend. If 64,620 is breached on a 1H close, the rebound completes and the downward move resumes. The zones to watch above are 65,880–65,990 and 66,360–66,660 as retracement-selling zones.
15m Analysis
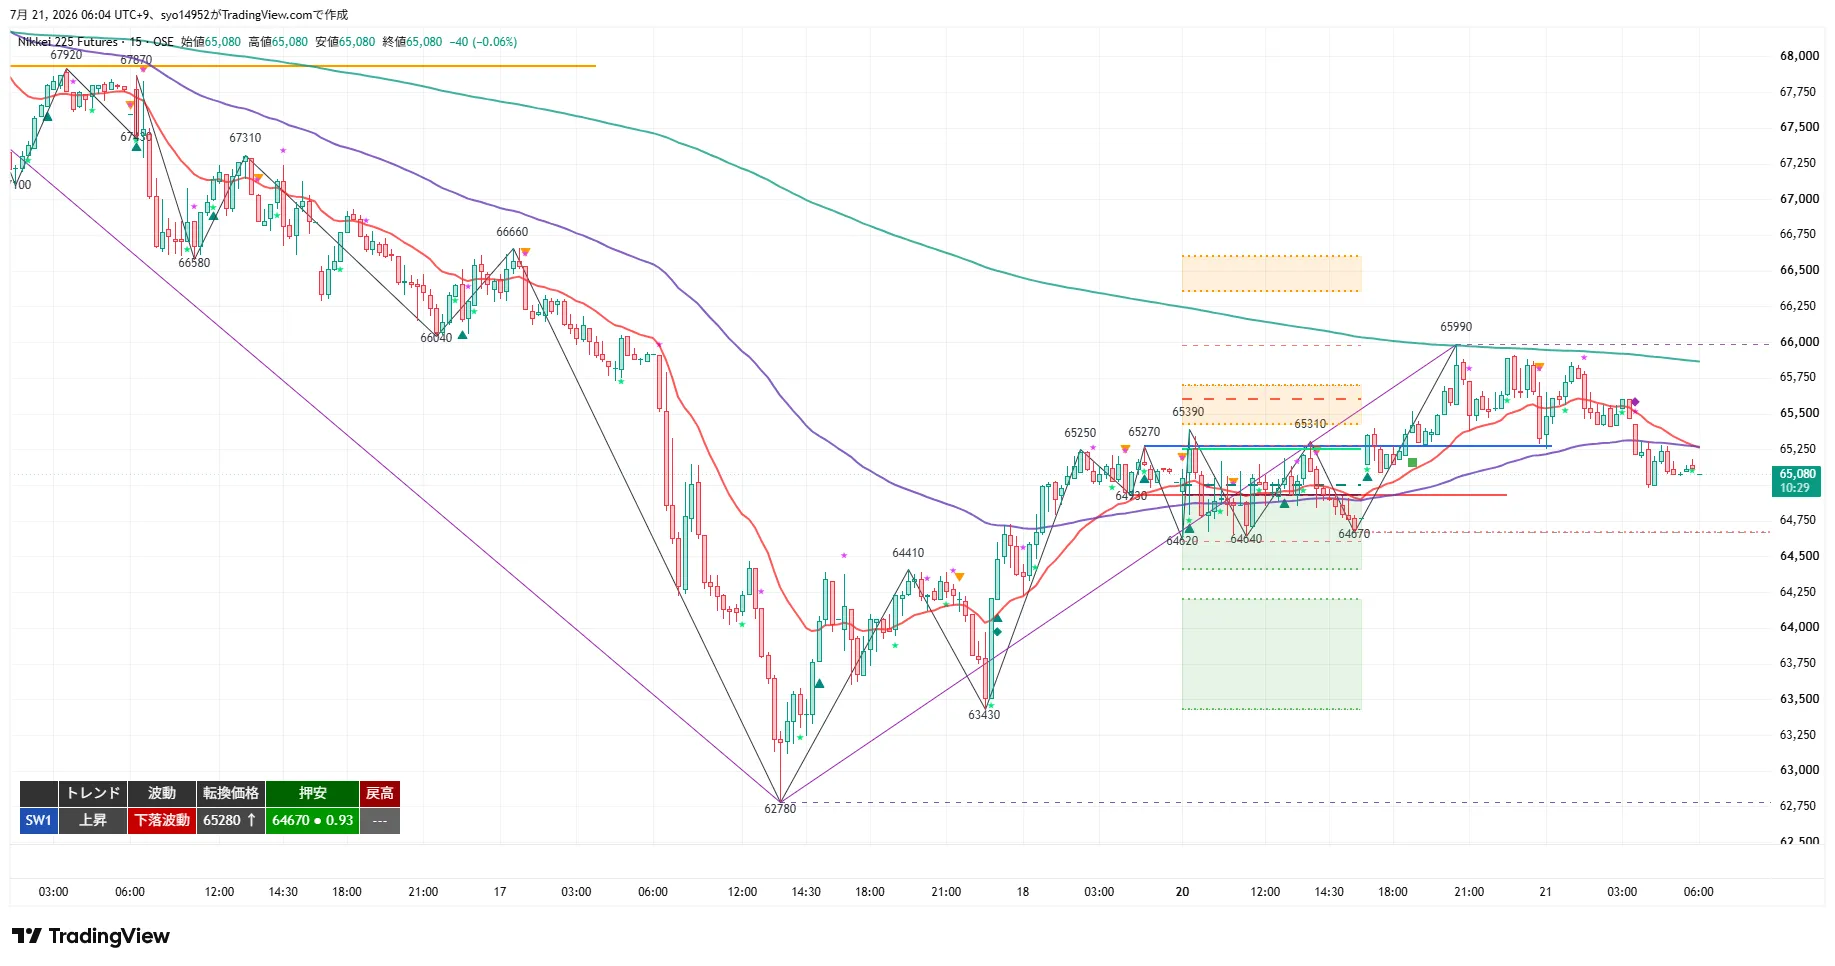
The 15m maintains an uptrend but has recently moved down from 65,990. The turning price is 65,280, with a pullback low of 64,670. The up-move from 62,780 remains intact, closing at 65,080. The 20EMA has turned negative, while the 80EMA (1H equivalent of 20EMA) and 320EMA (4H equivalent of 20EMA) are above.
In the short term, 64,670 is the pullback’s lower bound, and 65,990 is the turning point of the recent high. A close above 65,990 would set a higher high for the uptrend and trigger a trailing move; pullbacks that hold above 64,930–64,670 on pullbacks would present buy opportunities, while a close below 64,670 would indicate the end of the pullback and a resumption of the uptrend reversal.
MTF State
- 4H: Downward / Upward waves. Rebound from 62,780 to 65,080. Turning at 64,620, pullback high to 68,910. 20EMA downward; price below it.
- 1H: Downward / Downward waves. Rebounded to 65,990 and pulled back. Turning at 65,880; pullback low at 67,930 (X) and high at 68,910. 20EMA flat to downward.
- 15m: Upward / Downward waves. Pullback from 65,990. Turning at 65,280; pullback low 64,670; high not specified. 20EMA turning negative.
- Consistency: 4H and 1H show downtrends, 15m shows uptrend; currently all indicate a downward wave (correction). Rebound from 62,780 stalls at 65,990 forming a pullback. The primary strategy is to favor higher-timeframe reversals, while the 15m uptrend remains intact and can support pullback buying or follow-through longs in the near term. Until 66,520 recovers, the larger trend is downward; a breach of 64,670 signals a rebound end.
Key Prices
- 68,910 JPY: 4H/1H retrace high. Upper resistance.
- 67,930 JPY: 1H old pullback low (X = breached) = resistance-turned-support.
- 66,660 JPY: Upper limit of Retracement Zone 2.
- 66,520 JPY: 4H turning price. Recovery could imply 4H upward turning.
- 66,360 JPY: July 14 low / old range pivot. Lower bound of Retracement Zone 2; first-order consolidation.
- 65,990 JPY: Most recent retracement high (7/20). Trigger 1 and Trigger 2.
- 65,880 JPY: 1H turning price. Retracement Zone 1 / Second consolidation line.
- 65,280 JPY: 15m turning price.
- 65,080 JPY: Current price / Night close price.
- 64,930 JPY: Upper bound of Pullback Buy Zone 1.
- 64,670 JPY: 15m pullback low. Lower bound of pullback buy zone / a breach completes the rebound and resumes the downtrend.
- 64,620 JPY: 4H turning price. Upper bound of deep-pullback zone.
- 64,410 JPY: Key level on rebound path. Lower bound of deep-pullback candidate.
- 63,430 JPY: Starting point for the rebound.
- 62,780 JPY: Recent low (Night low on 7/17). Breach updates the low.
- 62,350 JPY: 4H structural low. Most important downside.
Trading Ideas
① Breakout Follow-through (Long)
- Trigger: Break above 65,990 (recent retracement high / 7/20 high) with a 15m close (higher high in the uptrend).
- Premature entry: After the breakout, pullback toward the breakout level or toward the inclined vicinity of the 20MA on a short timeframe (1m, 5m) as a back entry, with a target around 65,700 and breakout price as reference.
- Core condition: Close above 66,360 on the 1H chart.
- Stop-loss / invalidation: Premature leg breaches 65,280; core position breaches 64,930.
- Targets: 66,660 (partial profit + base), 67,930 / 68,910.
- RR: T1 (66,660) = 2.3; T2 (67,930) = 5.3. Since T1 is lower, emphasize back-entry and core position.
- MFE protection: exit at +200 to base or small profit, secure at least +100 with +300 or trail. Since there is a downtrend on 4H, protect early.
② Buy on Pullback (Long)
- Standard: Pull back to 64,930–64,670 (15m pullback low zone) and confirm rebound shape with a 15m close. Deep pullbacks at 64,620–64,410.
- Core condition: Recover above 65,880 (1H turning) with a 1H close.
- Stop-loss / invalidation: Premature leg breaches 64,380; core breaches 64,180. Fully exit if 63,380 breaches. If 64,670 clearly closes below, treat as a rebound completion and switch to plan ④.
- Targets: 65,990 (partial profit + base), 66,360 / 66,660.
- RR: T1 (65,990) = 3.4; T2 (66,360) = 4.4.
- MFE protection: exit at +200 to base or small profit, secure at least +100 with +300 or trail. Since retracements aim for selling zones during a 4H downturn, do not chase deeply and protect early.
③ Sell on Retracement (Short)
- Standard: Restrain upside in 65,880–65,990 (1H turning to recent high) and confirm stall with a 15m close. Zone 2 is 66,360–66,660 (7/14 pivot + 4H turning 66,520).
- Core condition: Break below 64,620 on a 1H close (rebound completes and downward resumes).
- Stop-loss / invalidation: Premature leg recovers 66,110; core recovers 65,990. Strong invalidation at 66,520 (4H turning recovery = 4H Upturn candidate).
- Targets: 64,410 (partial profit + base), 63,430 / 62,780.
- RR: T1 (64,410) = 7.1; T2 (63,430) = 11.8.
- MFE protection: exit at +200 to base or small profit, secure at least +100 with +300 or trail. Although the overall is down, the near-term 15m is in an uptrend, so avoid overextension in the rising zone and protect early. If the trigger is confirmed and T1 has been reached, refrain from acting further.
④ Breakout Follow-through (Short)
- Trigger: Break below 64,670 (15m pullback low / 4H turning 64,620 region) with a 15m close (upward trend breaks and rebound completes).
- Premature entry: After a breach, pullback toward breakout price vicinity, or toward the inclined 20MA on short timeframes (1m, 5m) as a back entry.
- Core condition: Break below 64,200 on a 1H close (downward resume).
- Stop-loss / invalidation: Premature leg recovers 65,080; core recovers 65,280. Full exit at 65,990.
- Targets: 63,430 (partial profit + base), 62,780 / 62,350.
- RR: T1 (63,430) = 3.0; T2 (62,780) = 4.6.
- MFE protection: exit at +200 to base or small profit, secure at least +100 with +300 or trail. Since this is a sell-off against an autonomous rebound, wait for a clear close breach before core entry; beware of sharp rebounds.
Current Actions
- Most important Line 1: 64,930–64,670. Support band for pullback buys (15m pullback low band). If a rebound occurs, maintain near-term longs; if 64,670 is breached on a 15m close, rebound completes and downtrend resumes (switch from ② to ④).
- Most important Line 2: 65,880–65,990. Recent retracement high / 1H turning point. A break above 65,990 triggers follow-through toward 66,360; if it stalls, revert to the major downtrend with selling on retracements. A recovery above 66,520 on a 1H close makes a 4H upward turning candidate.
Entry prices, triggers, and stops are set based on the chart shape at the close of each session (turning prices, pullback lows, and retracement highs of each timeframe). If the structure changes over time, and there is no change in the higher-timeframe structure, entry prices will be adjusted based on the turning price levels of lower timeframes (e.g., 15m) and the more accurate figure will be adopted compared to the originally set values.
※ This report is for information purposes and is not investment advice. Please make investment decisions at your own risk.