

A must-see for anyone running multiple EAs: a handy tool that lets you see the profit and loss for each EA at a glance
From fx-on sale products, we introduce classics and handy tools!
The name is
'Profit and Loss Graph You Can See at a Glance!'
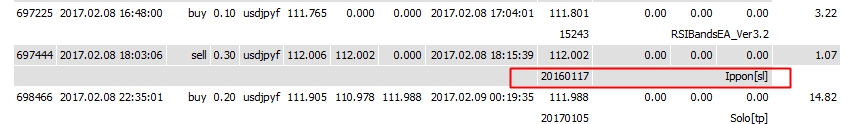
If you are running multiple EAs on one account, you can see which EA did which trades by displaying the comments in MT4's "Save Detailed Report", but that is when you try to tally them in Excel
The magic number and the comments (EA title) lines are different, making aggregation a hassle…!!
Haven't you ever thought so?
↓↓↓ This is the problem
What we're introducing this time that can solve that tedious hassle all at once is the 'Profit and Loss Graph You Can See at a Glance!'!
This product has been on sale for a long time, but I wanted to highlight its usefulness again.
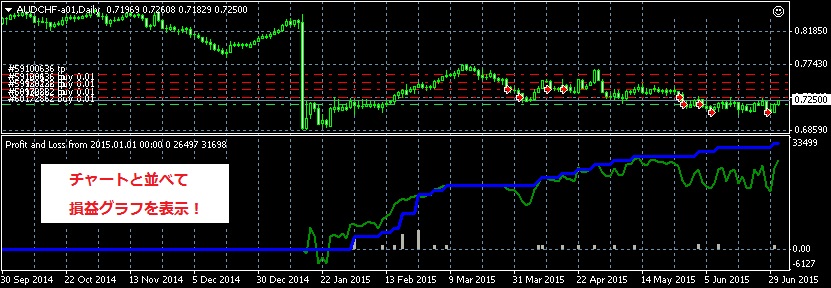
P/L by EA is shown on the MT4 chart!
You can choose to display P/L in amount or in Pips, making objective performance evaluation easier!
For example, when running multiple EAs on the same account, you can see that the balance has suddenly increased or decreased, but if there are many scalping-type EAs, it's hard to tell which EA is affecting the total P/L.
If you set this tool on the chart, each EA's P/L is visible at a glance, so you can quickly identify those that performed very poorly.
And you can compare each EA's forward performance.
(When P/L is displayed in Pips)
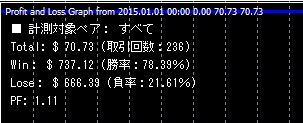
Even though the win rate and number of trades are good, the remaining profit is small…
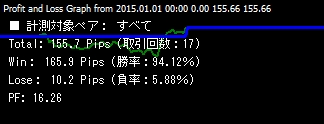
Few trades, but the win rate and PF are extremely good!
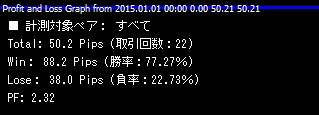
A nice balance between win rate and PF.
It's convenient that you can instantly see each EA's performance without having to analyze the account history one by one!
And somehow you develop affection for each EA…
It can also serve as a guideline for stopping an EA or cutting losses.
(If PF falls below 1, maybe pause for a bit)
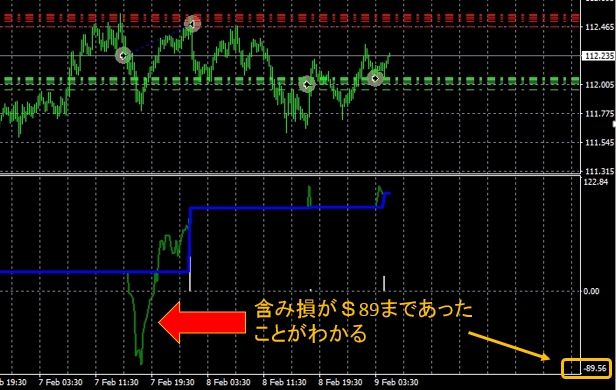
You can see on the chart at what moments the unrealized loss was and how much.
Unrealized profit/loss (amount or pips, as you choose) is displayed on the same time axis as the chart, so
you can immediately verify at what point you entered and how much drawdown occurred.
【You can also measure discretionary trades, so you can evaluate your own trading】
If you set the parameter to discretionary mode (0), you can also see the results of manually executed trades.
People who scalp might think, "Today's win rate isn't good, so maybe I should stop trading today..."
You may be able to evaluate it objectively.
And… there are no limits on the number of charts or accounts you can set up!
Unbelievable price2,980 yen!
This is a product I would definitely want for anyone running multiple EAs!
written by Tera
× ![]()


