
NK225 Futures MTF Dow Theory 4-Scenario Analysis Report 2026-07-20
NK225 Futures MTF Dow Theory Analysis Report
Date and Time: July 20, 2026 06:18 JST / Night Session Close
Current Price: 65,020 yen
Target: For intraday session (July 20, Monday)
Conclusion
In summary, the night session fell from around 65,920 to 65,430 (July 8 low) to 62,780, updating the low, then sharply rebounded autonomously to 65,020 by close. The 4H chart shows continuing downward movement, while the 1H shows ranges and an up move, and the 15m shows rising momentum. This creates an overlapping situation where higher timeframes are down and lower timeframes are up. Throughout Monday, we should watch whether this rebound continues or is pushed back by a selling pullback.
If the 15m close breaks above 65,250, expect a follow-through to the upside, and if it holds on dips around 64,930–64,410, buy the dips (near-term roadmap). Resistance zones: 65,430–65,700 and 66,360–66,660 are selling zones; if price stalls there, expect a broad pullback. If 64,200 (1H turning point) is broken on a 1H close, the up-move would break down and a decline resume; if 66,520 (4H turning) recovers, a 4H upturn would be a candidate. Because the weekend is between, be cautious of gap openings on Monday’s open and manage protection early.
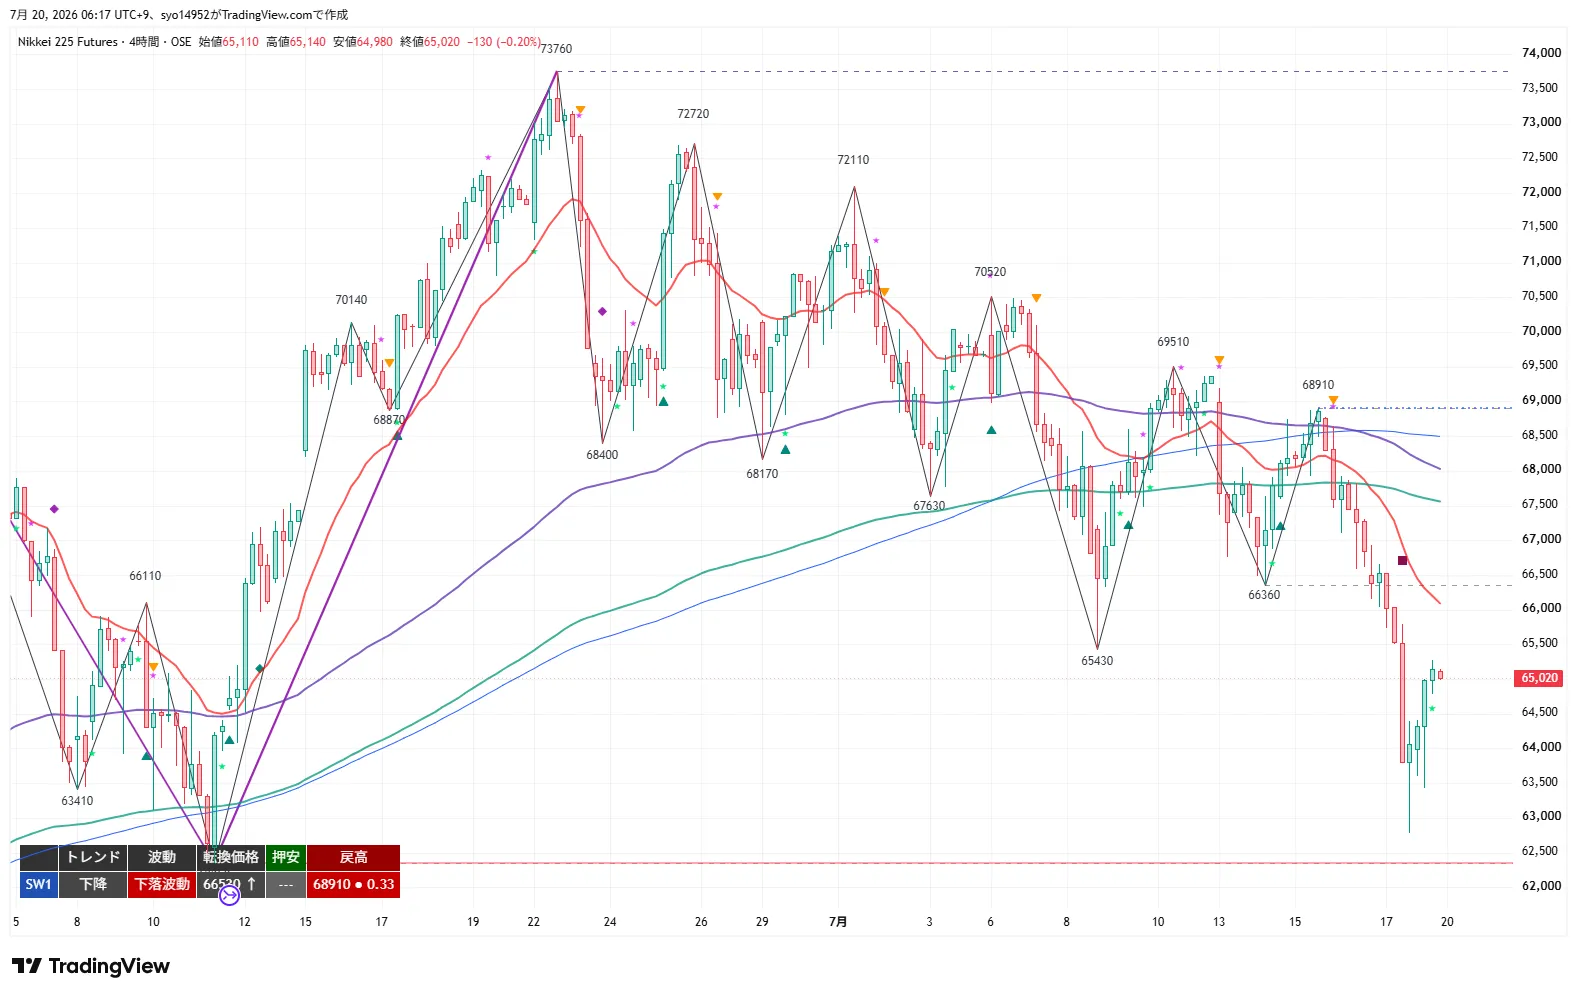
4H Analysis
The 4H chart shows a continuing downtrend and downward movement. A break below 66,360 and 65,430 (July 8 low) updates the low to 62,780, indicating the downtrend extended. However, there was a sharp rebound to 65,020, placing the near term in an autonomous rebound phase. The 20EMA is declined, and price is below the 20EMA (around 66,200), the 120EMA (around 68,000, equivalent to daily 20EMA) and the 200EMA (around 67,500).
Resistance levels: 65,430 (July 8 low = resistance turned), 66,360–66,520 (4H turning), 66,660, 67,930, 68,910. Support levels: 64,200 (1H turning), 63,430, 62,780 (latest low), 62,350 (structural low). Until 66,520 is recovered at close, the 4H downtrend remains intact and rallies are likely to be sold. Conversely, as long as 62,780 is not broken, autonomous rebounds may continue.
1H Analysis
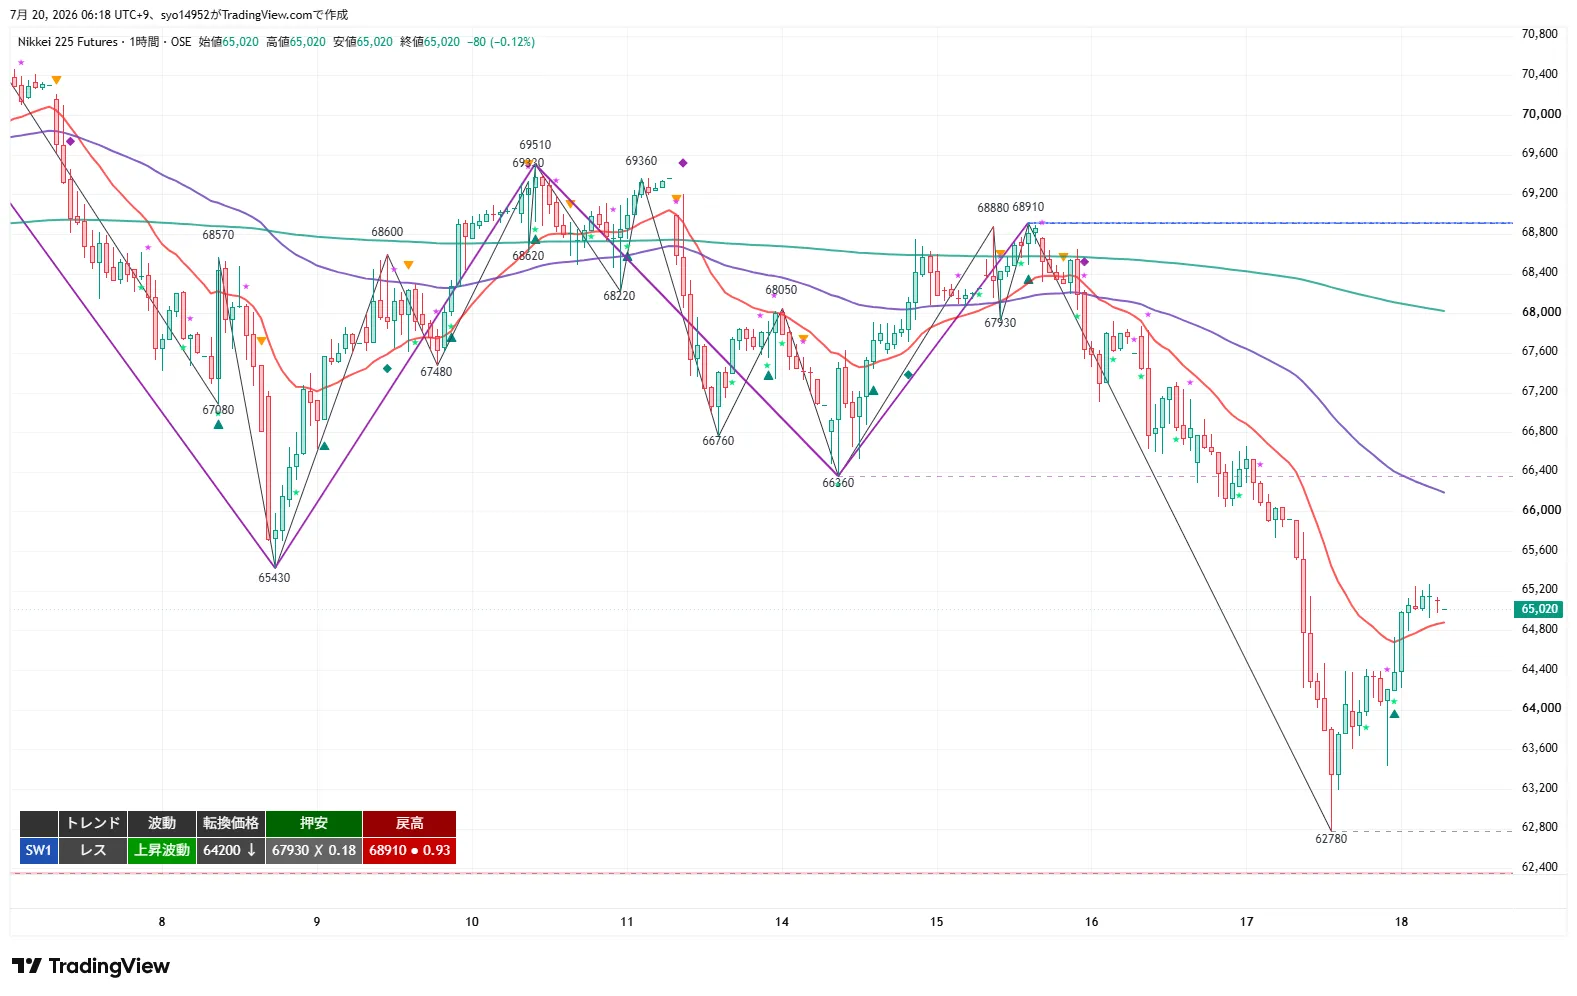
The 1H is in a range (transitioning from a downtrend) with momentum turning upward. It retraced from 62,780 to 65,020, and the turning price is 64,200. The 20EMA has turned up and price sits above it, but the 80EMA (4H 20EMA) and the 480EMA (daily 20EMA) remain above price.
As long as 64,200 holds on a 1H close, the up-move should continue, and a recovery through 65,430 will help extend the rally. Conversely, a 1H close below 64,200 would break the up-move and resume the downtrend. Resistance zones: 65,430–65,700 and 66,360–66,660 are notable for selling pressure.
15m Analysis
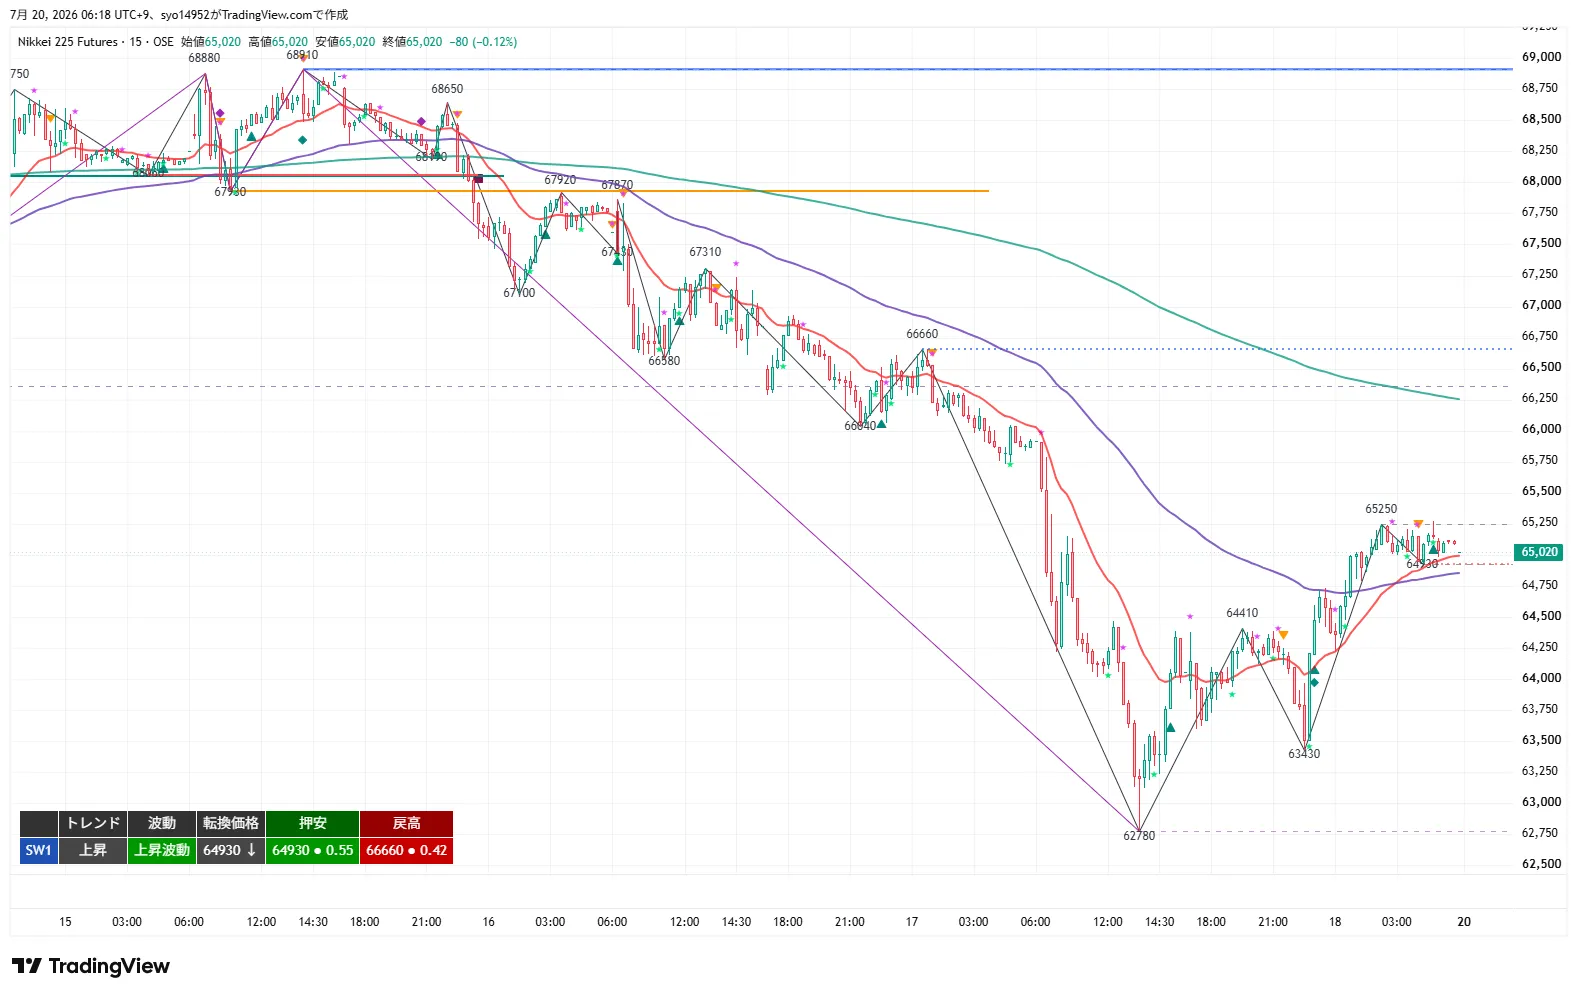
The 15m shows rising momentum, with turning price and support at 64,930 and a revival high of 66,660 (the upper of the prior high). Prices rose from 62,780 to 63,430 to 64,410 to 65,250 and closed at 65,020 after a shallow pullback to 64,930. The 20EMA is positively sloped and price stays near it; the 80EMA (1H 20EMA equivalent) and the 320EMA (4H 20EMA equivalent around 66,300) are above price.
In the near term, 64,930 acts as the lower bound of the pullback, and 65,250 is the divider with the most recent high. A close above 65,250 confirms an upward movement with a higher high; if price closes below 64,930, the up-move would fail and a decline would resume. Resistance near 65,430–65,700 and 66,360–66,660 remain key.
MTF State
- 4H:Downward / down-move. Break below 65,430 to 62,780 with autonomous rebound to 65,020. Turning point at 66,520, resistance at 68,910. 20EMA is downward; price is below it.
- 1H:Range / upward movement. From 62,780 to an up-move, returning to 65,020. Turning 64,200; support 67,930 (X) / resistance; 68,910 is the high. 20EMA is upward; price is above it.
- 15m:Upward / rising movement. Turning and support at 64,930 with target 66,660. 20EMA is positively sloped; price near it.
- Consistency:4H down / 1H and 15m up are in conflict. Autonomous rebound phase from 62,780. The main path is to prioritize selling rallies on higher timeframes, while retracement long entries on lower timeframes can function in the near term. Until 66,520 recovers, the overall trend is downward; a break below 64,200 resumes the downtrend.
Important Prices
- 68,910 yen: 4H and 1H pullback high. Upper barrier.
- 67,930 yen: 1H old support turned resistance (X = broken).
- 66,660 yen: 15m pullback high. Upper limit of Sell Zone 2.
- 66,520 yen: 4H turning price. Recovery could trigger 4H upturn.
- 66,360 yen: July 14 low / old range node. Lower bound of Sell Zone 2.
- 65,700 yen: Upper bound of Sell Zone 1. 1st target.
- 65,430 yen: July 8 low = resistance turned. Lower bound of Sell Zone 1 / primary line.
- 65,250 yen: 15m recent pullback high. Trigger for breakout follower (long).
- 65,020 yen: Current price / night close price.
- 64,930 yen: 15m pullback low / turning price. Upper bound of Sell Zone 1; break below could cause 15m up move to fail.
- 64,410 yen: Resistance point in rebound. Lower bound of Sell Zone 1.
- 64,200 yen: 1H turning price. Breaks would resume downtrend.
- 63,430 yen: Pivot point for rebounds. Deep pullback candidate.
- 62,780 yen: Most recent low (July 17 night low). Break would make new lows.
- 62,350 yen: 4H structural low. Most important downside.
Trading Ideas
① Breakout Following (Long)
- Trigger: Break above 65,250 (15m recent pullback high) on 15m close (new high in up-move).
- Prerequisite: After the breakout, pullback near breakout price or around the inclined 20MA on small-timeframes like 1m/5m to confirm (back-entry, breakout price basis).
- Primary condition: 65,430 (July 8 low = resistance turned) recovers on a 1H close.
- Stop loss / invalidation: Break for the leading leg below 64,930; main leg below 64,610.
- Targets: 65,700 (partial take + entry price), 66,360 / 66,660.
- RR: T1 (65,700) = 1.4 / T2 (66,360) = 3.5. Since T1 is lower, emphasize back-entry with the main position.
- MFE protection: close or trim back at +200 yen for break-even or small profit, lock at least +100 yen with +300 yen or use trailing. Protect early as price is expanding downward on the 4H.
② Buy the Dip (Long)
- Standard: Dip to 64,930–64,410 (15m support to turning point) and confirm rebound shape by 15m close. Deeper dip to 64,200–63,430.
- Main condition: Recover above 65,430 on 1H close.
- Stop/Invalidation: Leading leg above 64,610, main leg below 64,180. Fully exit below 63,380. If 64,200 clearly closes below, consider it a downtrend resume and switch to (④).
- Targets: 65,700 (partial take + entry), 66,360 / 66,660.
- RR: T1 (65,700) = 1.8 / T2 (66,360) = 3.5.
- MFE protection: close or trim at +200 yen for break-even or small profit, secure at least +100 yen with +300 yen, and avoid deep chasing in the Sell Zone given the ongoing 4H down move; protect early. If trigger step reaches T1, may skip entering.
③ Sell the Rally (Short)
- Standard: Cap upside in the 65,430–65,700 zone (July 8 low = resistance turned) and confirm stall with a 15m close. Sell Zone 2 is 66,360–66,660 (4H turning 66,520 + 15m pullback high).
- Main condition: Break below 64,200 on 1H close (up-move fails; downtrend resumes).
- Stop/Invalidation: Leading leg recovers above 65,980; main leg recovers above 65,700. Strong invalidation at 66,520 (4H turning recovery = 4H upturn candidate).
- Targets: 63,430 (partial take + entry), 62,780 / 62,350.
- RR: T1 (63,430) = 5.7 / T2 (62,780) = 7.4.
- MFE protection: close or trim at +200 yen for break-even or small profit, secure at least +100 yen with +300 yen. Since the overall trend is down, avoid chasing; confirm a true close below and then enter main leg. If the trigger leg has already reached T1, skip.
④ Breakout Following (Short)
- Trigger: Break below 64,930 (15m support price) on 15m close (near-term up-move failure).
- Prerequisite: After the break, pullback near breakout price or near the inclined 20MA on small timeframes like 1m/5m to confirm (back-entry, breakout price basis).
- Main condition: Break below 64,200 on 1H close (up-move failure / downtrend resumes).
- Stop/Invalidation: Leading leg recovers above 65,280; main leg recovers above 65,430. Complete exit above 65,700.
- Targets: 63,430 (partial take + entry), 62,780 / 62,350.
- RR: T1 (63,430) = 4.3 / T2 (62,780) = 6.1.
- MFE protection: close or trim at +200 yen for break-even or small profit, secure at least +100 yen with +300 yen. Since this is a move to negate an autonomous rebound, wait for a clear close below and then enter the main leg, as a rapid rebound is possible.
Current Actions
- Most Important Line 1: 64,930–64,200 yen. Support zone for buying dips (15m pullback low to 1H turning). If rebound continues, retain longs in the near term; if 64,200 closes below on a 1H, the up-move fails and a downtrend resumes (switch to ②→④).
- Most Important Line 2: 65,430–66,660 yen. Upper bounce zone and selling zone (July 8 low to 4H turning 66,520 to 15m pullback high). Break above 65,250 triggers follow-through, with selling pressure if rebound stalls. If 66,520 recovers on 1H close, 4H upturn candidate.
Entry price, trigger, and stop are set based on the chart shape at the close (turning prices, swing lows, and retracement highs of each timeframe). If the structure changes over time, unless higher-timeframe structure changes, adjust entry prices based on turning prices of lower timeframes (e.g., a short-term timeframe resuming an up move after a down move), selecting the option that aligns more with actual conditions. Note the gap risk on Monday open due to weekend.
※This report is for information purposes and not financial advice. Investment decisions are the reader’s responsibility.