

[Read FX by Three-Currency Parity — Turning Daily “Distortions” into Profit: Analysis of Three-Currency Parity] Part 3: Diagramming Three-Currency Parity — A New Concept of a “1 Set” called Triad
Last time I talked about how looking at only two currencies as a pair obscures the market's “structure.”This time, I’ll go one step further—and
What do you see when you treat three currencies as one triangle (Triad)? I’ll try to convey it with as diagrammatic an image as possible.
1. Start with a simple triangle relationship
In FX, for example,EUR・GBP・USDthree currencies yield
-
EURUSD
-
GBPUSD
-
EURGBP
a set of three currency pairs.
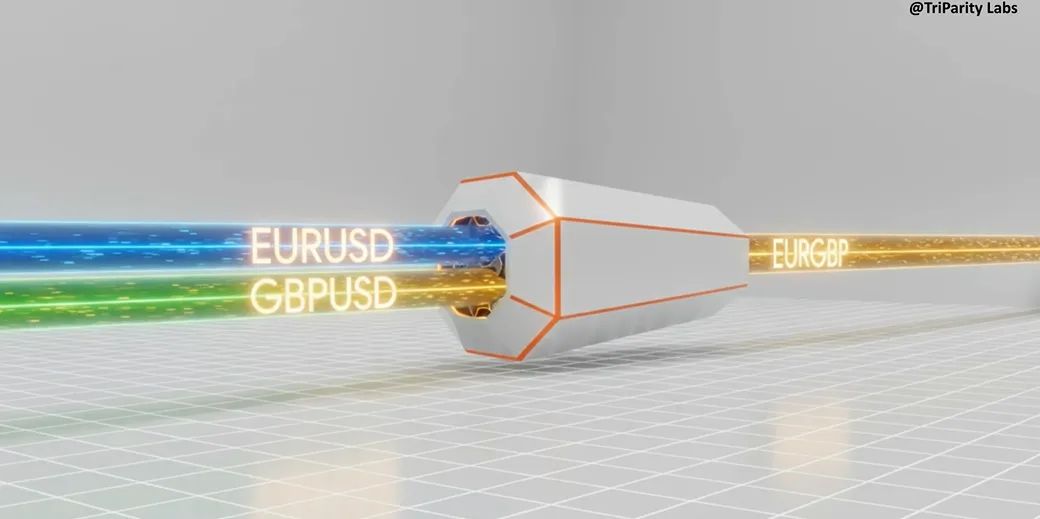
What’s important here is not that these three move independently, but thatthey are in a relationship that should naturally mesh together.
If written as an equation, it looks like this.
EURUSD ÷ GBPUSD ≒ EURGBP
For example,
-
EURUSD = 1.20
-
GBPUSD = 1.50
then the theoretical EURGBP would be
1.20 ÷ 1.50 = 0.80
approximately… that is the idea.
Actual rates don’t match perfectly due to spreads and market fluctuations, but
there exists a relationship that “should mesh like this” in theory──
This is Triad parity (consistency of triangle relationships).
2. Triad (Triad) = concept of a 3-currency set
Thus, the three pairs composed of three currencies are
“Triad = a set of 3 currencies”and treating them as a single unit is the starting point of TriParity analysis.
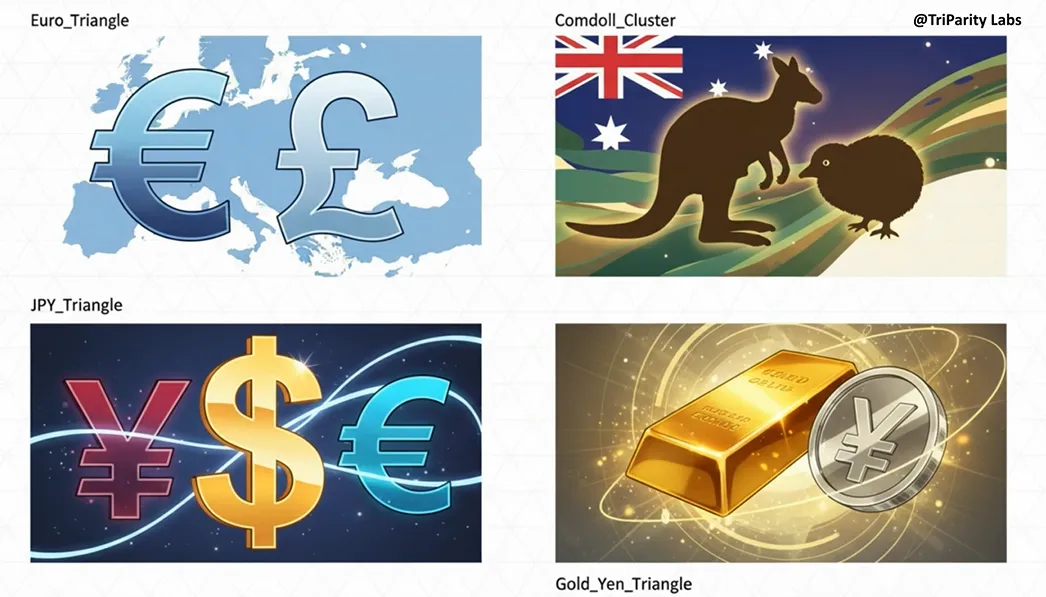
Here are a few representative Triads described in image form.
-
Euro_Triangle
-
Pairs: EURUSD | GBPUSD | EURGBP
-
What you look at → See the structure after removing the influence of USD from the EUR and GBP relationship.
-
-
Comdoll_Cluster
-
Pairs: AUDUSD | NZDUSD | AUDNZD
-
What you look at → Compare AUD vs NZD commodities with USD noise filtered out.
-
-
JPY_Triangle
-
Pairs: EURUSD | USDJPY | EURJPY
-
What you look at → View EUR vs JPY in a three-dimensional way using USD as the intermediary.
-
-
Gold_Yen_Triangle
-
Pairs: XAUUSD | USDJPY | XAUJPY
-
What you look at → Analyze the yen-denominated gold price (XAUJPY) by combining gold and USD/JPY.
-
For each Triad,
-
which currency pair’s influence you want to extract
-
which markets you are sensitive to (Europe, Asia, commodities, safe assets, etc.)
have different “characteristics.”
Rather than looking at one pair in isolation, treat the three as one unit.
That is the first key point of the Triad concept.
3. A baseline of “this should mesh like this”
The strongest point of Triad
is that from the start you can hold a baseline that says, “these three should mesh in this way”
.
In the earlier example of EUR, GBP, and USD,
EURUSD ÷ GBPUSD = (theoretical) EURGBP
you can calculate a theoretical value A/C.
Then by comparing it to the actual EURGBP rate,
“how out of alignment is it right now?”
= “how distorted is it?”
you can quantify it.
This difference between the theoretical value and the actual is
In TriParity this isParity Gap.
4. Parity Gap = the very distortion of the triangle relationship
As a visual, it’s like this.
-
Step1: Decide the Triad
-
Example: EURUSD / GBPUSD / EURGBP
-
-
Step2: Compute the theoretical rate
-
EURUSD ÷ GBPUSD → theoretical EURGBP
-
-
Step3: Compare with the actual EURGBP
-
Take the difference (gap) between the “theoretical value” and the actual rate
-
-
Step4: Track that gap as a single sequence
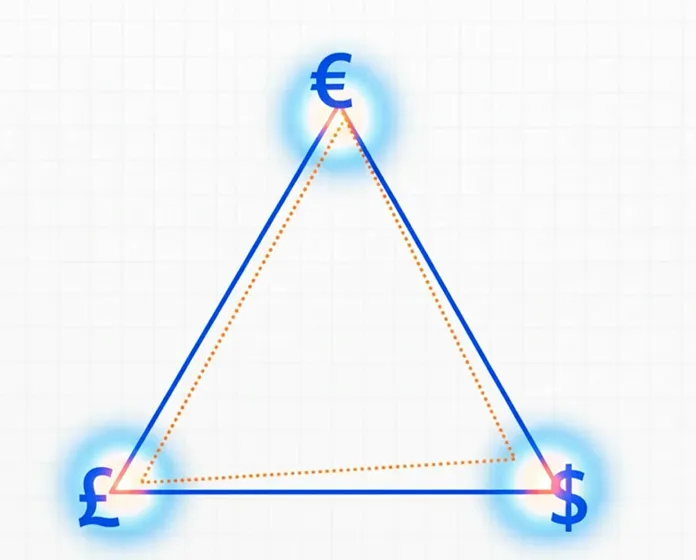
As this gap grows larger,
“this three-currency triangle is far from its natural alignment”
to be the takeaway.
Conversely, if the gap returns near zero,
“the distortion is resolved and the triangle relationship is once again in alignment”
this is the view you can take.
In TriParity analysis, this Parity Gap is furtherstandardized with a Z-score to be drawn as a “Distortion Line”to show
“how abnormal the current distortion is compared to past statistics” on a single line.
(Details on Z-scores will be covered in depth in the fourth installment.)
5. You can see who contributes most to the distortion
One interesting aspect of three-currency parity is that
“not only the magnitude of the misalignment, but also
which of the three pairs is contributing how much to that misalignment” can be analyzed
.
Specifically,
-
Viewed as a Triad as a whole, there is certainly a large distortion
-
But when broken down,
-
EURUSD and GBPUSD are relatively stable
-
EURGBP is the one that’s “going rogue”
-
In this case, you can see that
“the main culprit of the distortion is EURGBP (the cross).
The other dollar pairs aren’t distorted that much.”
This structure becomes clear.
Conversely,
-
EURGBP and GBPUSD are calm, but
-
EURUSD is running extreme
then it can be judged that
“The pushing factor in this Triad is EURUSD.”
you can conclude this.
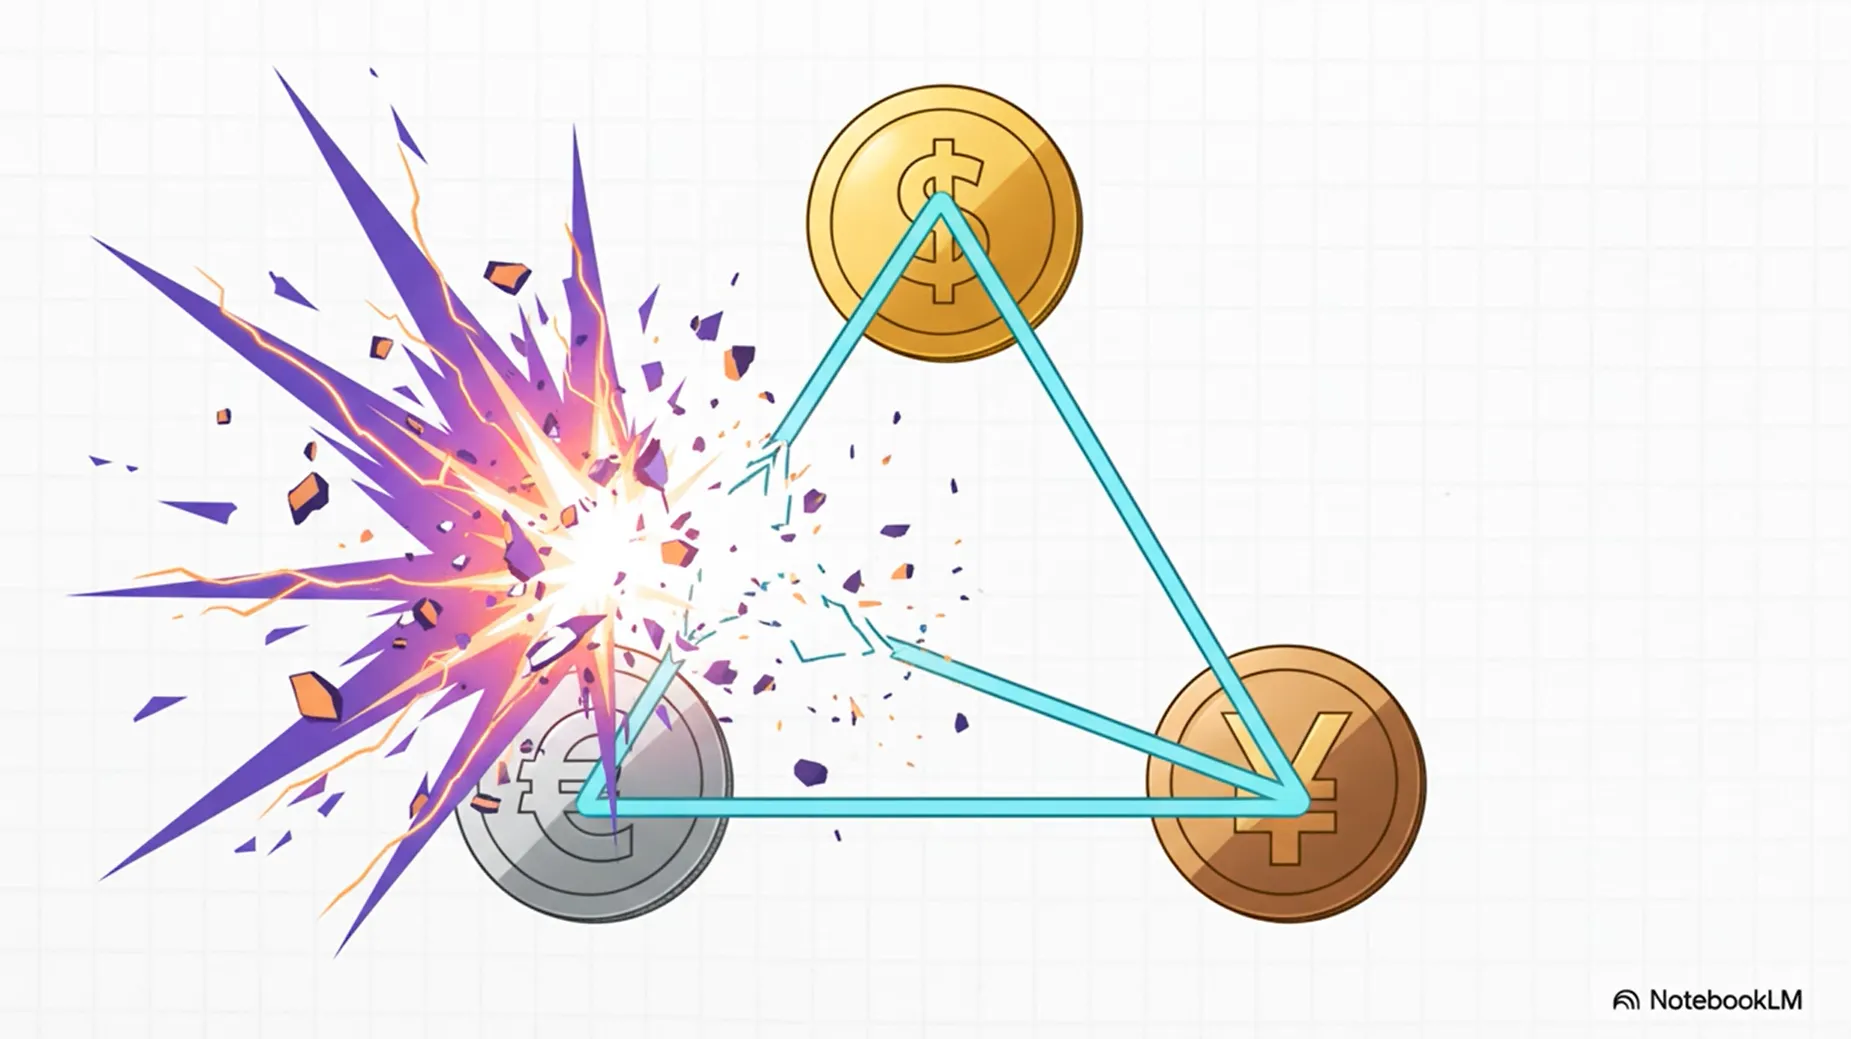
TriParity analysis embeds a mechanism to visualize this“who is pushing the most (leading leg)”and
so you can determine at a structural level which pair is most sensible to build from.
6. Each Triad reveals a different “world”
From the previous discussions, you can naturally imagine
“which Triad you choose can drastically change what you see.”
A few examples:
-
Euro_Triangle (EURUSD / GBPUSD / EURGBP)
→ See the European EUR vs GBP tug-of-war with USD removed.
-
Comdoll_Cluster (AUDUSD / NZDUSD / AUDNZD)
→ See the relative wins and losses among commodity currencies, decoupled from USD moves.
-
JPY_Triangle (EURUSD / USDJPY / EURJPY)
→ See the EUR vs JPY relationship with USD strength and cross yen in one structure.
-
Gold_Yen_Triangle (XAUUSD / USDJPY / XAUJPY)
→ Break down the movement of yen-denominated gold by combining gold and USD/JPY.
Even when looking at the same USDJPY or EURUSD charts,
the meaning of the distortion changes greatly depending on which Triad you frame it as..
7. A decisive difference from single-pair analysis
Putting what we’ve discussed together and comparing with single-pair analysis:
Single-pair analysis
-
Looks at the “overextension/retrace” within just that pair
-
Market structure is supplemented by multiple charts only as an impression
-
Who is the lead actor and why it’s distorted tends to be vague
Triad-based three-currency parity analysis
-
From the start“one relation expressed by three currencies”is held
-
Allows quantitative measurement of the discrepancy between theory and reality (Parity Gap)
-
Shows which pair contributes to distortion (leading pair)
-
Enables structural-level judgments on which pair to use for a sensible build
In other words,
“By introducing Triad as a ‘set view,’
you can reorganize what was previously done by feel,
into a framework based on equations and statistics.””

That is the key point in diagramming three-currency parity.
8. Preview of next time — making distortion numeric with Parity Gap and Z-score
This time, we covered
-
Forming a triad with three currencies
-
The relationship should mesh as a triad parity, inherently
-
Tracking the part that diverges — Parity Gap
-
Additionally, breaking down which pair contributes most to the distortion
and organized it as diagrammatically as possible.
Next time, to evaluate Parity Gap with the view of
“how abnormal the distortion is compared to past statistics”
we will discuss converting it into a Z-score (how many standard deviations away it is).
From here on, it becomes a practical guide to link distortion to actual trading strategies, so please stay with us for the continuation.
※The contents of this series reflect the author's personal views and do not advocate specific currency pairs or trades.
Final investment decisions should be made at your own responsibility.
Video summary (Japanese version)
Video summary (English version)