
Reading FX with the Three-Currency Parity: Turning Everyday "Distortions" into Profit via Three-Currency Parity Analysis, Episode 2: Can You See the "Structure" with Analysis of Only Two Currencies? - The Limitations of Analyzing One Pair
Last time,“The market should move according to theory, right?” “Every day a small ‘distortion’ is appearing somewhere.”We went together up to that point. This time, we will look at“distortion”and what limits you would hit if you chase it by looking at only one currency pair──
and I would like to整理(organize/clarify) from there.
1. The Typical “One-Pair Analysis” that many traders do
First, let’s review the common ways charts are used.

-
Top left: USDJPY 15-minute chart
-
Top right: the same USDJPY on a 1-hour chart
-
Bottom: oscillators such as RSI, Stochastics, MACD
-
Overlay Bollinger Bands or moving averages as needed
With this setup,
-
“Timing with shorter timeframes”
-
“Confirm the direction from higher timeframes”
-
“Check overbought/oversold with oscillators”
is the most common one-pair analysis style.
This approach itself is by no means wrong.I have used it for a long time and still refer to it.
However,“distortions in the market”, when taken seriously, reveal thata one-pair analysis inevitably leaves a blind spot.
2. Three things you miss with analysis that is limited to a single pair
If you’re only looking at one currency pair, the following three things become hard to see.
① You can’t tell who is really driving the market
For example USDJPY surges,
-
Is the USD getting stronger?
-
Is the JPY weakening?
-
Or are both moving in sync?

With only one pair, it’s hard to identify the true“main actor”.
If, at the same time, for example
-
EURUSD is also risingas well
-
butEURJPY is flat
in that situation,
“Ah, the main actor is this ‘dollar strength’”
you might think,
but that judgment is ultimatelyan impression formed by eyeballing multiple charts.
② You cannot grasp relationships (structure) with other currencies
Technical indicators basicallycontain only information that is within that pair.
-
Bollinger Bandsarethe standard deviation of that pair’s price
-
RSIandStochasticsmeasurethe strength of that pair’s move
-
MACDisthe relationship between moving averages of that pair
In other words,you’re only looking at the excess within USDJPY in the world.
But in reality, the forex market is a result of the tug-of-war among currencies themselves, such as
USD, JPY, EUR, GBP, AUD… and so on.
A single-pair indicator cannot reveal
-
“Which currency is really being bought more, EUR or GBP?”
-
“Against the overall cross-yen moves, is this one currency in an odd position?”
such“relative distortions” become hard to see.
③ It’s hard to pinpoint why the distortion occurred
As discussed earlier, market distortions arise from
-
timing of indicators
-
actual demand flows (fixings, place rates, etc.)
-
algorithmic biases
and other factors.
However,looking at only one pair,
-
“Is this drop because only NZD is being sold?”
-
“Or is the dollar broadly bid?”
-
“Is another currency moving, indirectly pulling this one along?”
and other“structural reasons” remain unknown.

As a result,
-
“Buying a currency that looked strong” can get swallowed by a reversal in another currency
-
“Trying to fade what looked oversold” can be crushed by a trend led by other currencies
and so onleading to losses from unseen backgrounds.
3. Is it true that you can fix it by lining up multiple pairs?
Feeling these limitations, many people add more charts after chart.
-
Top row: dollar pairs (EURUSD, GBPUSD, AUDUSD, …)
-
Middle row: cross-yen pairs (EURJPY, GBPJPY, AUDJPY, …)
-
Bottom row: indices, gold, stock indexes, etc.
Of course, this helps you get a“rough market sense”.
However, when you actually consider entering a trade, don’t you feel this?
“NZD looks weak, but is it really just NZD?”
“I have a sense that EUR is strong, but I don’t know which pair to enter with.”
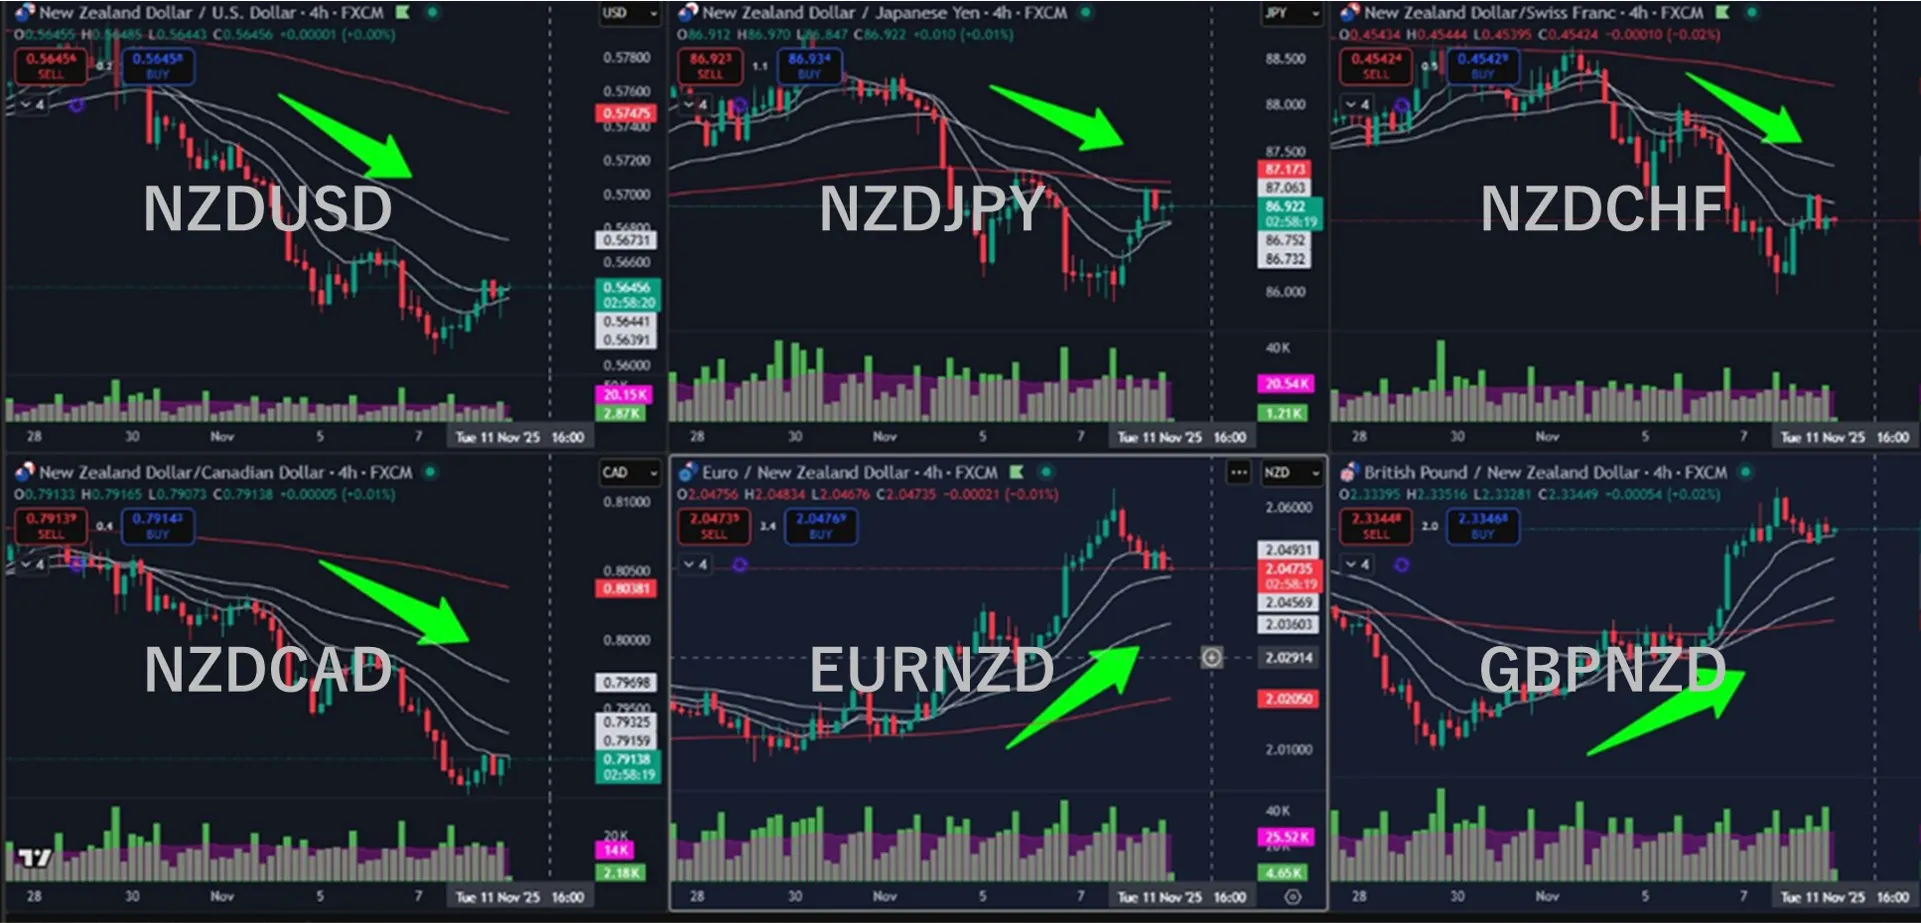
In other words,
-
You can tell the vague impressions like “NZD is weak” or “EUR is strong.”
-
But
-
“Which pair should I buy?”
-
“How distorted is the market?”
-
“How far back must the distortion revert to say it’s resolved?”
-
4. What you want is a structural-level answer
Putting it together, what we truly want is
“What move is happening now, and which currencies are pushing it, by how much?”
“From the relationships among three currencies or multiple pairs, how distorted is the state?”
“If that distortion returns to balance, which pair and roughly how far back is most likely?”
and so on,a “structural-level answer”.
With analysis limited to one pair,
-
Price movement
-
Volatility
-
Oscillator position
and other“numbers that show up on the chart as a result” are all you’re looking at.
There you
-
the alignment between currenciescoherence
-
which pair contributes how much to the distortion“contributes to the distortion”
-
where the restoration of equilibrium began“beginning of the mean reversion”
and other“relational information”, if you combine them, you can make totally different judgments even on the same chart.
The next chapter is“5.“How to see a world that isn’t visible with two currencies?””