
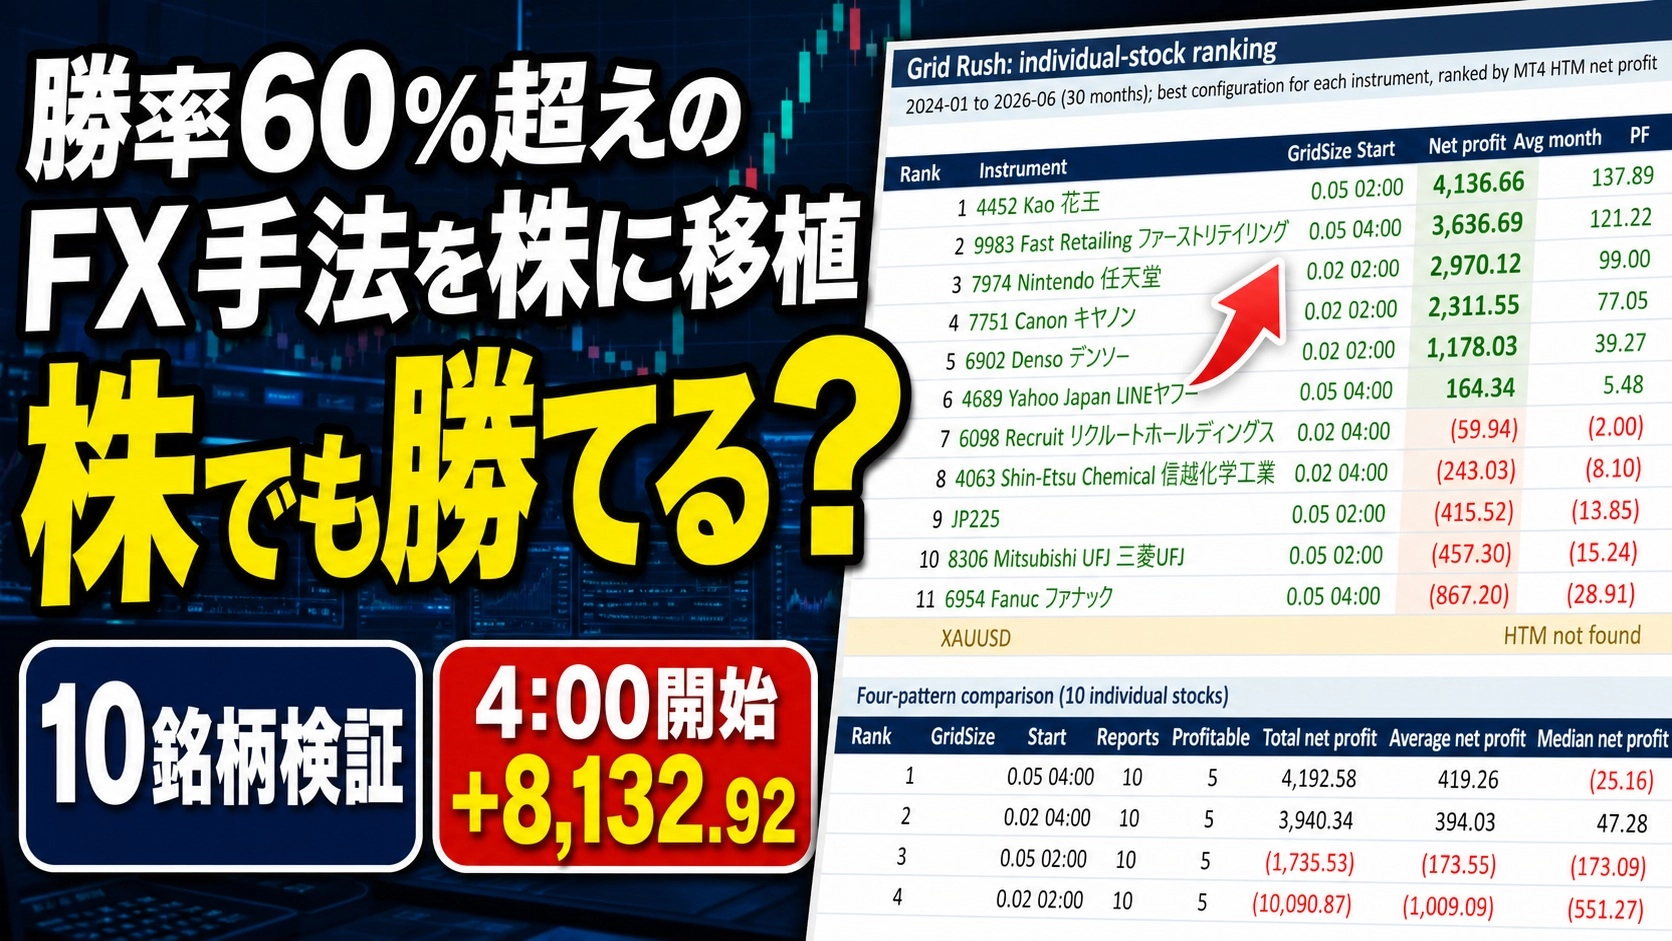
Does a method with a win rate over 60% in FX also work for individual stocks? I actually tested it.
“If a contrarian trading method with a win rate over 60% in FX could be applied to Japanese stocks, wouldn’t you be able to win there as well?”
Have you ever thought like this?
Contrarian methods using RSI or Bollinger Bands, grid systems that add positions at fixed intervals, and pyramiding adds as losses mount are abundant. These counter-trend strategies share a common point: they tend to have high win rates but can incur large losses when the market trends strongly in one direction.
Therefore, in this article, I applied a contrarian method developed for FX to Japanese individual stocks and conducted backtests on MT4.
For verification, historical data of Japanese stock CFDs obtained with Tick Data Suite, commonly known as TDS, was used. The targets are 10 stocks: Shin-Etsu Chemical, Kao, LINE Yahoo, Recruit Holdings, Denso, Fanuc, Canon, Nintendo, Mitsubishi UFJ Financial Group, and Fast Retailing.
In short,there was a certain statistical significance of contrarian logic even in Japanese stocks. Depending on the conditions, win rates around 60% or even above 60% were observed in some cases.
However, the verification period was only about two and a half years, and spread and actual order execution conditions could not be fully reproduced.
This article not only presents backtest results but also explains in detail the following points:
- Why FX contrarian methods work in Japanese stocks
- How to verify Japanese stock CFDs data in MT4
- Points to note when looking at a 60% win rate
- Challenges in applying to actual stock trading
- How to build your own contrarian logic
Since 2020, I have been developing MT4/MT5 EAs and indicators, and have created over 200 pieces.
This time I will share the findings from those experiences and present the verification results for Japanese stocks.
Will FX contrarian methods work in Japanese stocks?
What I tested this time is a contrarian method that sells when the price has risen too much and buys when it has fallen too much, i.e., a contrarian approach.
Contrarian trading is also called counter-trend trading. You enter on the opposite side of the current movement and aim for the price to revert to its original level.
For example, when the stock price drops sharply in a short period, you buy and take profits after a small rebound. Conversely, when there is a rapid rise, you enter from the selling side and close the position once the price settles.
This kind of method is commonly used in FX.
There are various approaches, such as RSI-based overbought/oversold signals, price movement beyond Bollinger Bands, and grid-type methods that hold positions at fixed price steps.
I have also developed multiple grid-type and contrarian EA and indicator systems so far.
From ongoing testing, contrarian strategies tend to perform well in ranges.
When the market fluctuates within a certain range, selling at higher levels and buying at lower levels tends to work well. Since profits accumulate in small increments, win rates tend to be relatively high.
On the other hand, when the market begins to move strongly in one direction, contrarian strategies become difficult.
If you buy while the price is falling and it continues to fall, unrealized losses grow. Pyramiding can help realize profits if a rebound occurs, but if there is no rebound, losses can become substantial.
In short, contrarian methods tend to increase win rate but can incur large losses when wrong.
In this verification, I checked whether the FX contrarian approach could also work for Japanese stocks.
Backtesting Japanese stocks on MT4 using TDS
Individual Japanese stocks cannot normally be backtested directly on MT4.
Therefore, in this study I used Tick Data Suite, known as TDS.
TDS provides historical data not only for FX currency pairs but also for some stock indices and individual stock CFDs.
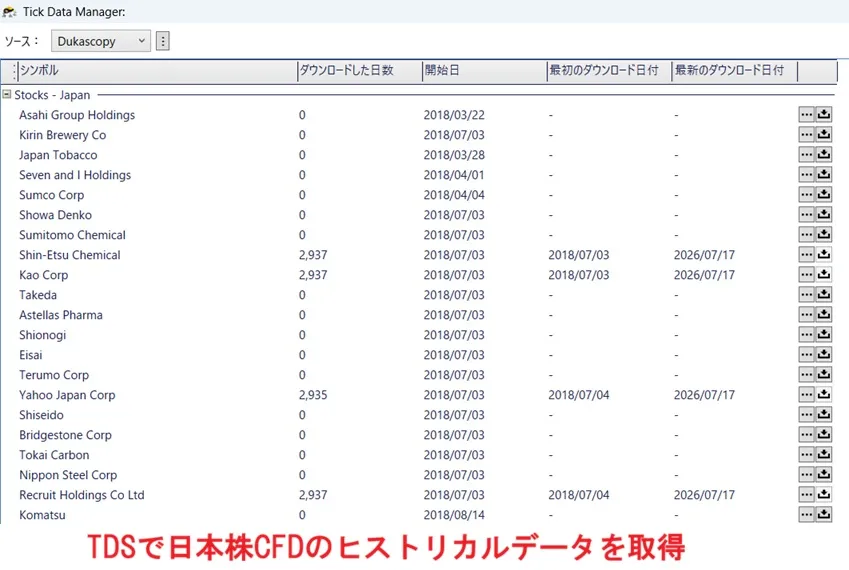
The 10 stocks we examined are Shin-Etsu Chemical, Kao, LINE Yahoo, Recruit Holdings, Denso, Fanuc, Canon, Nintendo, Mitsubishi UFJ Financial Group, and Fast Retailing.
All are well-known large-cap stocks, but their industries and price movements differ.
For example, Mitsubishi UFJ Financial Group is sensitive to interest rates and monetary policy, while Fanuc and Shin-Etsu Chemical are influenced by overseas economic conditions and semiconductor-related movements.
Nintendo tends to react to game-related news, and Fast Retailing has a large impact on the Nikkei 225 index.
By testing multiple stocks with different price movements together, we checked whether contrarian logic works only by chance on certain stocks or whether it can be applied to multiple stocks.
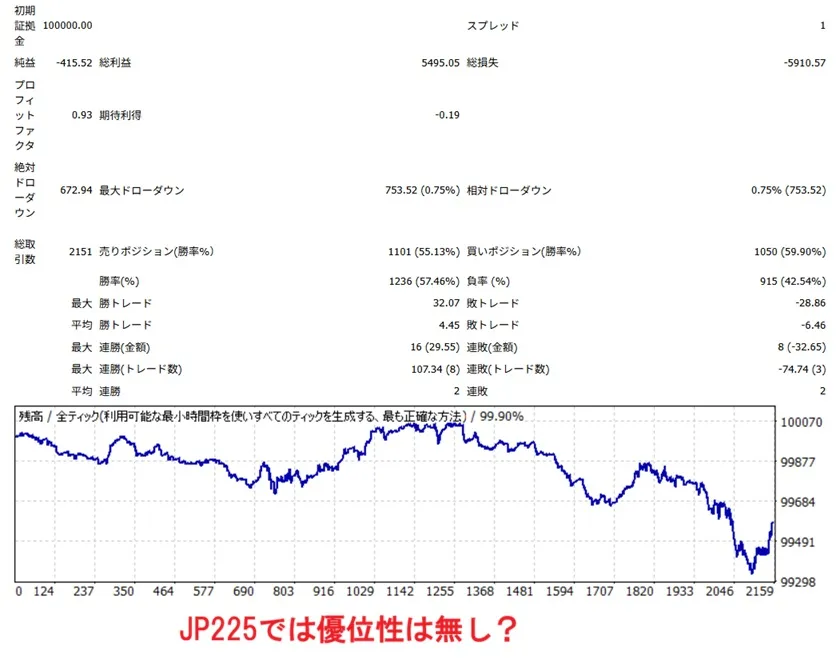
As a reference, we also applied the same logic to the JP225 CFD, which tracks the Nikkei 225 index.
Backtest period and time frames
The verification period was from January 1, 2024 to June 30, 2026.
Approximately two and a half years of data.
Although it is a relatively short period for judging long-term edge, it was considered a useful reference to determine whether contrarian logic responds in Japanese stocks as well.
In this verification, the times at which the EA starts moving were varied.
The main patterns were starting around 2:00 server time and starting from 4:00.
Server time shifts relative to Japan time depending on MT4 version and daylight saving time, but conceptually this approach divides into patterns that start near the market open and patterns that start after some price movement has settled post-open.
Japanese stocks can move significantly immediately after the market opens.
This is to promptly incorporate the previous day's US market movements and nighttime news.
This period tends to have larger price ranges, but contrarian trading in this window can lead to being drawn into a strong trend.
Therefore, we checked whether performance changes when trading from near the open versus with a slight delay.
We also divided the entry exit times into several options.
Japanese stock CFDs change liquidity and trading conditions as the Japanese market approaches close. Therefore, we generally focus on entry during market hours and avoid taking new positions close to the close of the session.
Results of testing 10 Japanese stocks
In actual backtests, results varied considerably depending on the stock and trading times.
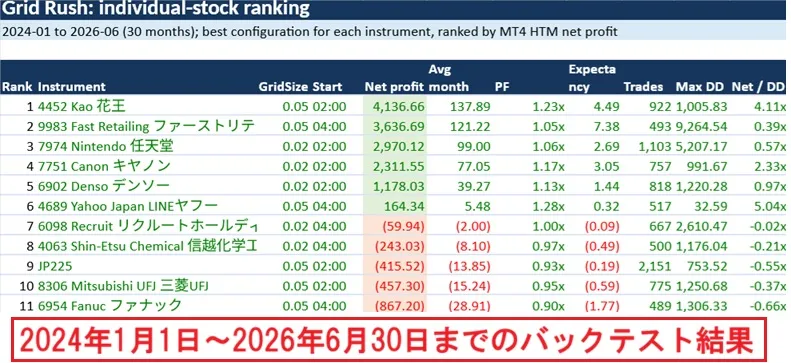
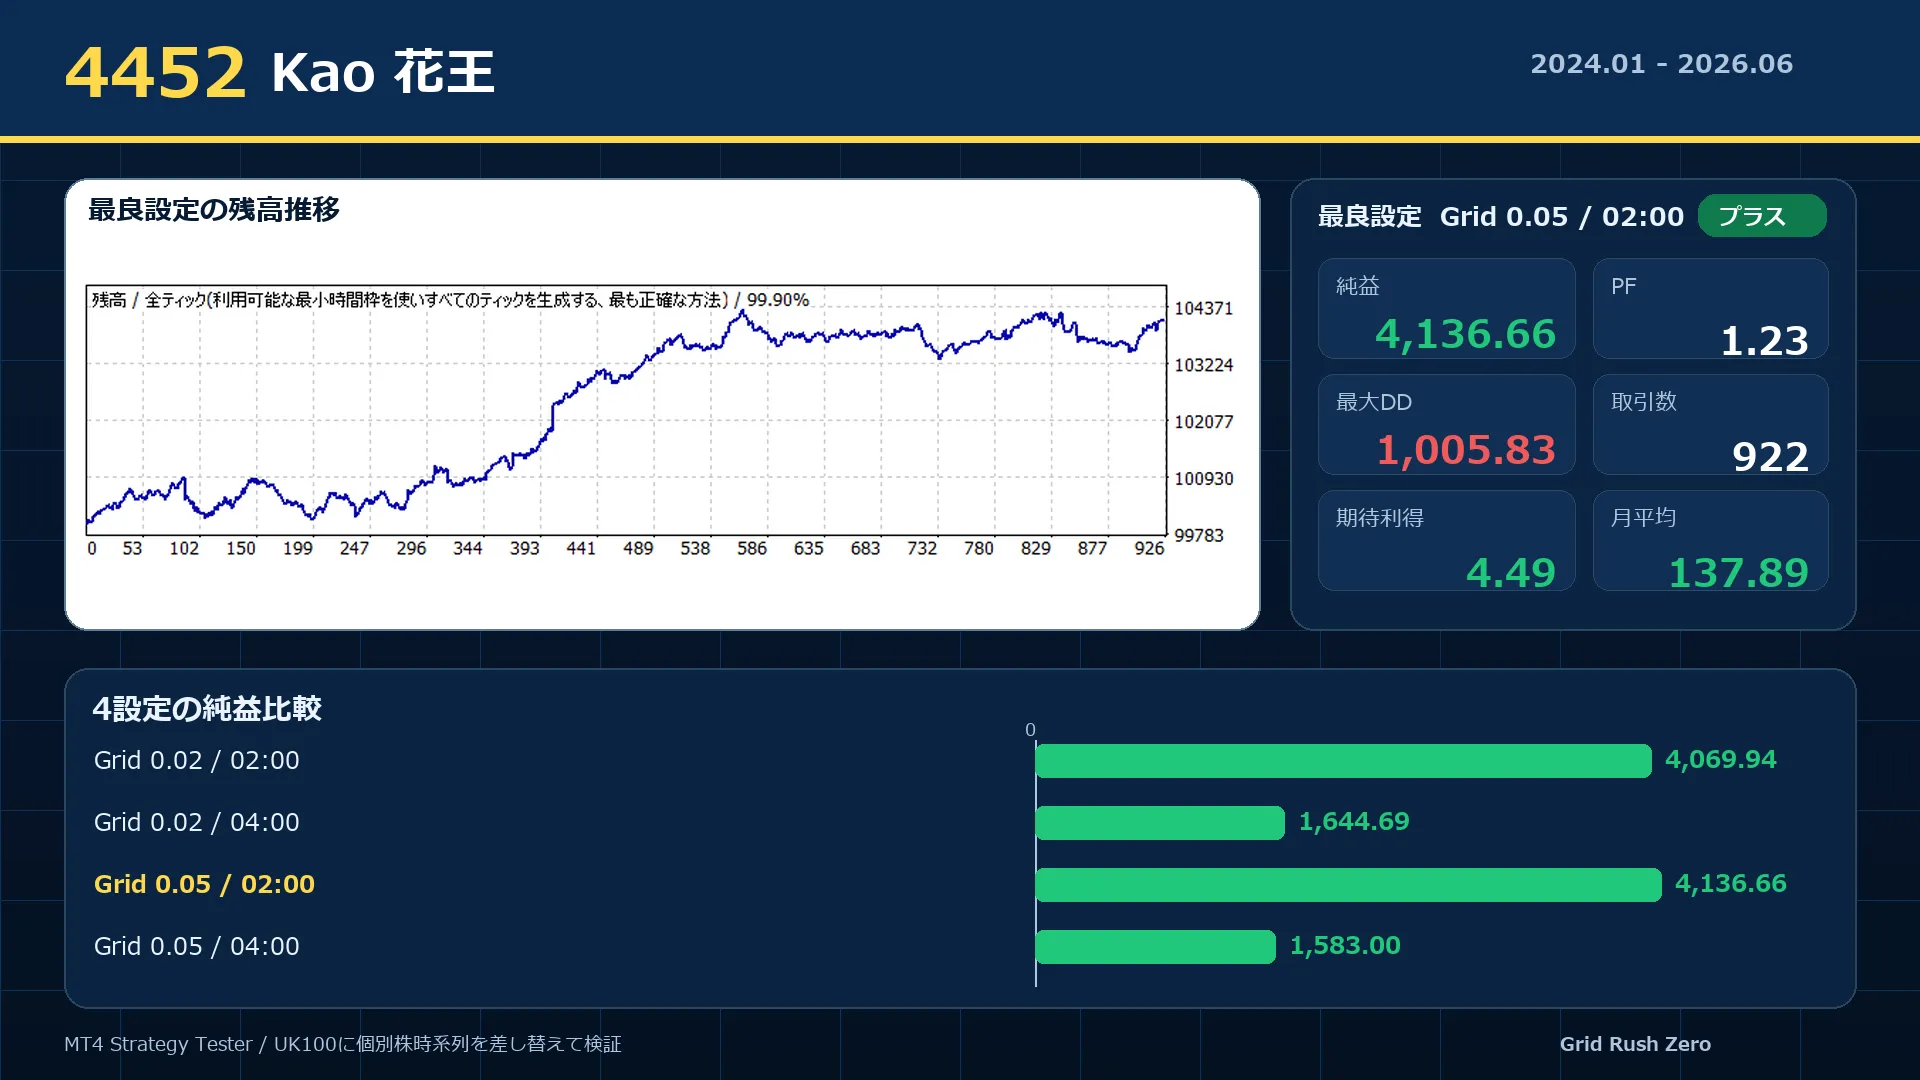
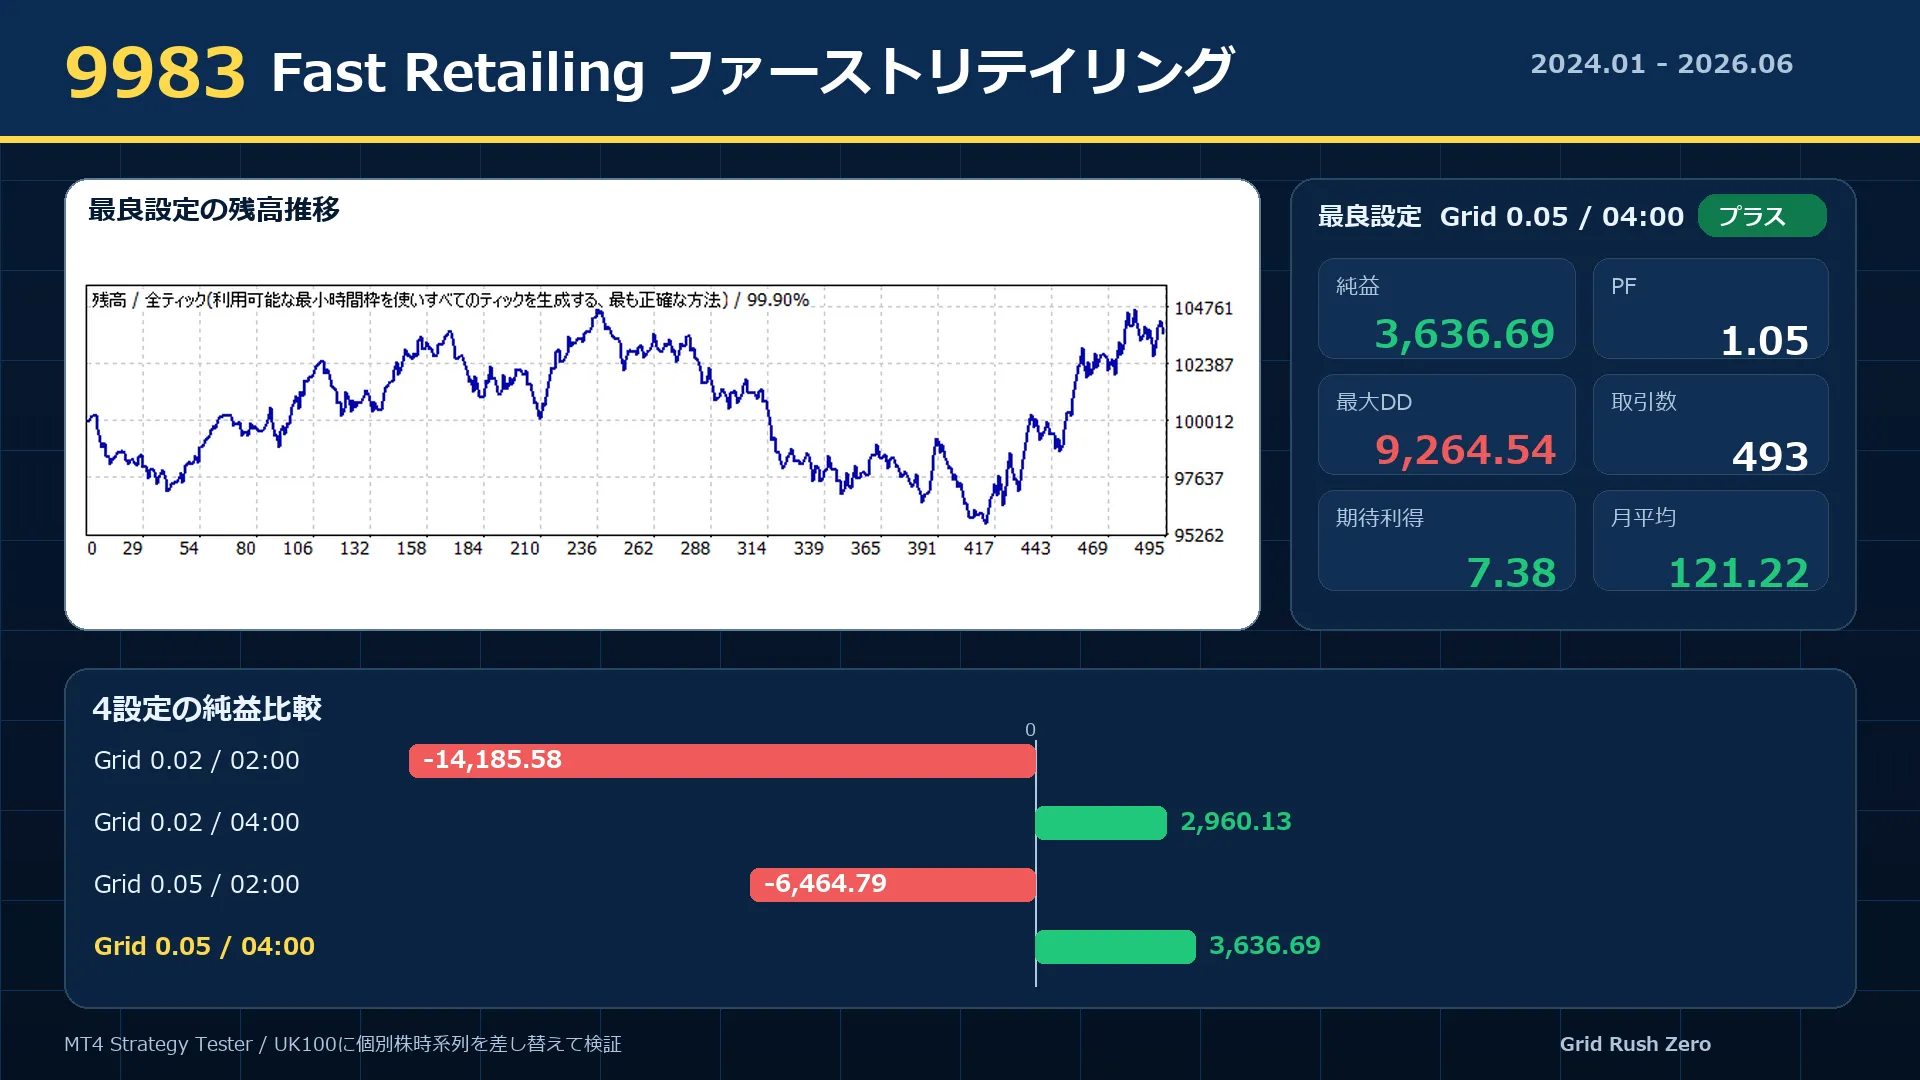
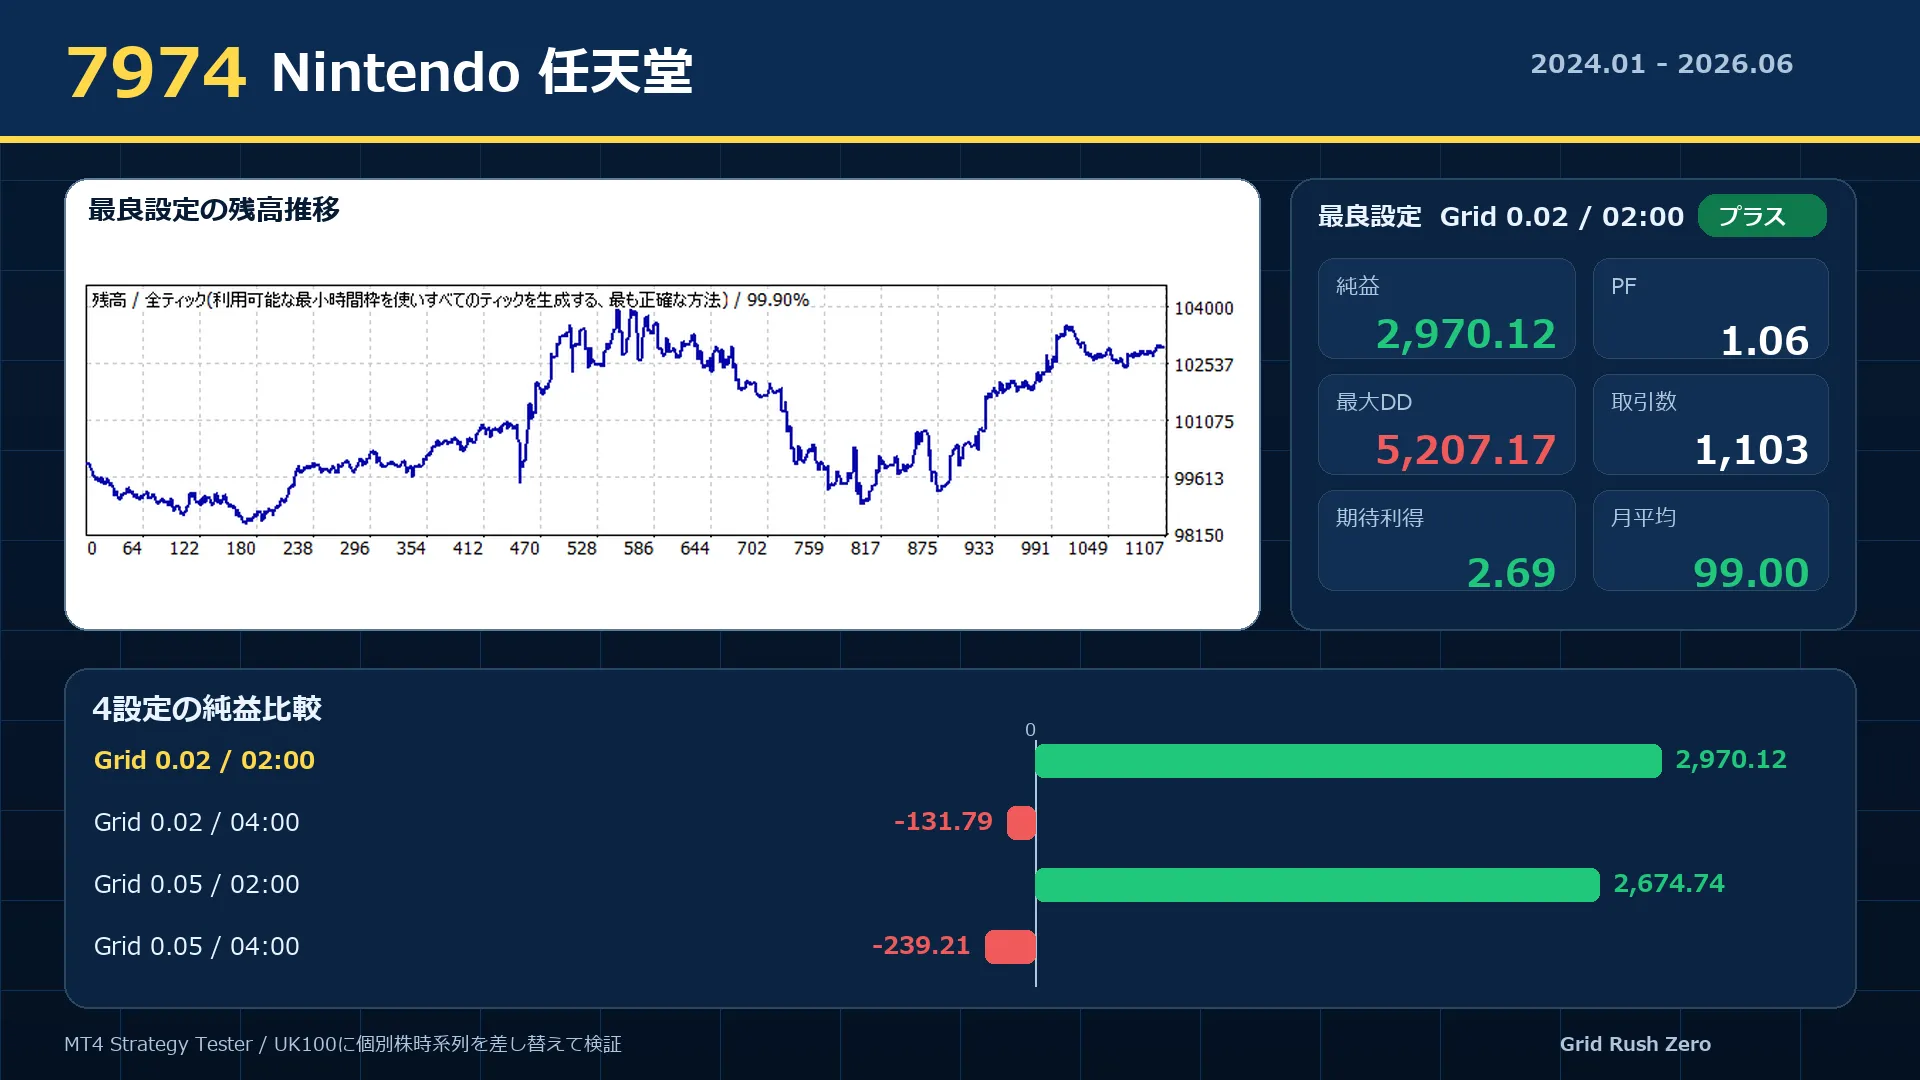
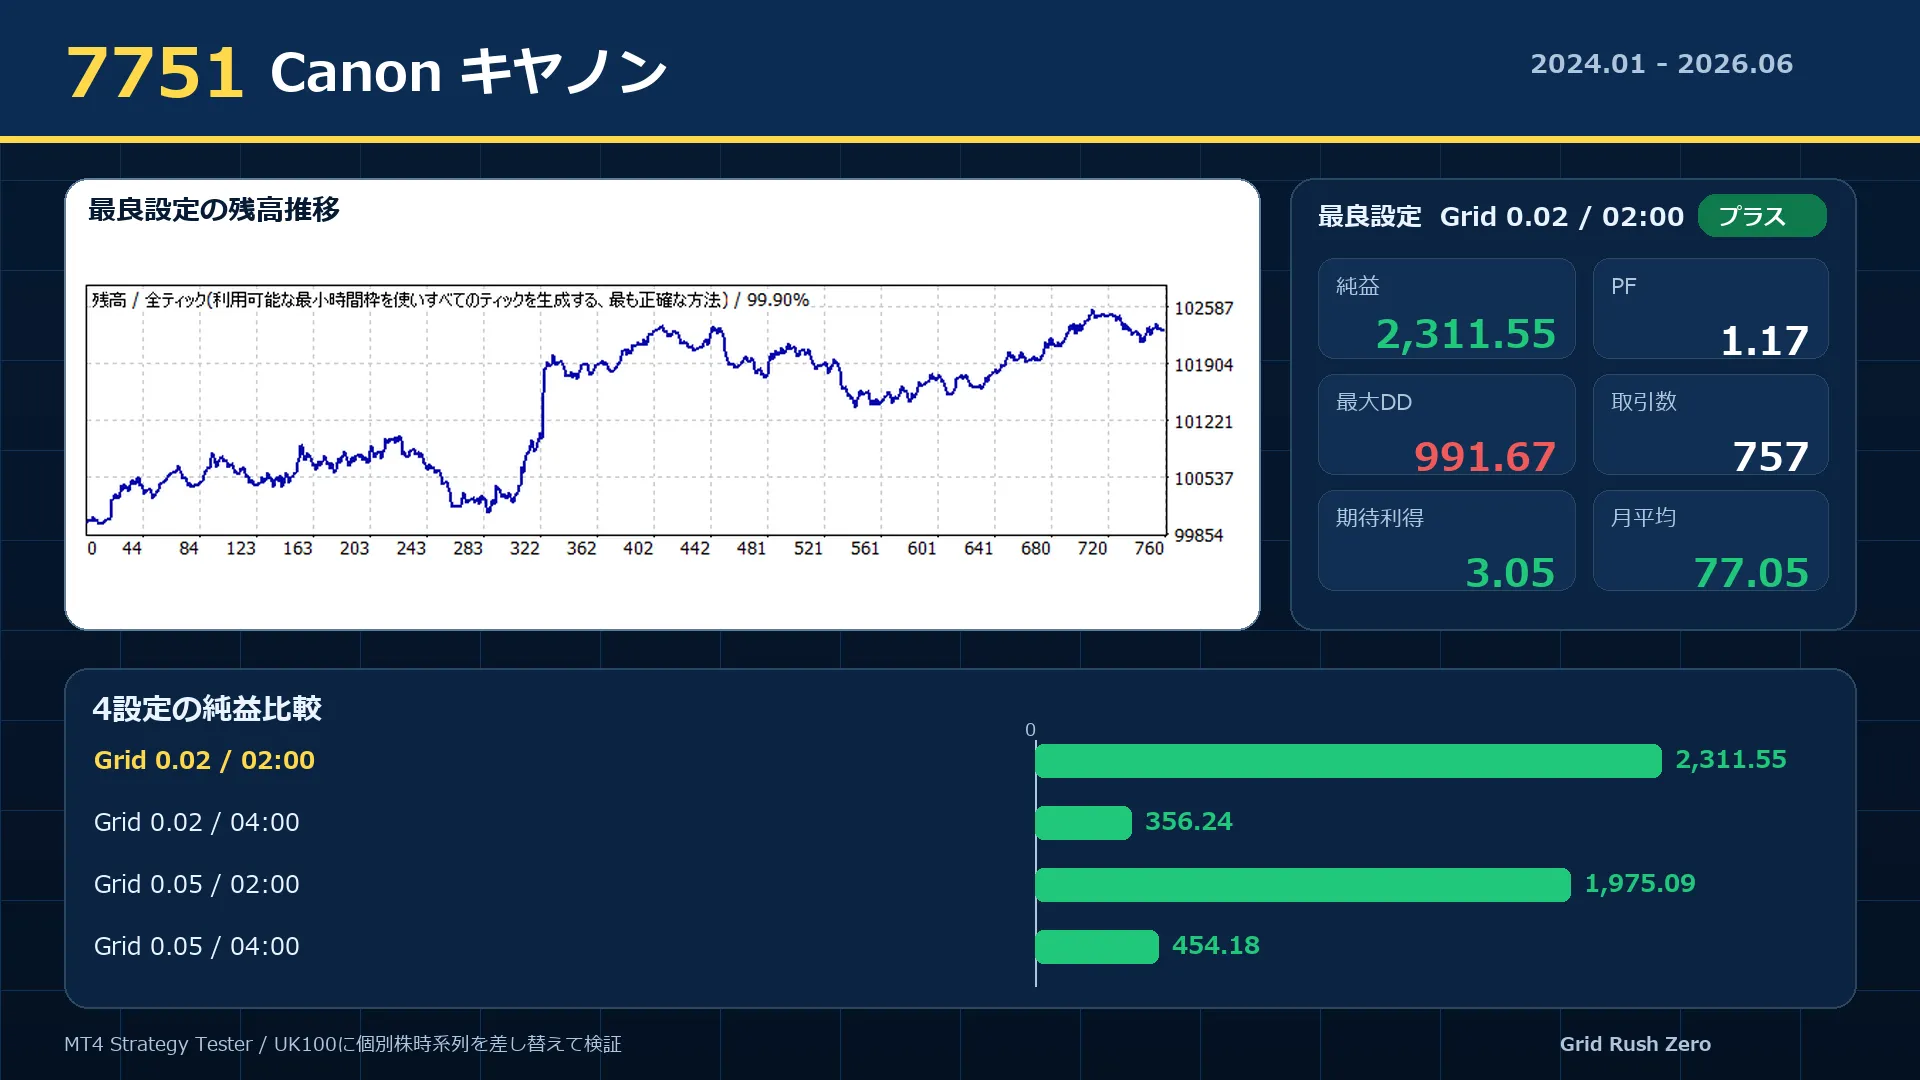
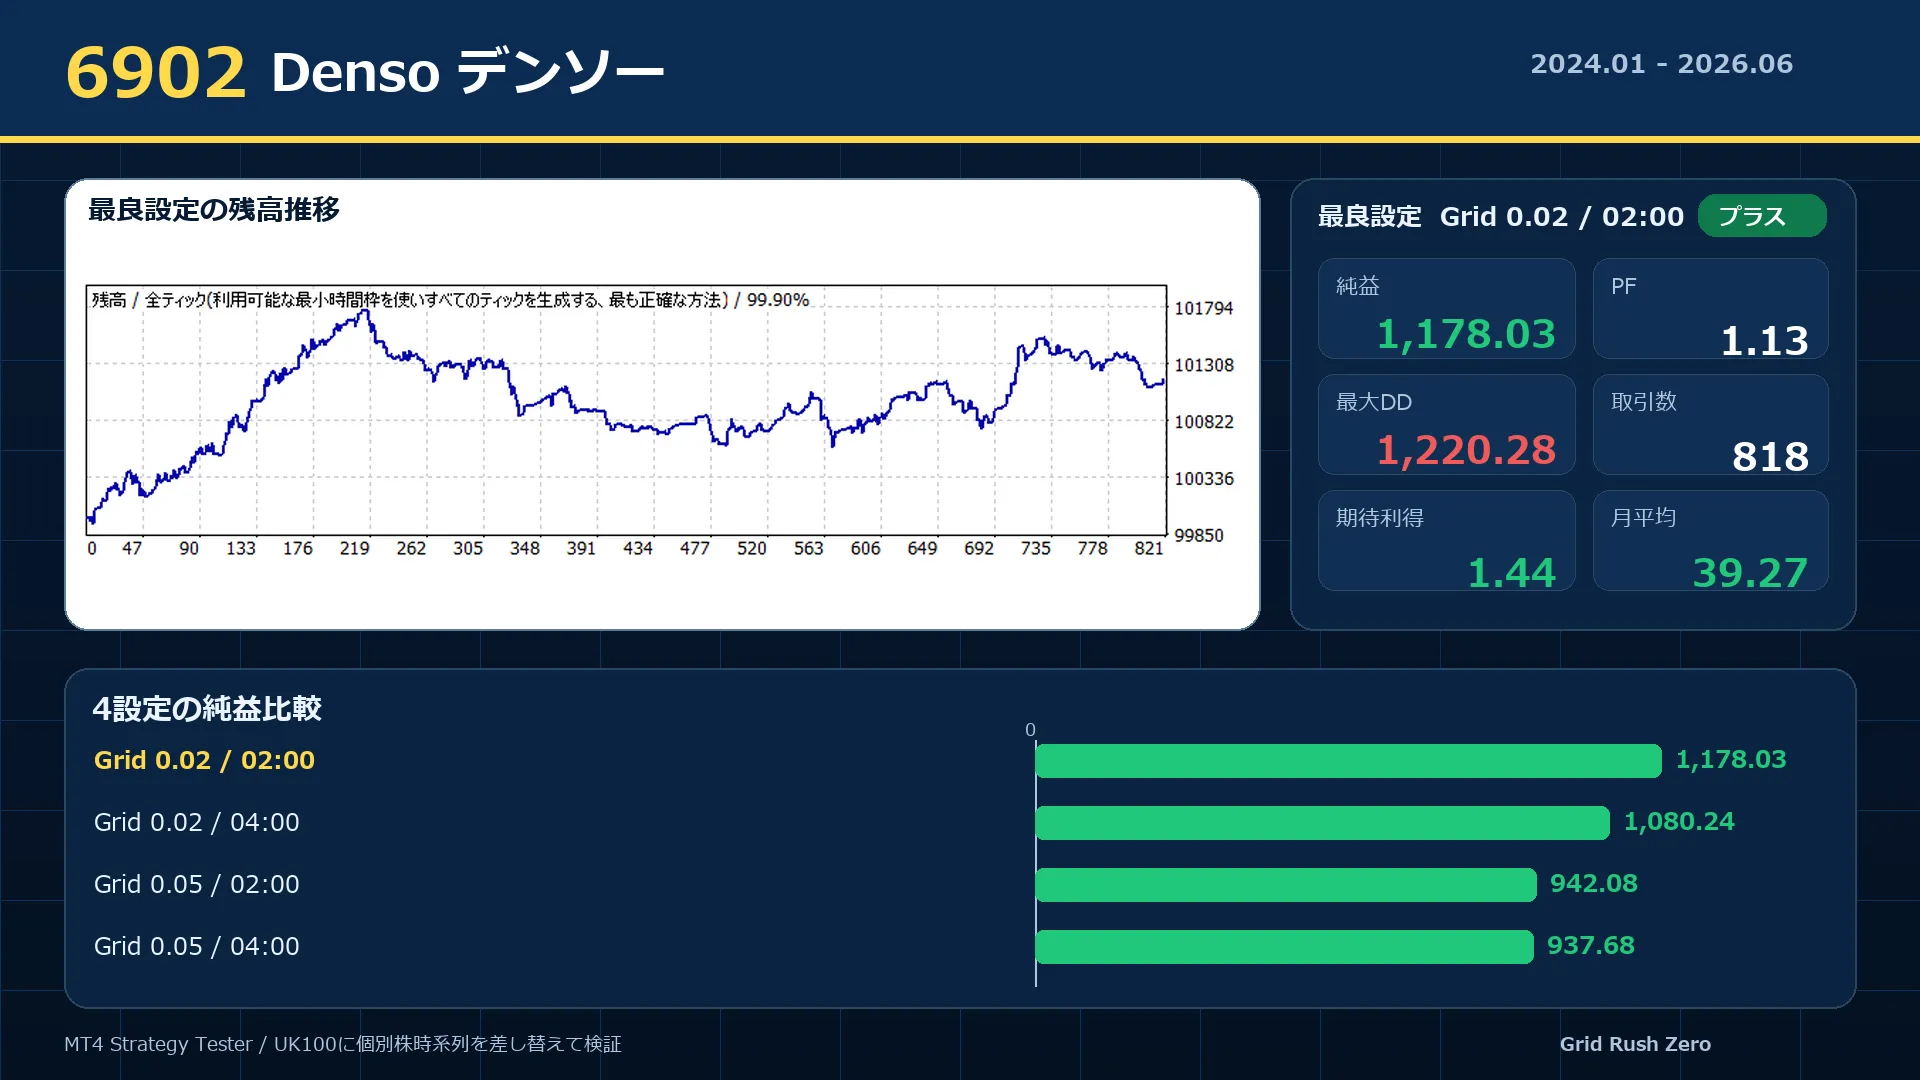
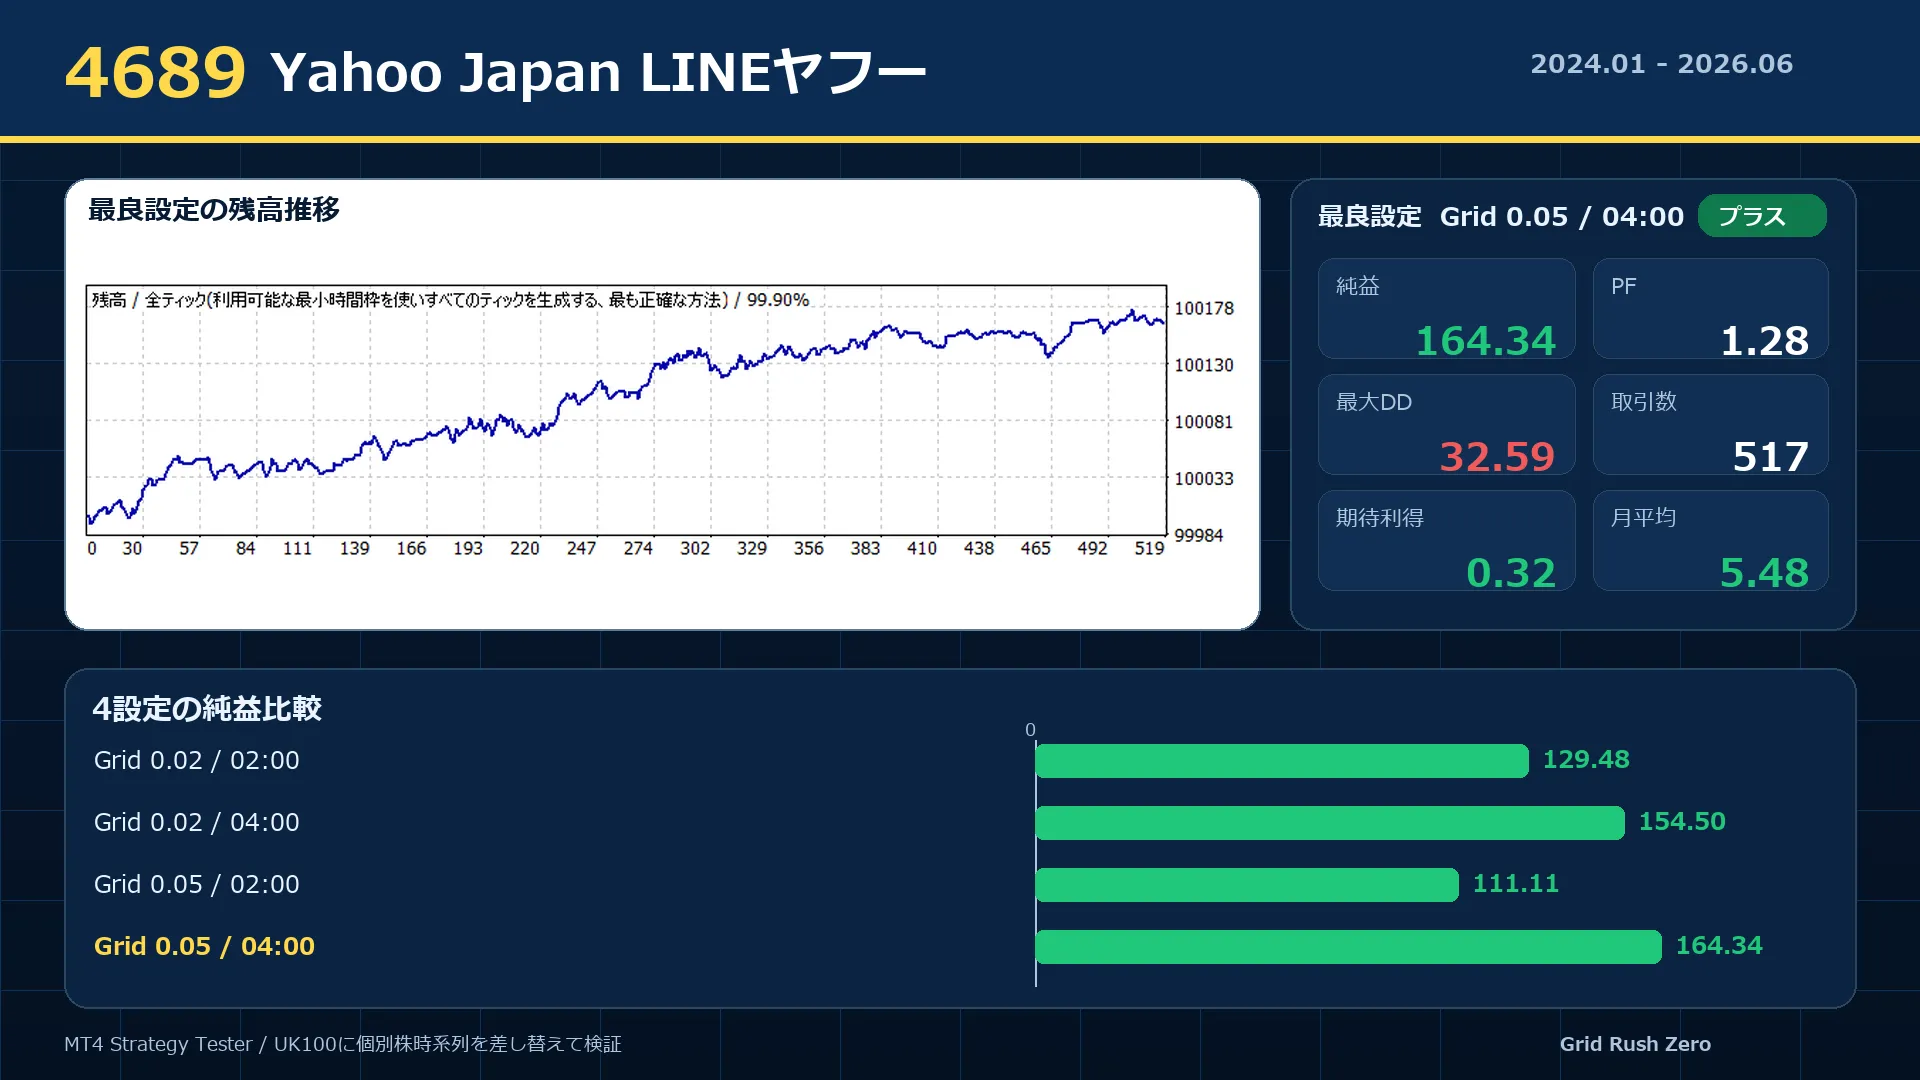
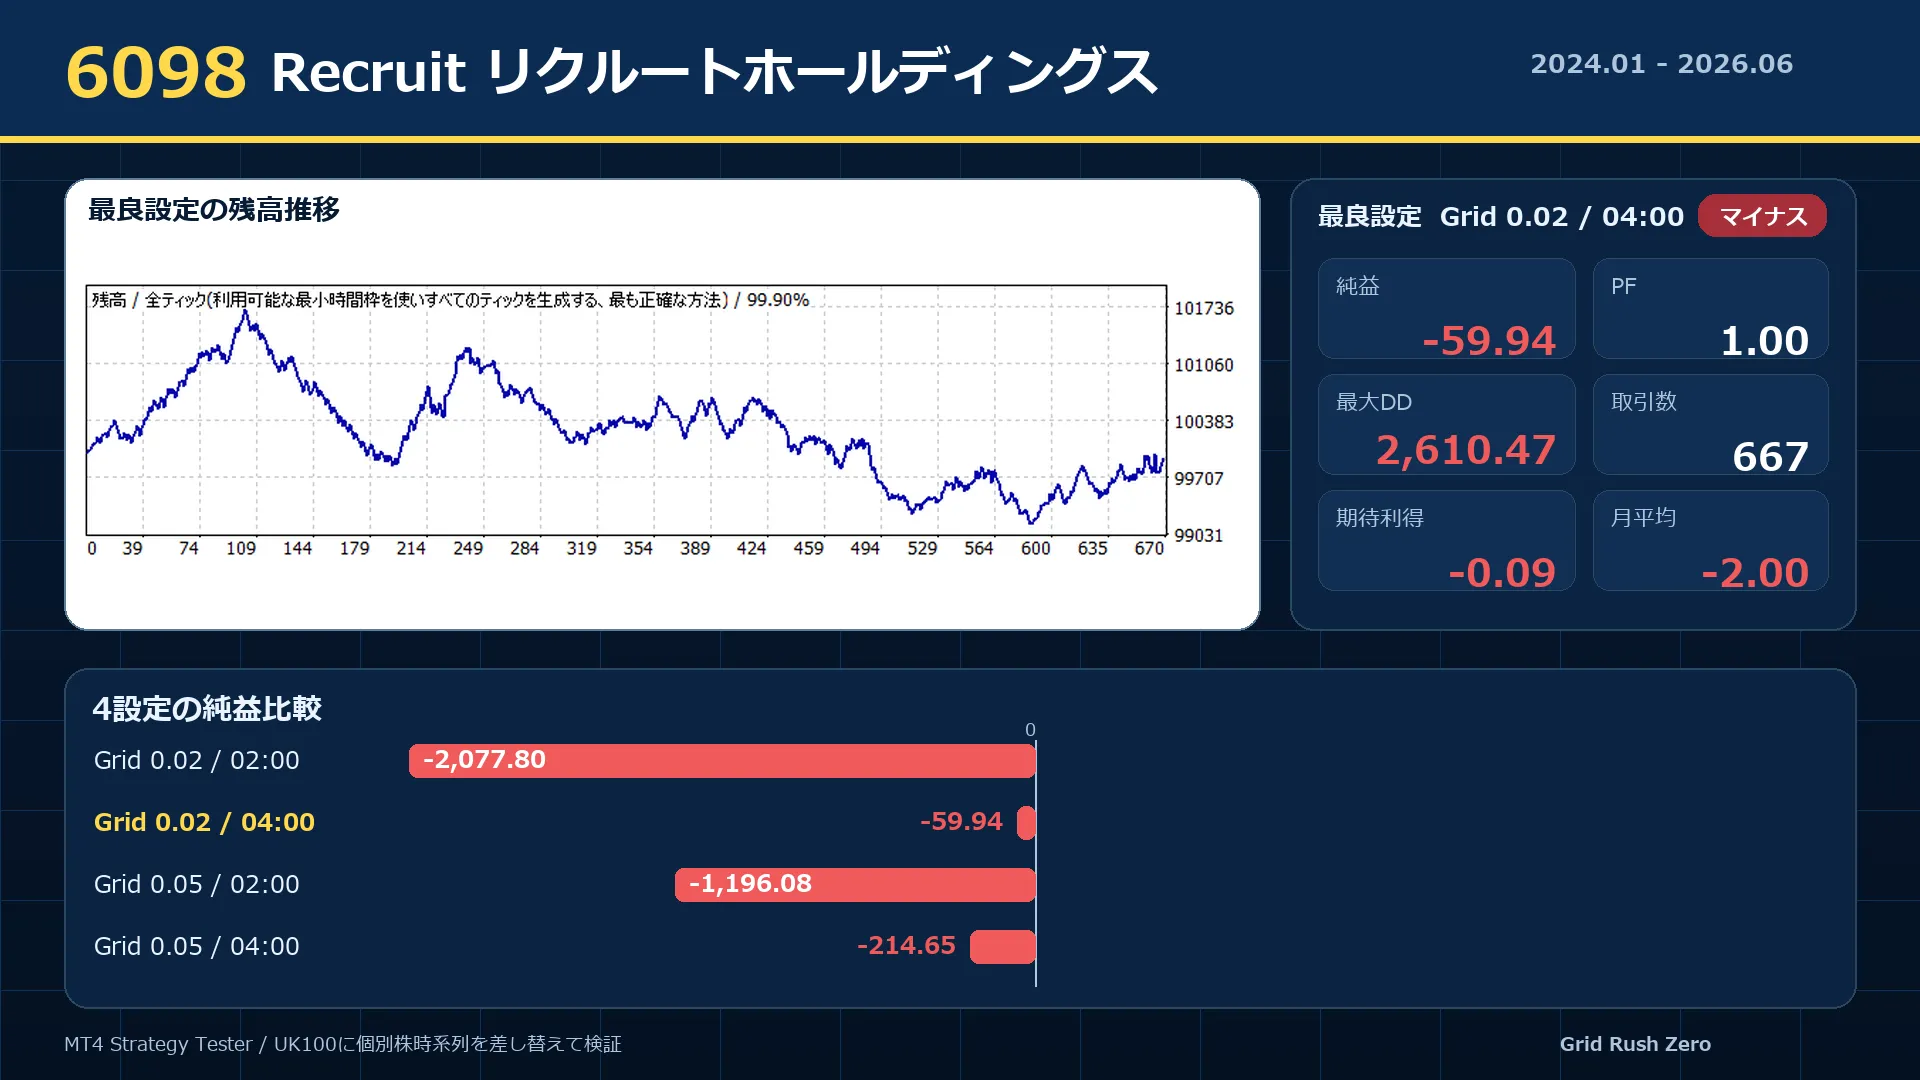
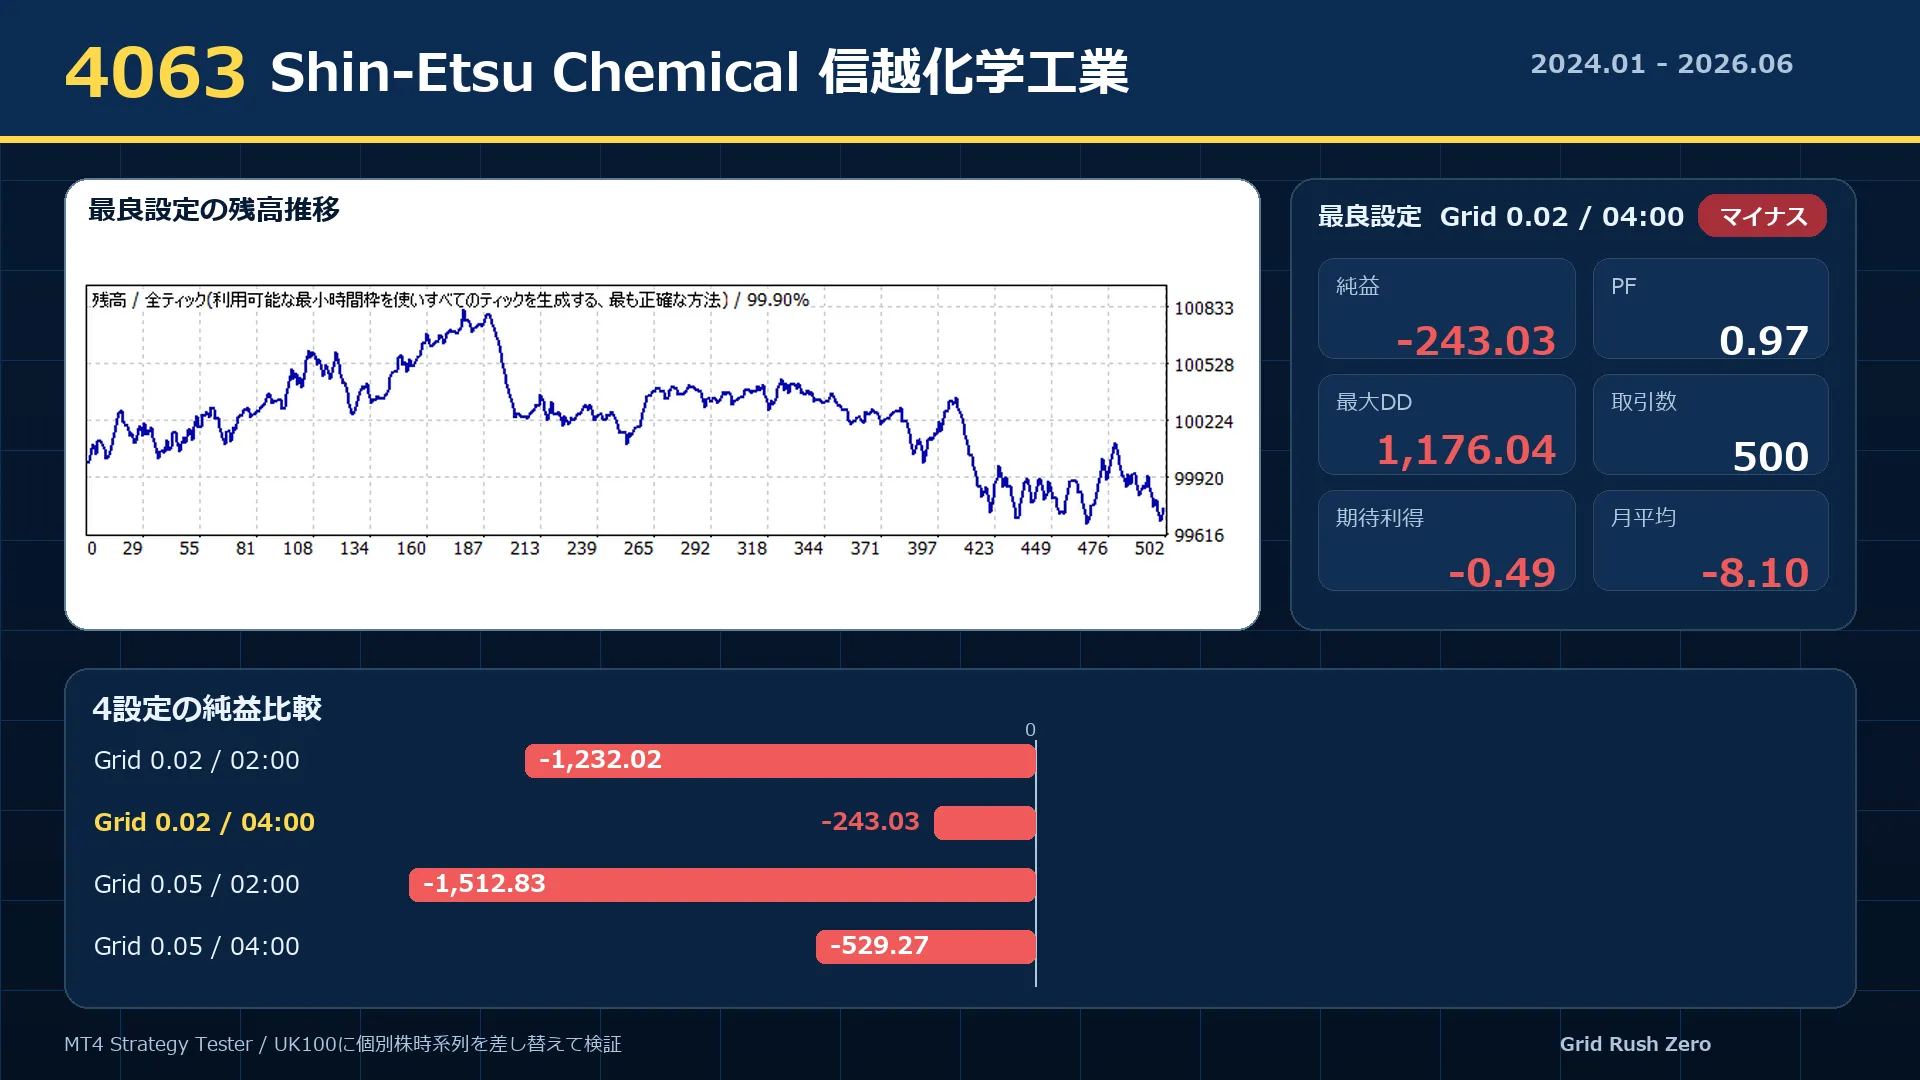
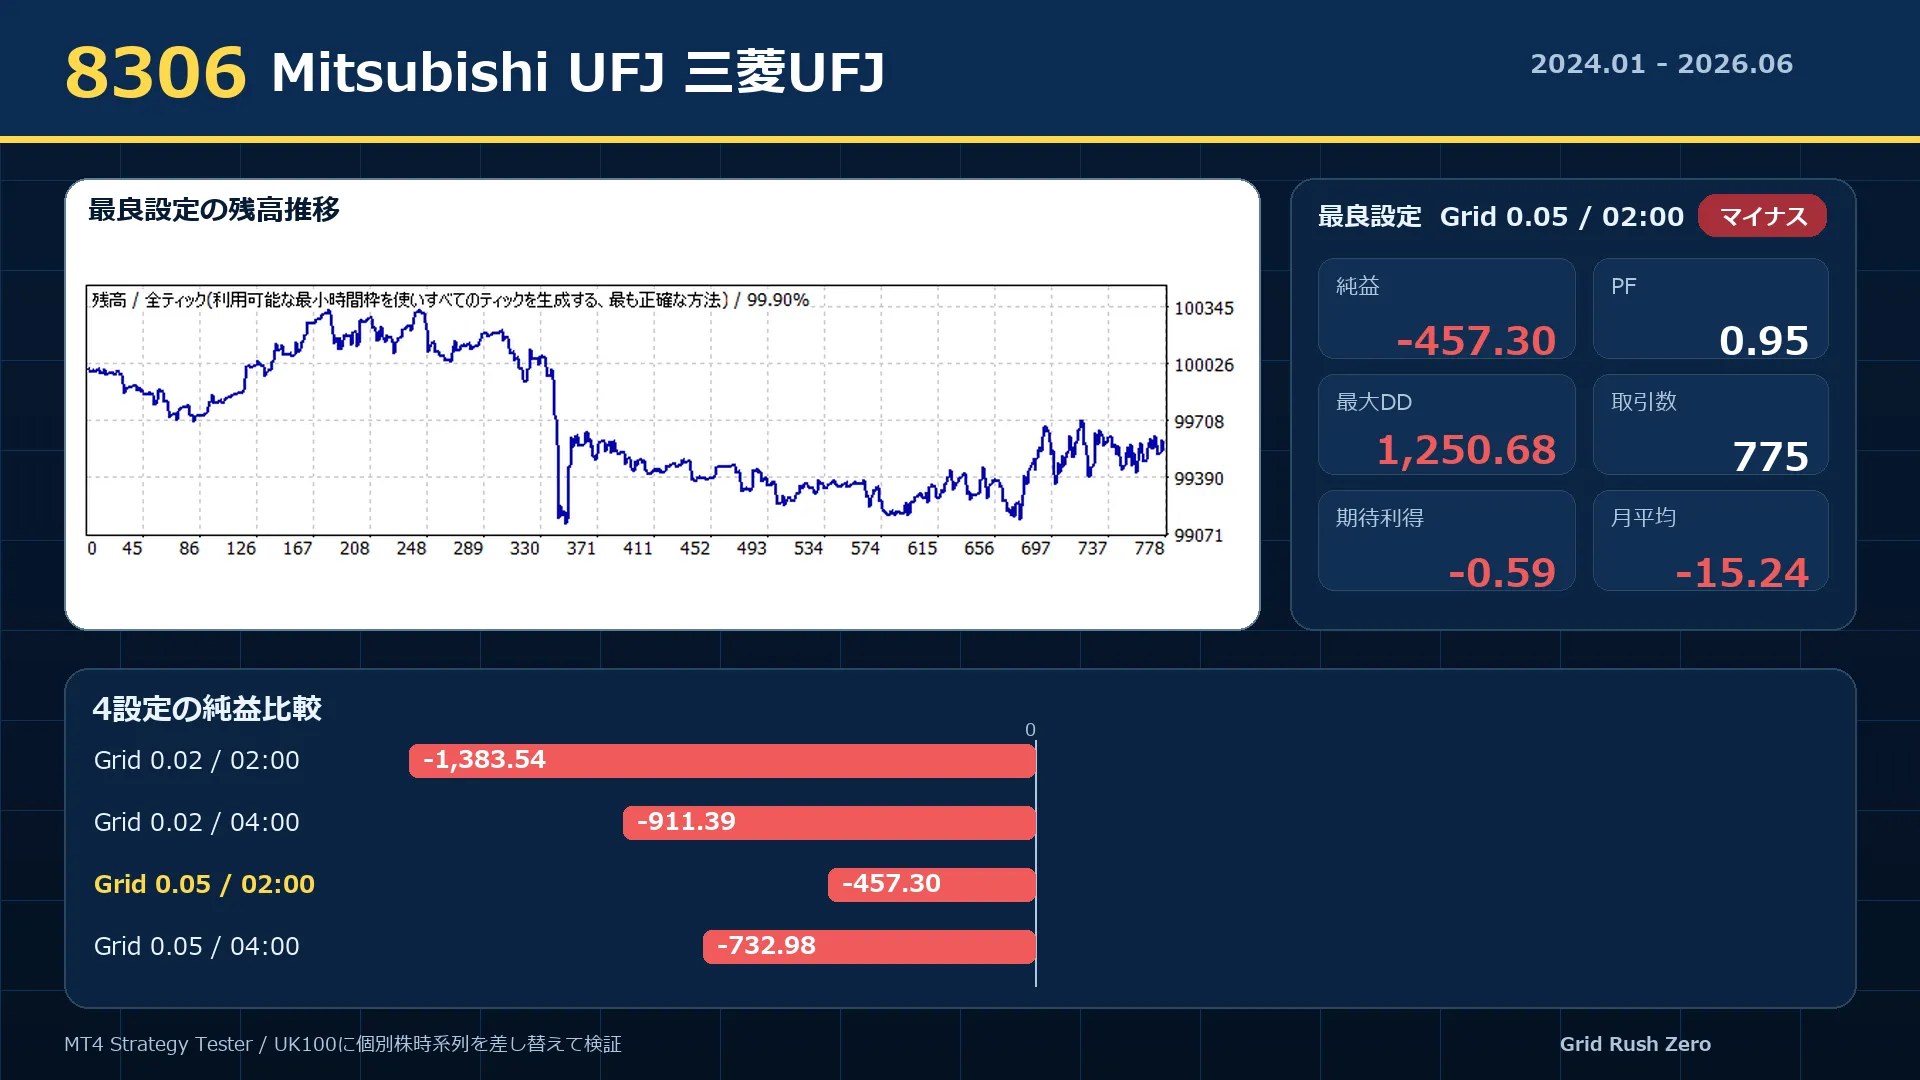
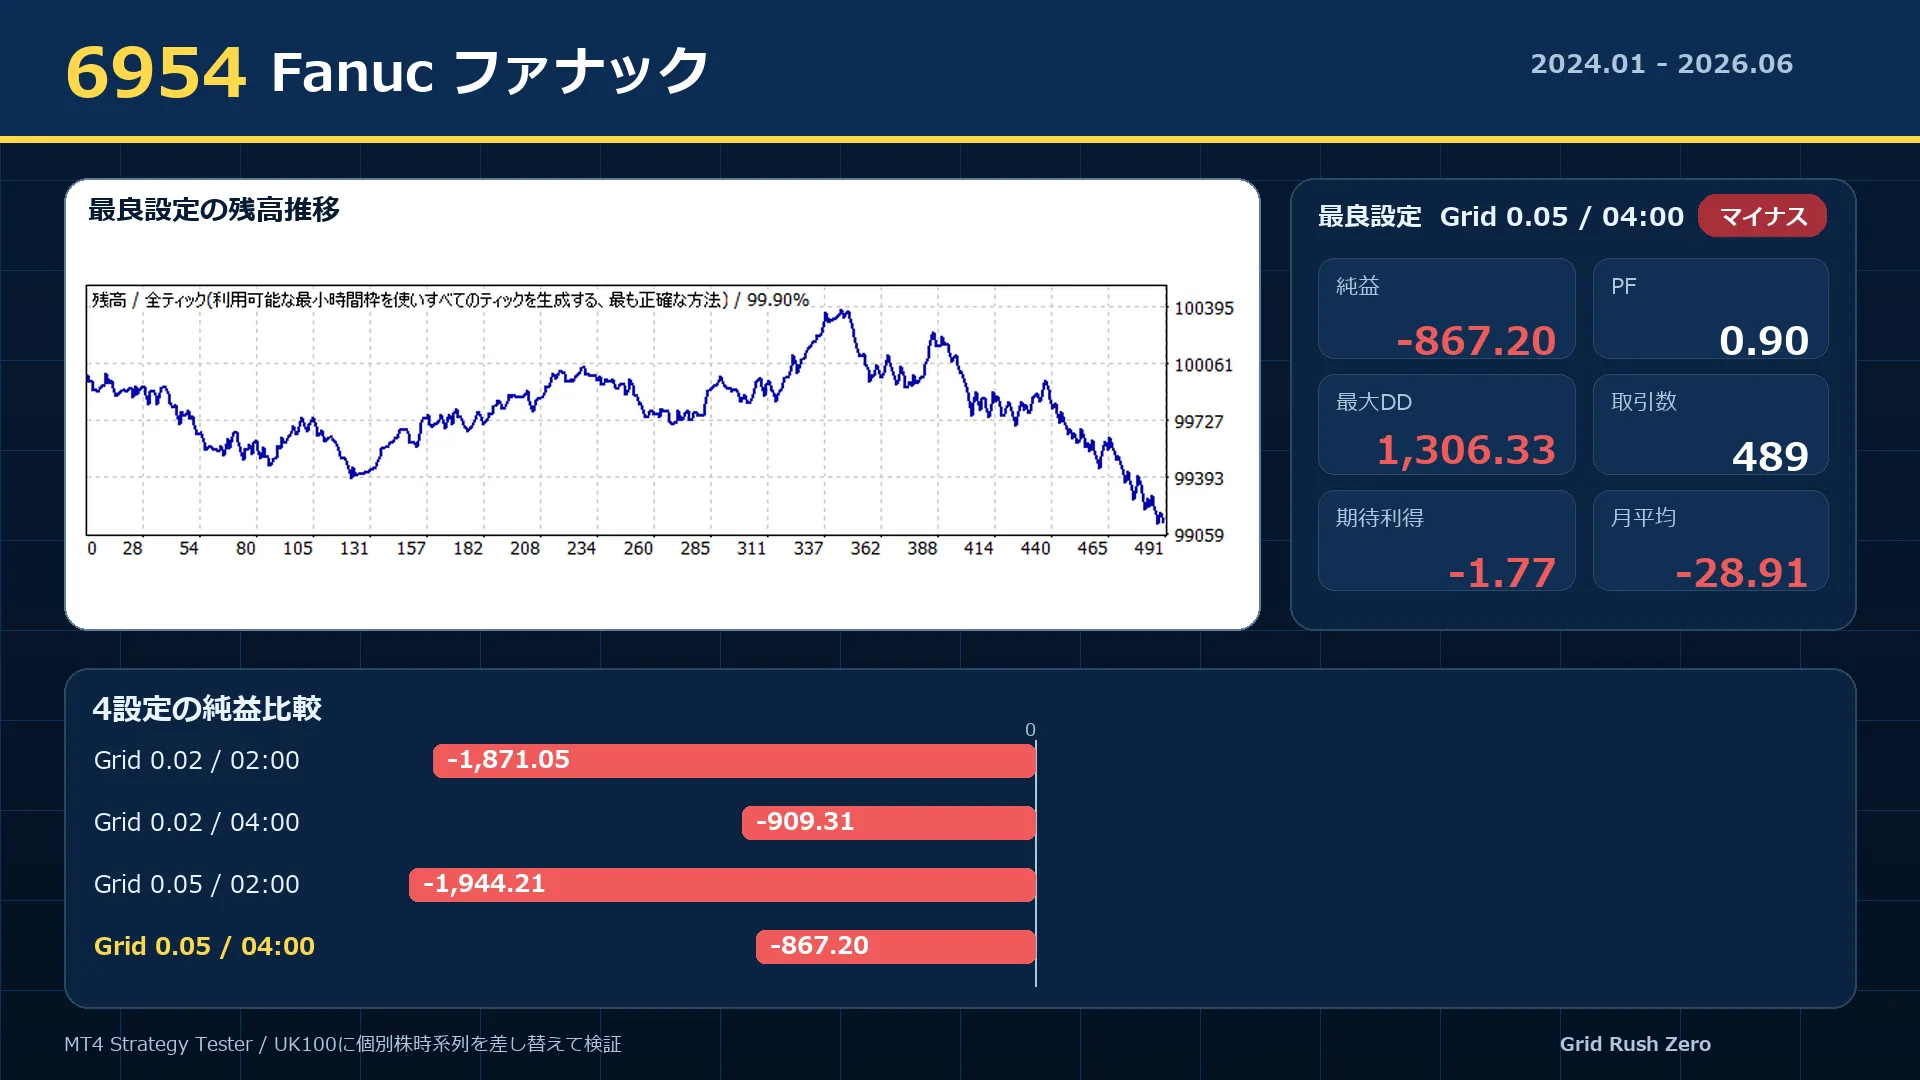
Stocks with relatively stable price movements showed easier capture of rebounds after declines or drops after spikes, where contrarian logic functioned.
On the other hand, for stocks that maintained a unidirectional move or days with strong open-to-close trends, contrarian strategies did not perform well.
Nevertheless, overall it seemed there was a certain level of significance for Japanese stocks as well.
Depending on conditions, win rates around 60% were observed, and cases exceeding 60% were confirmed.
The contrarian concepts developed for FX—prices moving back after short-term overshoot, and rebounds after oversold conditions—also appear to be present in Japanese stocks.
However, based on these results alone, it would be premature to assume that 60% win rate guarantees profitability in actual trading.
Why 60% win rate does not guarantee safety
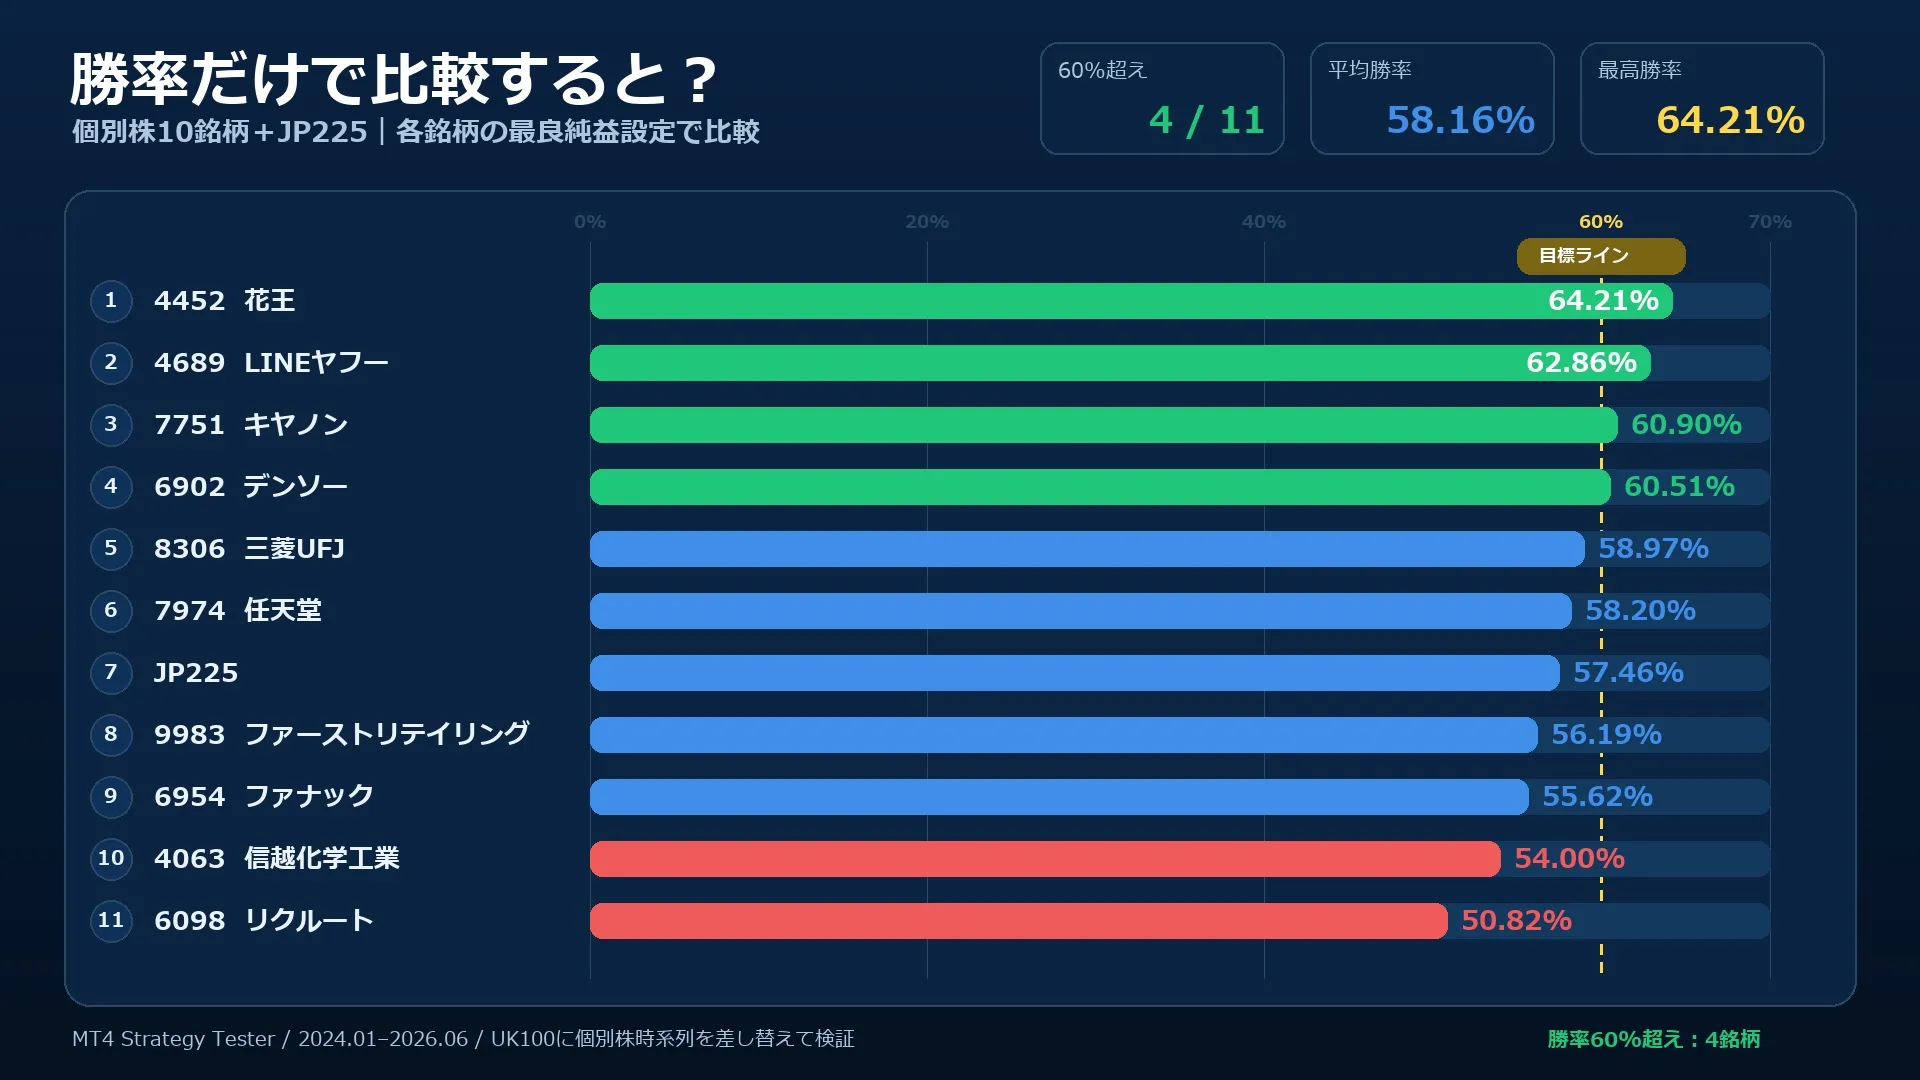
For example, if you win 6 out of 10 trades, your win rate is 60%.
But if you make 1,000 yen profit on wins and incur 3,000 yen losses on losses, the overall result is negative.
Conversely, even with a win rate of only 40%, if the profits on winning trades exceed the losses on losing trades, the overall result can be positive.
This is especially important for contrarian EAs.
Winners accumulate small profits, but a strong trend can cause large losses.
If using pyramiding or grids, this risk is amplified.
If the market fails to rebound, the number of positions and unrealized losses can grow.
I have tested contrarian and grid-based EAs many times in the past.
Initially they produced stable profits, but as soon as lot sizes were increased, large trends caused reversals that wiped out most of the accumulated gains.
Therefore, when evaluating contrarian methods, it is important to consider not only win rate but also drawdown mitigation strategies.
The current results do not fully reflect spreads
Another important caveat of this backtest is that it does not fully reflect spreads and slippage that occur in real trading.
In the backtest, costs from trades are almost zero due to a zero-spread assumption.
But in actual trading, there is a gap between bid and ask prices.
This gap can significantly affect results for scalping strategies with small profit targets.
Even if per-trade costs are small, a high number of trades can accumulate into a non-negligible amount.
Thus, the profits and win rates observed here indicate a potential of the logic, but do not guarantee actual profitability as-is.
When applying in real trading, you need to choose a broker with low commissions and re-test including spreads and slippage.
What to do if you actually use this with Japanese stocks
In this study we used Japanese stock CFDs, but if you actually trade Japanese stocks, you can use spot stocks or margin trading.
Using brokers like Rakuten Securities or SBI Securities, which offer low trading fees for domestic stocks, can help reduce costs.
However, even with low fees, costs are not eliminated entirely.
There will still be differences between buy and sell prices and price slippage due to order book depth.
Additionally, with short selling in margin trading, you must consider borrow costs and interest on margin trading.
It’s better to avoid contrarian trading on earnings days
When trading individual stocks contrarian, one needs to be especially careful on earnings announcements.
If earnings significantly exceed or miss market expectations, the next day's stock price can gap up or down markedly at the open.
Subsequent one-direction moves can occur, making standard contrarian logic fail to work.
Just as FX EAs are paused around employment or CPI releases, in Japanese stocks it is safer to avoid trading around earnings and major company announcements.
From my experience, contrarian EAs can be stable in normal markets but incur unexpected losses in sudden market moves.
EA automated trading is not a 24/7 glorified system that can be left running unattended.
Operate only during relatively calm times and stop on days when sudden shifts are expected. This kind of operational management is necessary.
In Japanese stocks, you should also watch for earnings dates, business results revisions, share buybacks, capital increases, M&A, and scandals.
RSI and Bollinger Bands can also be used to create contrarian methods
For trading individual stocks, recreating the exact same environment as the EA used in this study can be challenging.
So a simpler approach is to start with contrarian methods using RSI or Bollinger Bands.
For example, you can sell when RSI falls below 30, and buy when RSI rises above 30 again.
Conversely, sell when RSI rises above 70 and then falls back below 70.
However, RSI alone can give overbought/oversold signals even in strong trends.
Therefore, combine RSI with Bollinger Bands.
One approach is to buy when price falls below the Bollinger Band minus 2 standard deviations and RSI is 30 or lower, and then price returns inside the band.
The opposite is true for selling.
Even then, strong trends can cause contrarian strategies to fail.
Using moving average slope and ADX to avoid trading when the market trend is too strong can reduce forced entries.
However, adding too many conditions can cause the logic to fit only past markets.
Rather than building a complex system from the start, it is more important to validate simple conditions across multiple stocks and see where the method fails.
The most important thing when using contrarian methods
What matters most in contrarian methods is not only where you enter, but when you decide to give up.
Waiting for the price to revert alone cannot manage losses.
You need to decide the maximum number of additional entries, the price level at which to cut losses, and how much you are willing to lose per day before stopping trading.
Summary
In this study, I backtested FX-constructed contrarian methods on 10 Japanese stocks and the Nikkei 225 CFD.
The results show a certain significance of contrarian logic in Japanese stocks as well.
Under certain conditions, win rates around 60% were observed, with cases exceeding 60% also confirmed.
Thus, applying FX contrarian concepts to Japanese stocks is feasible in principle.
However, these results alone do not guarantee the same profitability in actual trading.
The verification period was about two and a half years, and spreads and slippage could not be fully reflected.
Also, individual stocks can move sharply in one direction due to earnings and company news.
Contrarian strategies tend to be strong in range-bound markets but weak in strong trends.
Rather than focusing only on win rate, you should also examine the potential loss in losing trades and the maximum drawdown.
If you’re going to experiment yourself, start by building a simple logic using RSI or Bollinger Bands and validate it against historical data.
Supervisor/Author: Masayan
This article presents backtest results and development experience and does not recommend buying or selling specific stocks or financial products. Please conduct actual trading at your own discretion and responsibility.
━━━━━━━━━━━━━━━━━━
Grid Rush Series
━━━━━━━━━━━━━━━━━━
MT5 Signaling Indicator
Volatility Rush Indicator
https://www.gogojungle.co.jp/tools/indicators/80364
MT4 Signaling Indicator
Grid Rash_Arrow_Indicator
https://www.gogojungle.co.jp/tools/indicators/55251
MT5 EA Auto-Trading
Grid Rush MT5
https://www.gogojungle.co.jp/systemtrade/fx/78797
MT4 EA Auto-Trading
Grid Rash EURUSD
https://www.gogojungle.co.jp/systemtrade/fx/55503