
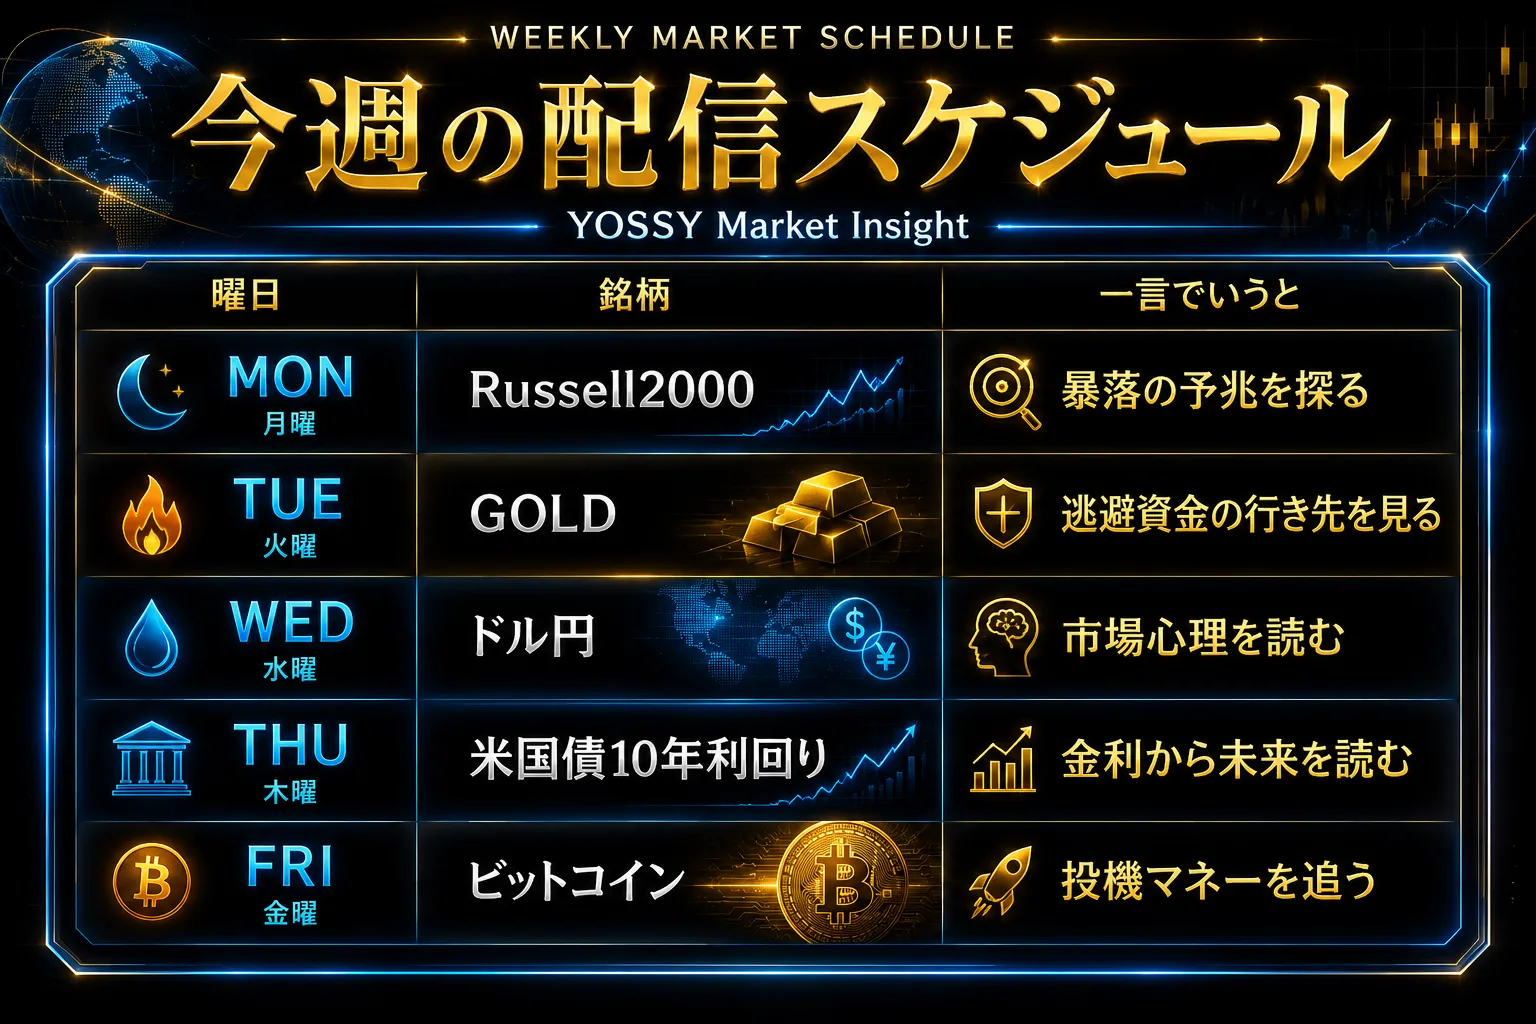
July 21 (Tue): 【BB&HM】 Nikkei 225 vs GOLD
【Announcement】
I will return to my parents' house from Tuesday until the end of July.
Therefore, there may be delays in newsletter posting times and replying to inquiries, so please understand.
This time
is typically described as having an inverse correlation with stock prices
『GOLD』
comparison will be made with it.
【Overall Scenario Probability】
This week's overall market is…
“Up: 40% / Down: 60%”
※Because the upward MA break of the NY Dow, the breakdown of the NASDAQ triangle, and the widening -2σ push of the Russell 2000 combine into a large downward scenario due to harmonics, downside pressure is dominant
※Presented as a reference level.
【This Week's Market Key Points】
This week's market, toward the close of last week, has undergone significant changes in the market landscape across exchanges.
In the four major U.S. indices, the NY Dow rose but fell below its moving average, while the NASDAQ's triangle scenario collapsed, and overall downward pressure intensified rapidly, with Russell 2000, the proverbial “canary in the coal mine,” signaling new harmonics. This could trigger large moves in other stocks as well.
GOLD is also approaching important support levels from above, and the direction will be determined by which side it breaks, so great caution is needed for movements this week.
Details will be explained in the paid section.
➥The continuation is detailed in the members-only report.
If you are not registered yet, please click here ↓
【Integrated Version】
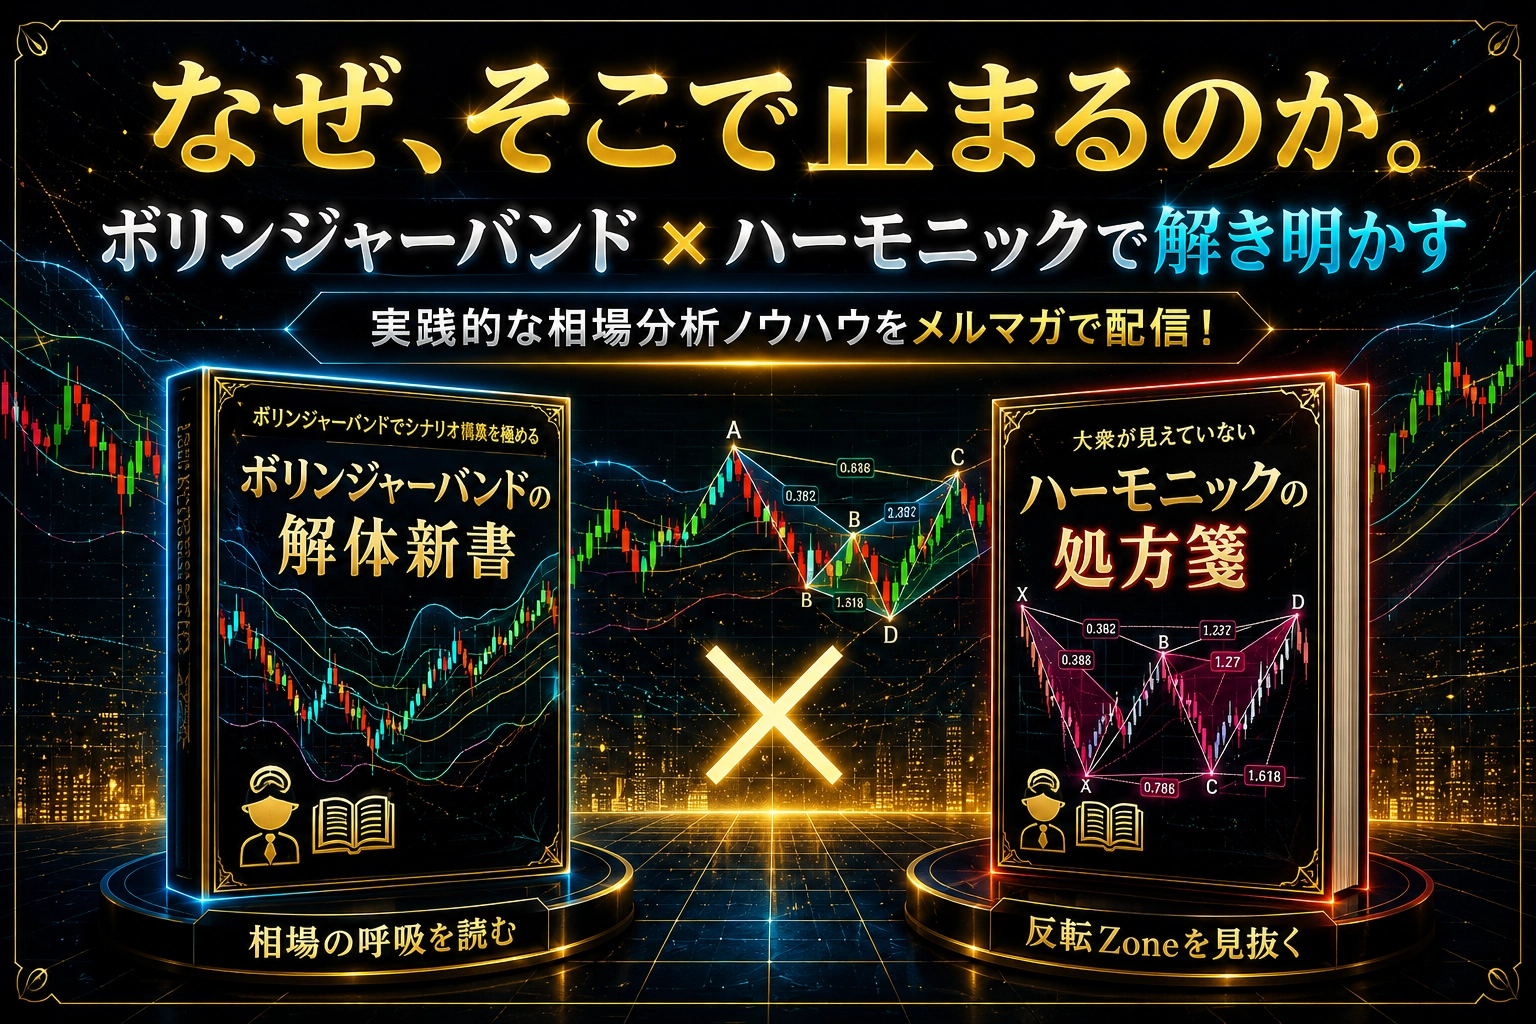
‘Why does the market stop there?’ Bollinger Bands × Harmonics: A fusion of statistics and geometry to capture turning points in the market with high precision!
https://www.gogojungle.co.jp/finance/navi/series/1613?via=articles_detail_aside
(*The following content is for members only.)
--------------------------------
【Environment Recognition】