

2026/7/18 Dollar/Yen, Gold, SP500, and Nikkei 225 Environment

By removing some features and prioritizing lightweight performance, the calculations have been simplified while remaining about 20% lighter than Trendline Pro 2.
It has been implemented to support signals that use scores, but since it displays on the future side, it will not appear in this image.
If you’re curious about what timing the signals are for, please check the videos below.
For behavioral verification, we prepare a weekly price movement video of USD/JPY.
USD/JPY
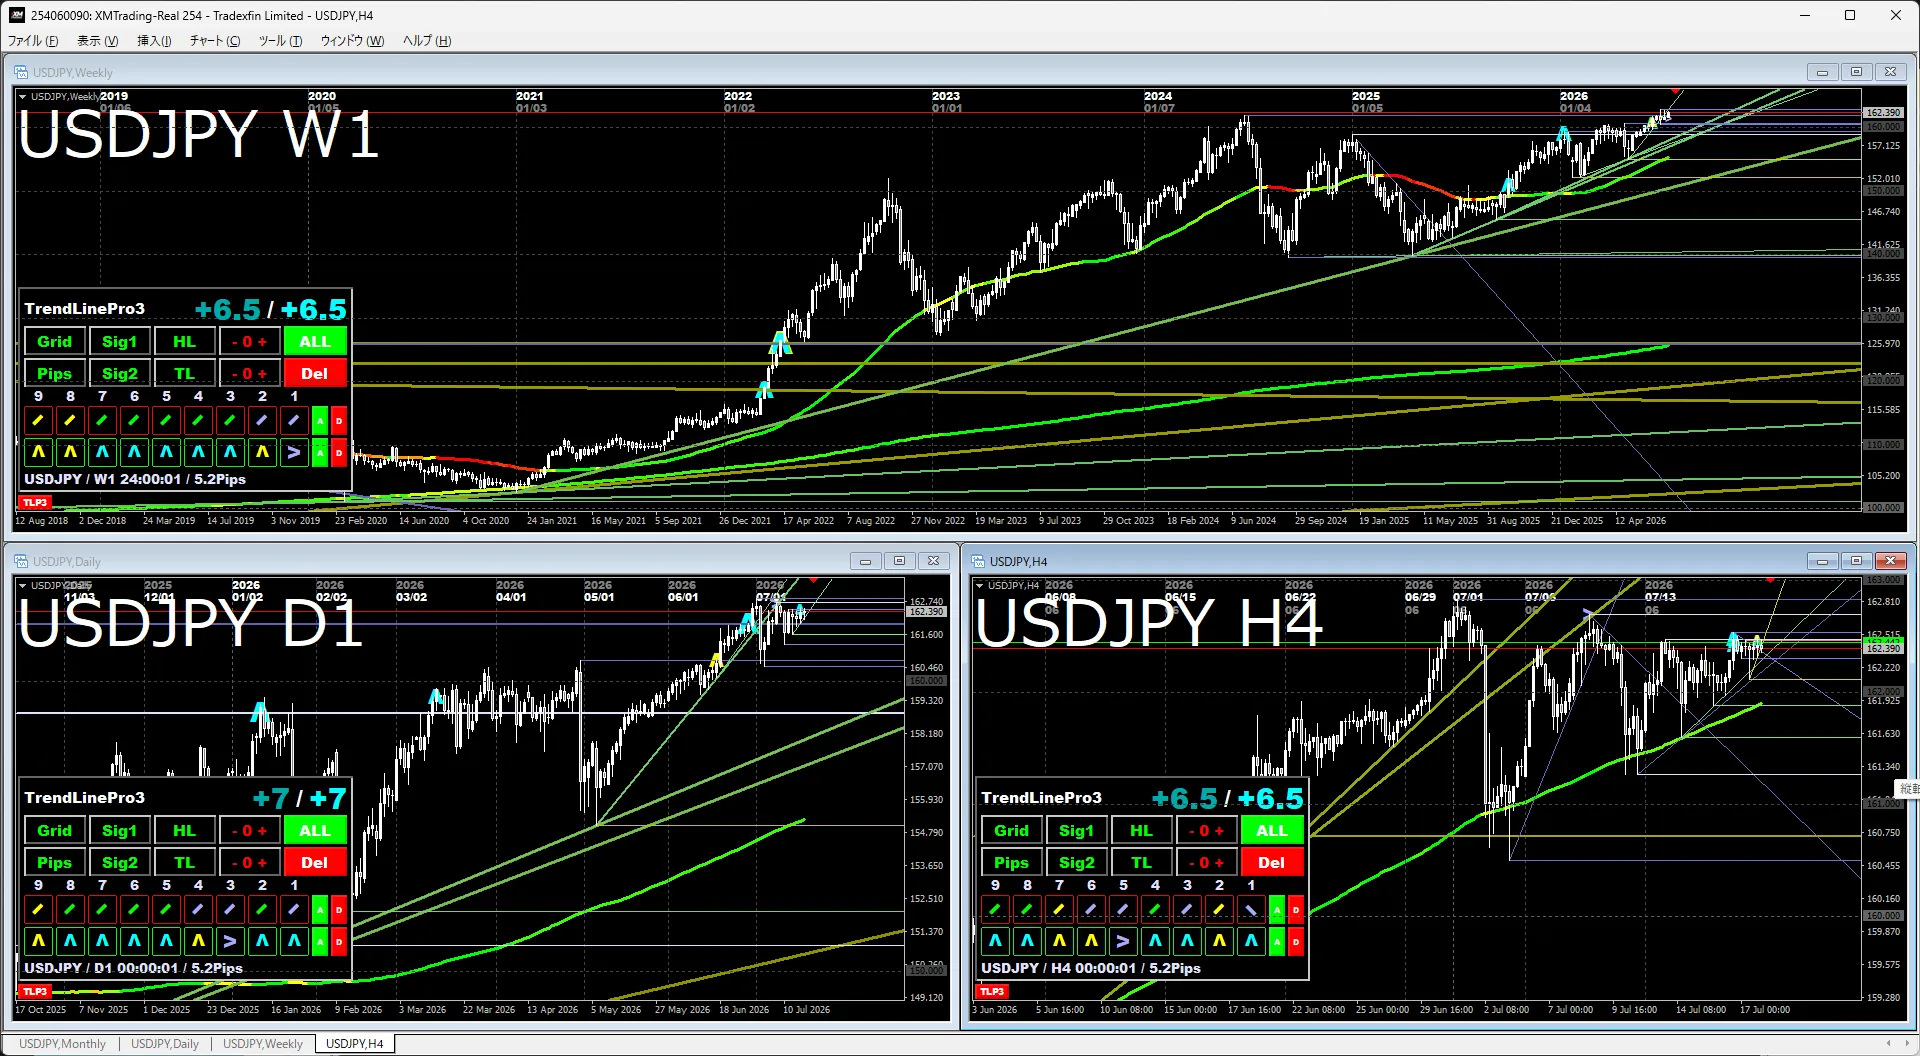
WeeklyThe trend is upward. The monthly high was updated, but on the weekly chart it’s a wick. Nevertheless, it has already broken upward, so the setup is there for further gains.
Daily / 4-hourIt appears to be supported by the 4-hour MA. The time frame correction is ample, so if it cannot reach a new high next week, there is a potential for a downturn, but personally I see the rise as strong.
Gold
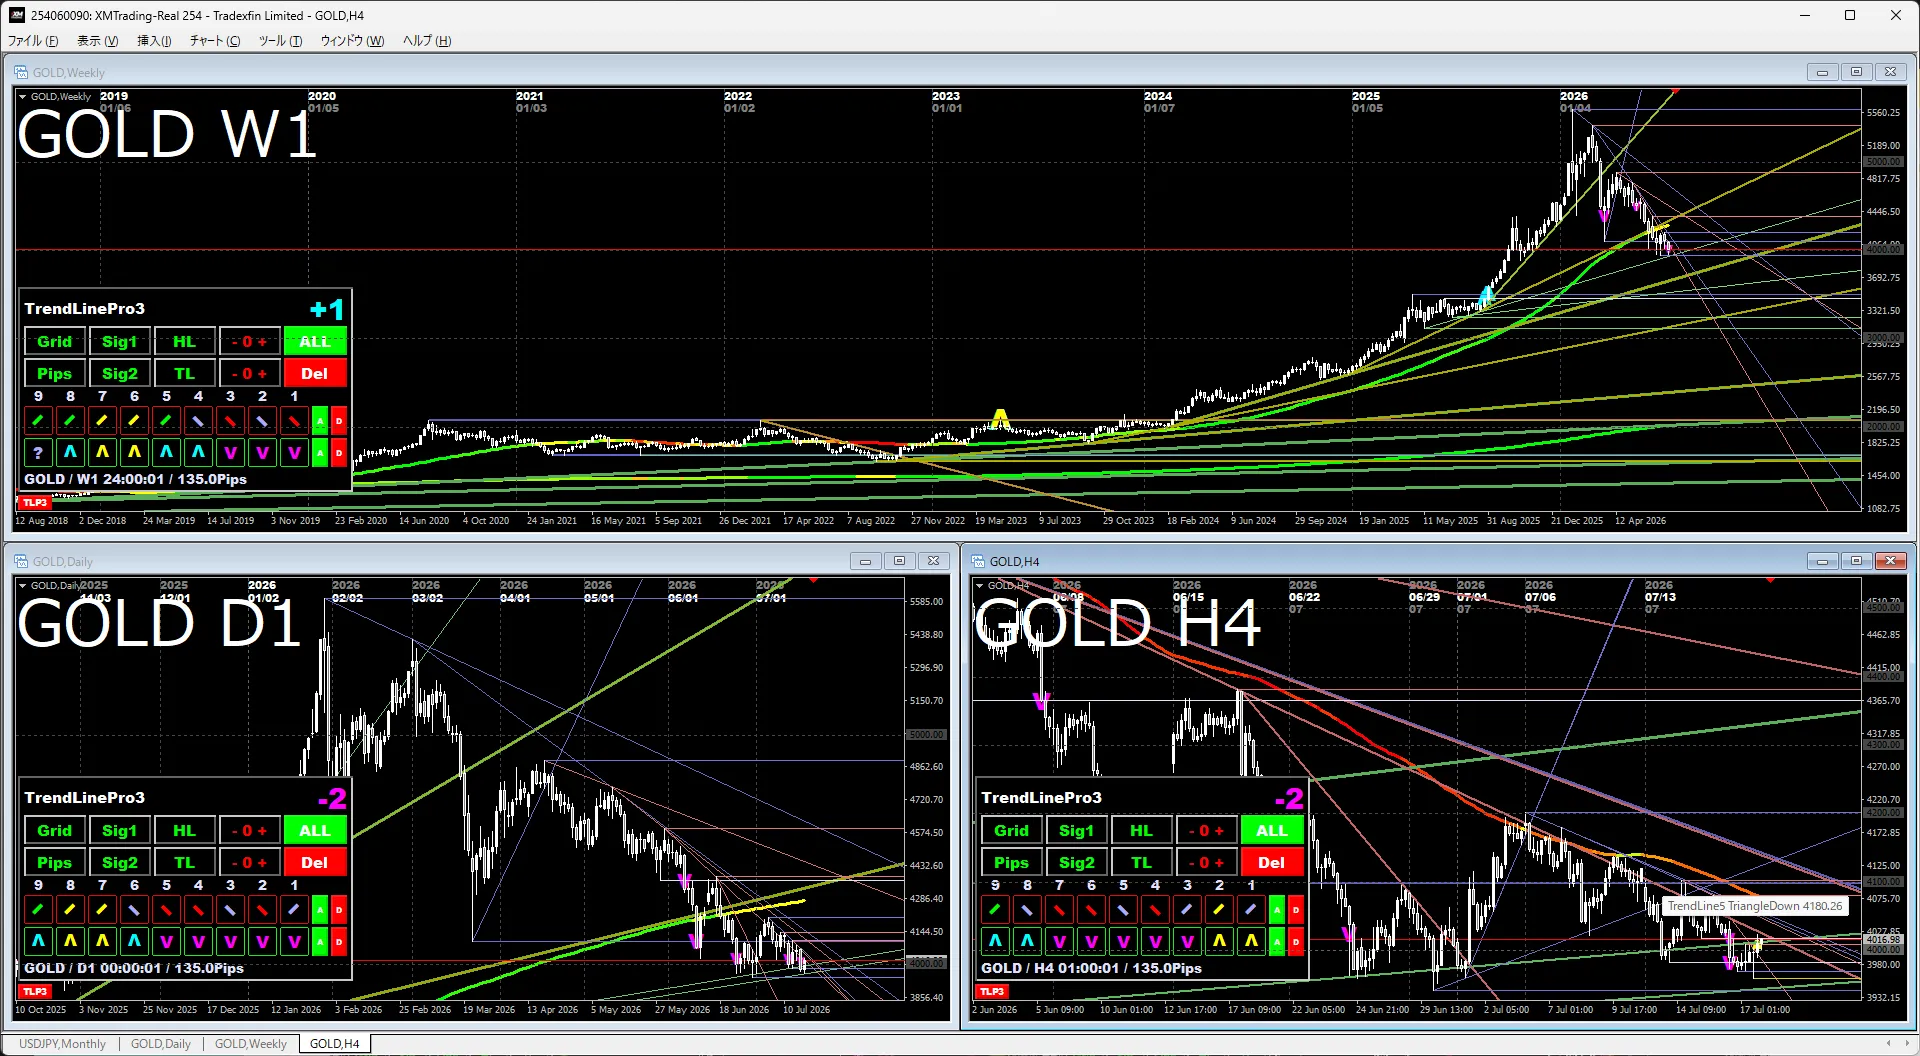
WeeklyWith the currency’s value decline in mind, gold is expected to rise in the long term. However, the overheated sentiment has faded, and a long-term adjustment may be underway. The score is weak and directionless. The green trendline might be in focus.
Daily / 4-hourWe are watching whether the daily green or red triangle will be broken. If it breaks upward, it could be a good dip-buying opportunity. If it breaks downward, around 3,500 could become a notable target. Personally, I’m starting to add to long positions from a longer-term perspective.
S&P 500
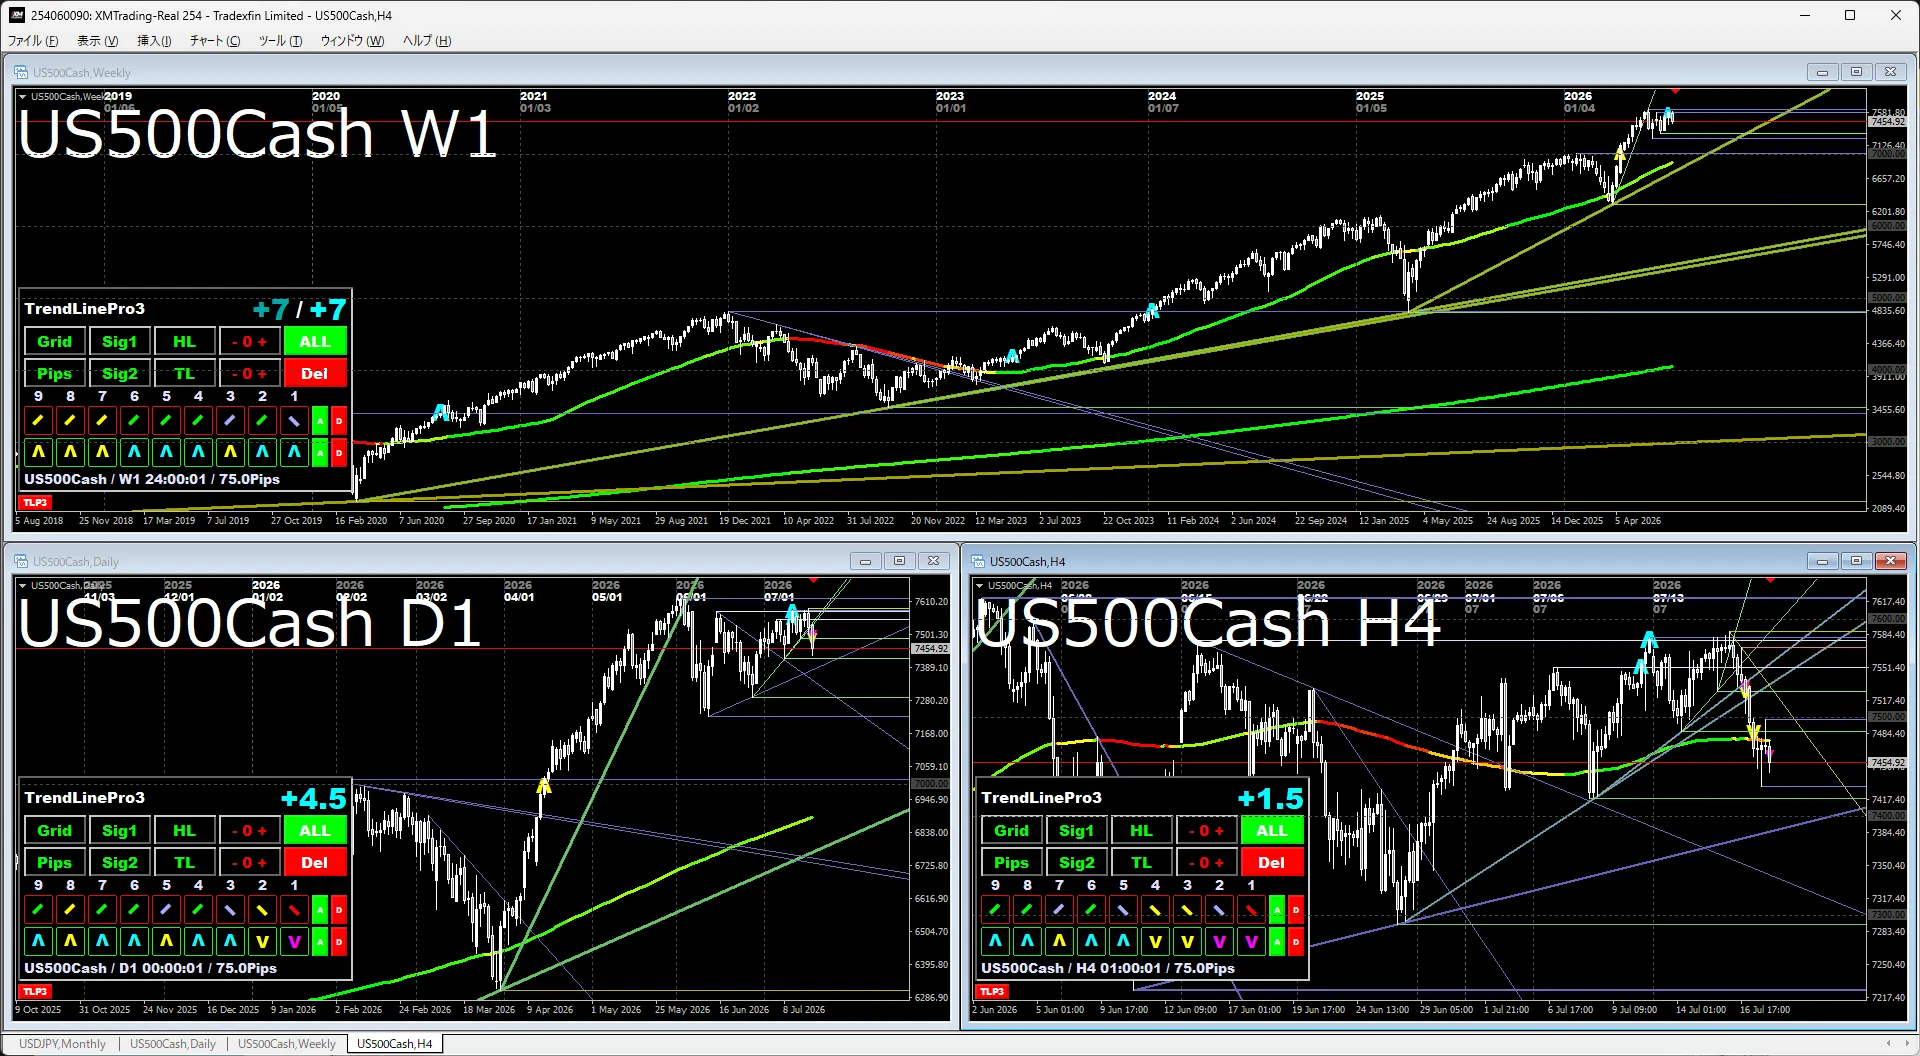
WeeklyIt has surpassed the recent high and its upward trend is confirmed. Culturally, buying tends to be easier.
Daily / 4-hourIt barely surpassed the recent high near 7,580, but has not even touched the latest high. It looks favorable for buying, but if it stays flat for longer, the outlook could turn to a downturn. Once a new high begins, around 8,500 becomes a notable level.
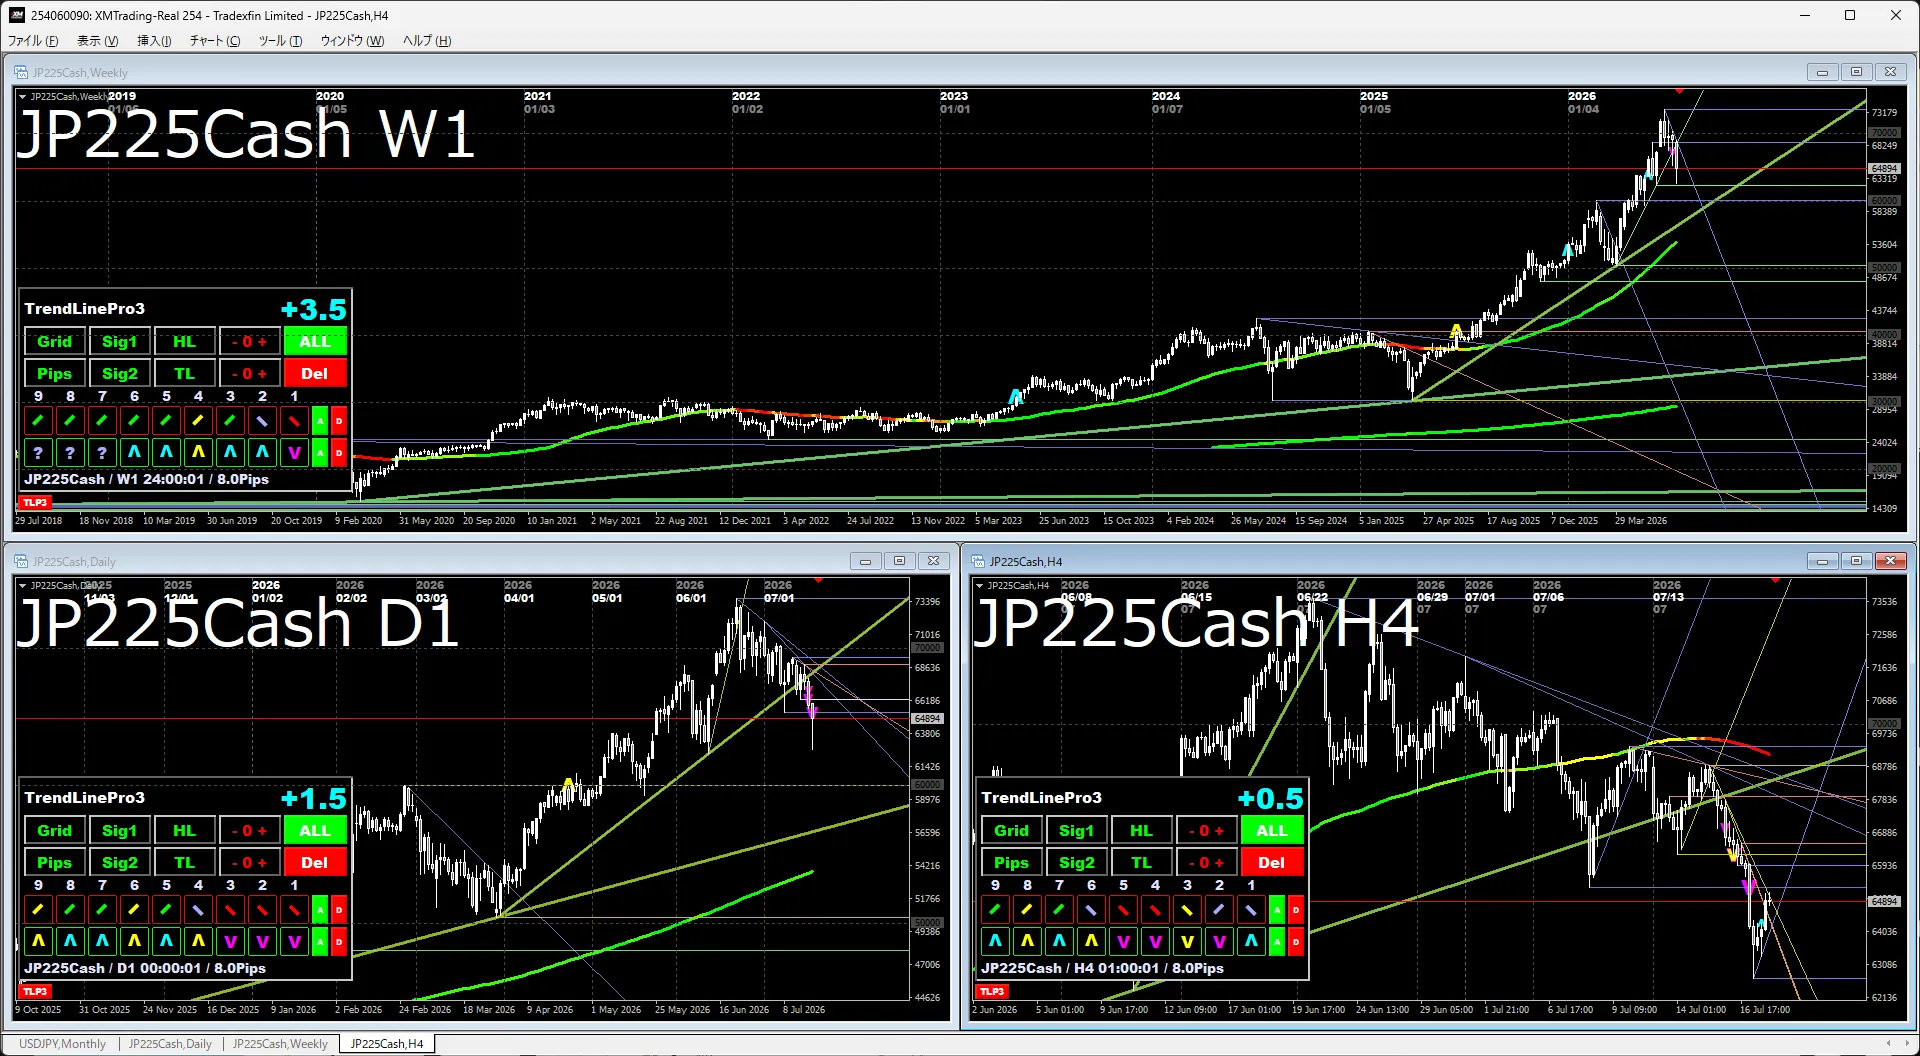
WeeklyThe upward trend continues, but it’s unclear whether it will surge to the near-term ceiling of 80,000.
Daily / 4-hourThe previously watched triangle ended up being broken downward. It has become a choppy, sideways market for a while. We will wait and see until the market stabilizes.
The attached image’s indicator uses the indicators listed below.
If you’re interested, please take a look.