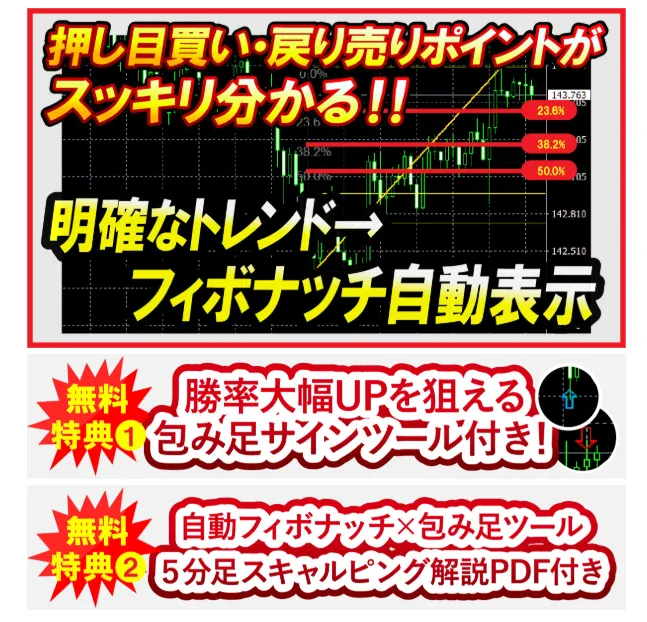

How to use the dollar-yen version and automatic Fibonacci tool: methods and explanations
Introduction
In this article, we will explain how to use the “Dollar-Yen version Auto Fibonacci Tool” and how to apply it in actual trading.
If you haven’t yet obtained the Dollar-Yen version Auto Fibonacci Tool, please download from the link below ▼
https://www.gogojungle.co.jp/tools/indicators/74707
What is Fibonacci in the first place?
“Fibonacci”
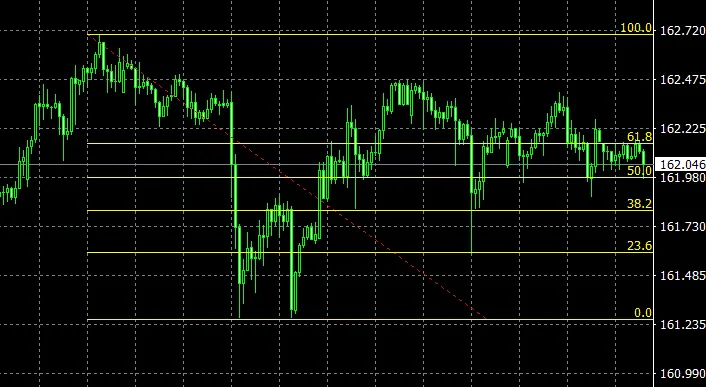
When you first start FX, you may see multiple diagonal lines drawn on the chart and think,
“What are these lines…?”
※This is what they are↓↓↓
So, for those who don’t know, first here is a brief explanation of “Fibonacci.”
If you already understand, you can skip to the practical section!!
Fibonacci is originally the name of a sequence in mathematics.
1, 1, 2, 3, 5, 8, 13, 21...
If you add the two previous numbers, you get the next number. It’s built on such a simple rule.
If you divide numbers within this sequence, you’ll repeatedly see certain ratios such as 23.6%, 38.2%, 50.0%, and 61.8%.
Interestingly, these ratios are said to appear in various places in nature (like shell patterns and the arrangement of plants), and it’s sometimes called the “Golden Ratio.”
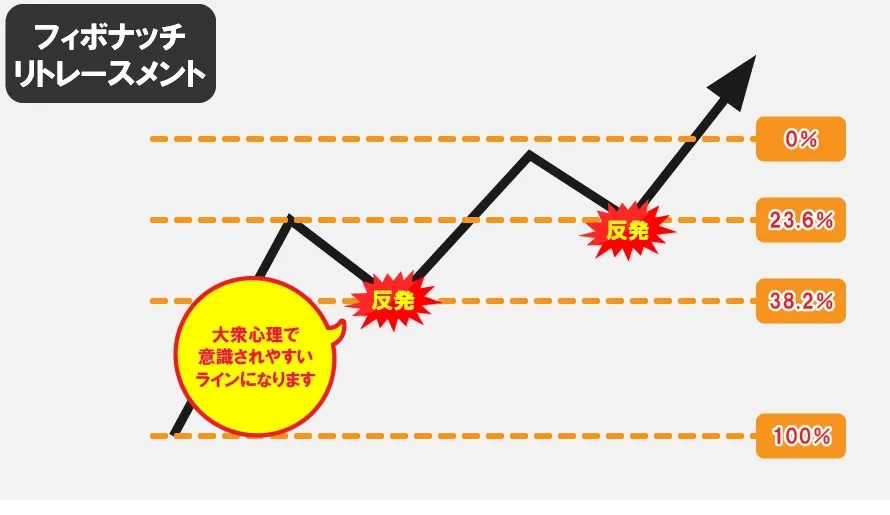
In FX, these ratios are applied to the chart to“predict where price may revert and be prone to reversal”to forecast.
This is what is called the “Fibonacci Retracement.”
What is it specifically used for in FX?
The usage is surprisingly simple.
① On the chartFind the swing lowandswing highto draw the Fibonacci lines (high to low, or low to high)
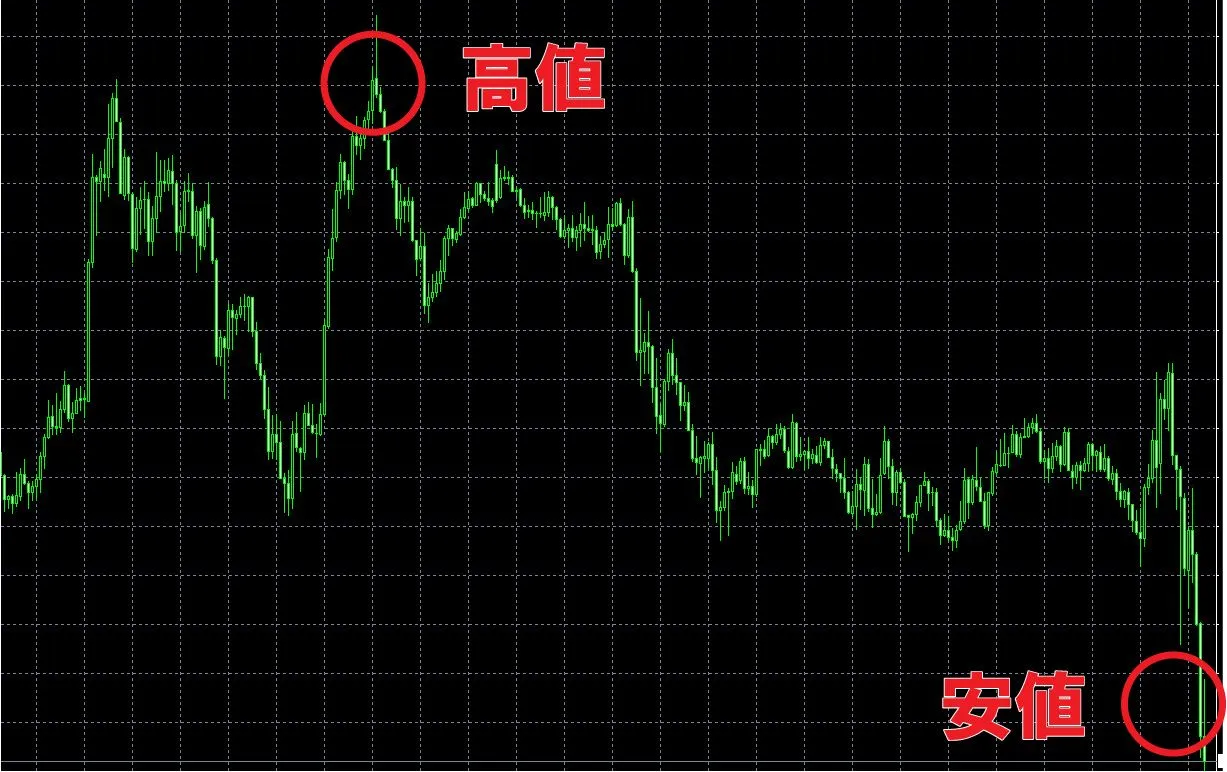
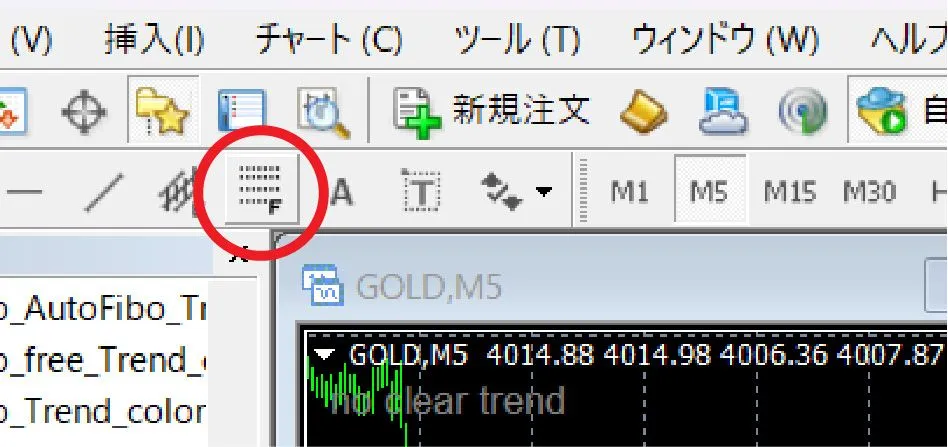
② In MT4, use the red circled button below to connect those two points and draw the Fibonacci lines
③ Automatically, lines are drawn at price levels such as 23.6%, 38.2%, 50.0%, 61.8%...
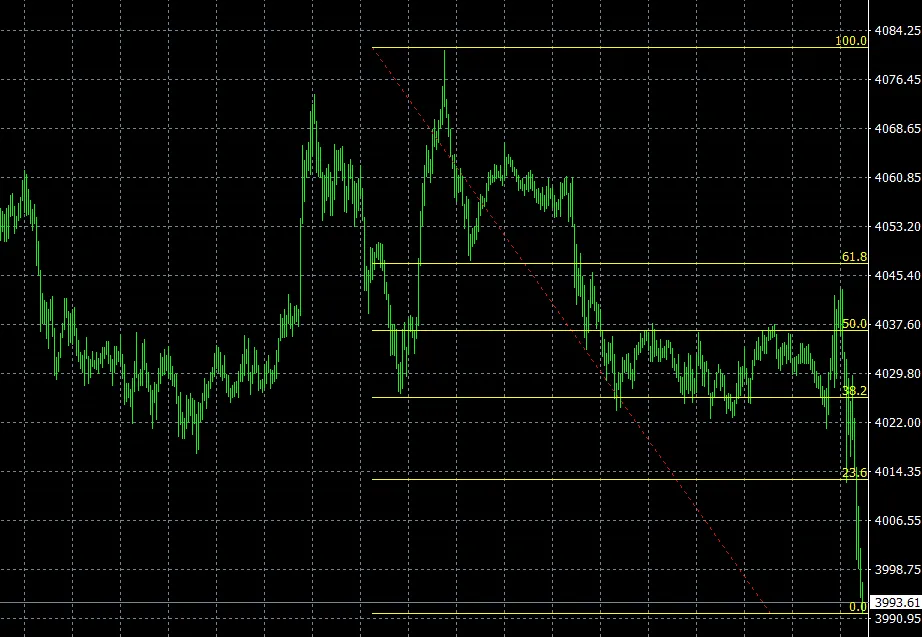
These price ranges where the lines are drawn are said to be “points that many traders tend to watch.”
This is because traders worldwide use Fibonacci with the same concept, making it easy to see everyone looking at the same level.
Why is it said to be prone to reversal?
After a market moves strongly in one direction, it does not typically continue straight ahead for long.
In many cases,
- a bit of extension (impulse)
- a bit of pullback (correction)
- another extension (impulse)
In other words,extend → retraceand so on as it progresses.
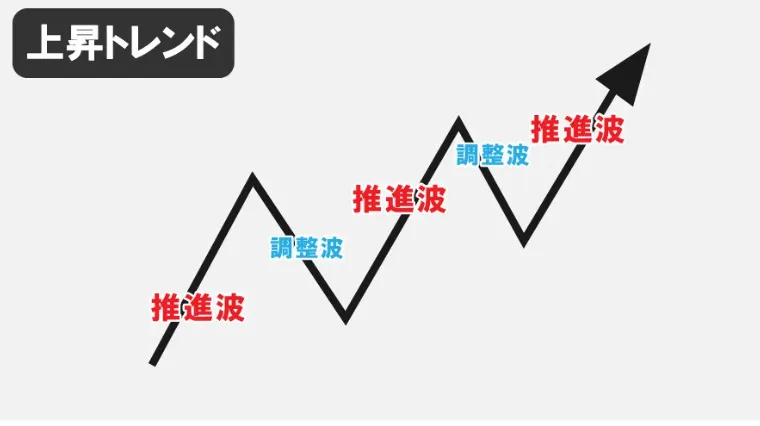
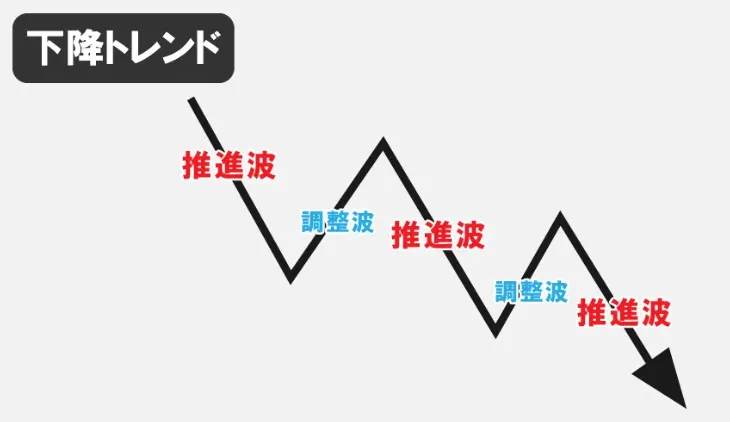
The guideline for the retracement size at this time is the Fibonacci ratios.
It serves as a kind of map to measure “how far back it might pull before continuing in the original direction.”
Three numbers beginners should memorize first
There are many Fibonacci ratios, but you don’t need to memorize them all at first.
Just memorize these three, and you’re good enough for now.
- 23.6%: shallow retracement. Often seen in strong trends
- 38.2%–50.0%: commonly watched, representative retracement depth
- 61.8%: deep retracement. If price breaks beyond this, the trend strength tends to diminish
In the following chart example, from the high (100%) toward the low (0%), Fibonacci lines are drawn, indicating a downtrend.
In that case, the major pullback selling points are 23.6, 38.2, 50, and 61.8, and price moves back and forth within that range.
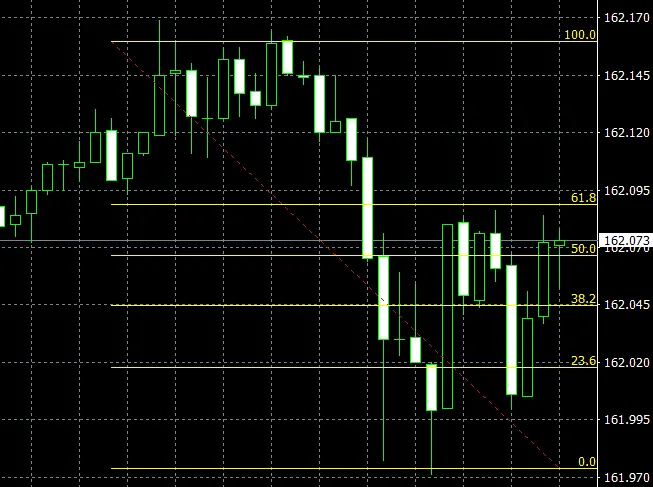
When you look at numbers alone, it may seem difficult, but at first a rough sense of “shallow pullback, normal, deep” is sufficient.
Things to be careful about when using Fibonacci
There is one thing I want to tell beginners here.
Fibonacci does not necessarily work in exactly the same way in every market.In other words, it doesn’t always function identically across all conditions.In clearly trending markets, it tends to work more easily,
while in markets that simply move up and down without a clear direction, the basis itself can become ambiguous.
So, it’s not that “draw Fibonacci and you will definitely see a reversal” but rather a guideline for “points where reversals are more likely.”
By now, I think you’ve grasped the basic idea of Fibonacci.
That said, manually finding lows and highs and drawing lines every time on actual trades is tedious.
Every time you switch the timeframe, you need to redraw; and deciding what constitutes a low or high can be surprisingly difficult for beginners.
This is where the “Auto Fibonacci Tool” we are providing now comes in.
What this tool can do
This tool automatically detects the trend on the higher timeframe for the Dollar-Yen andautomatically draws Fibonacci lines based on that rangeand draws the lines automatically.
- When an uptrend is detected: draw lines from low to high
- When a downtrend is detected: draw lines from high to low
- When 23.6%, 38.2%, 50.0%, 61.8% are reached, automatic alerts (sound and email)
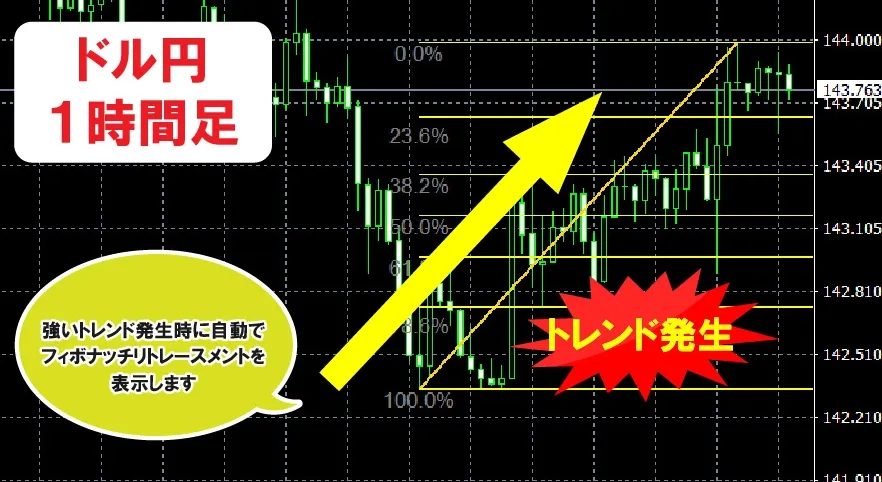
The process of manually finding highs and lows is completely unnecessary.
※This version isUSDJPY only and free.
Step 1: Install on chart and set parameters
Place the tool on the chart of the time frame you want to use for entry (e.g., M15), and in the “Input Parameters” tab, set items ①②③.
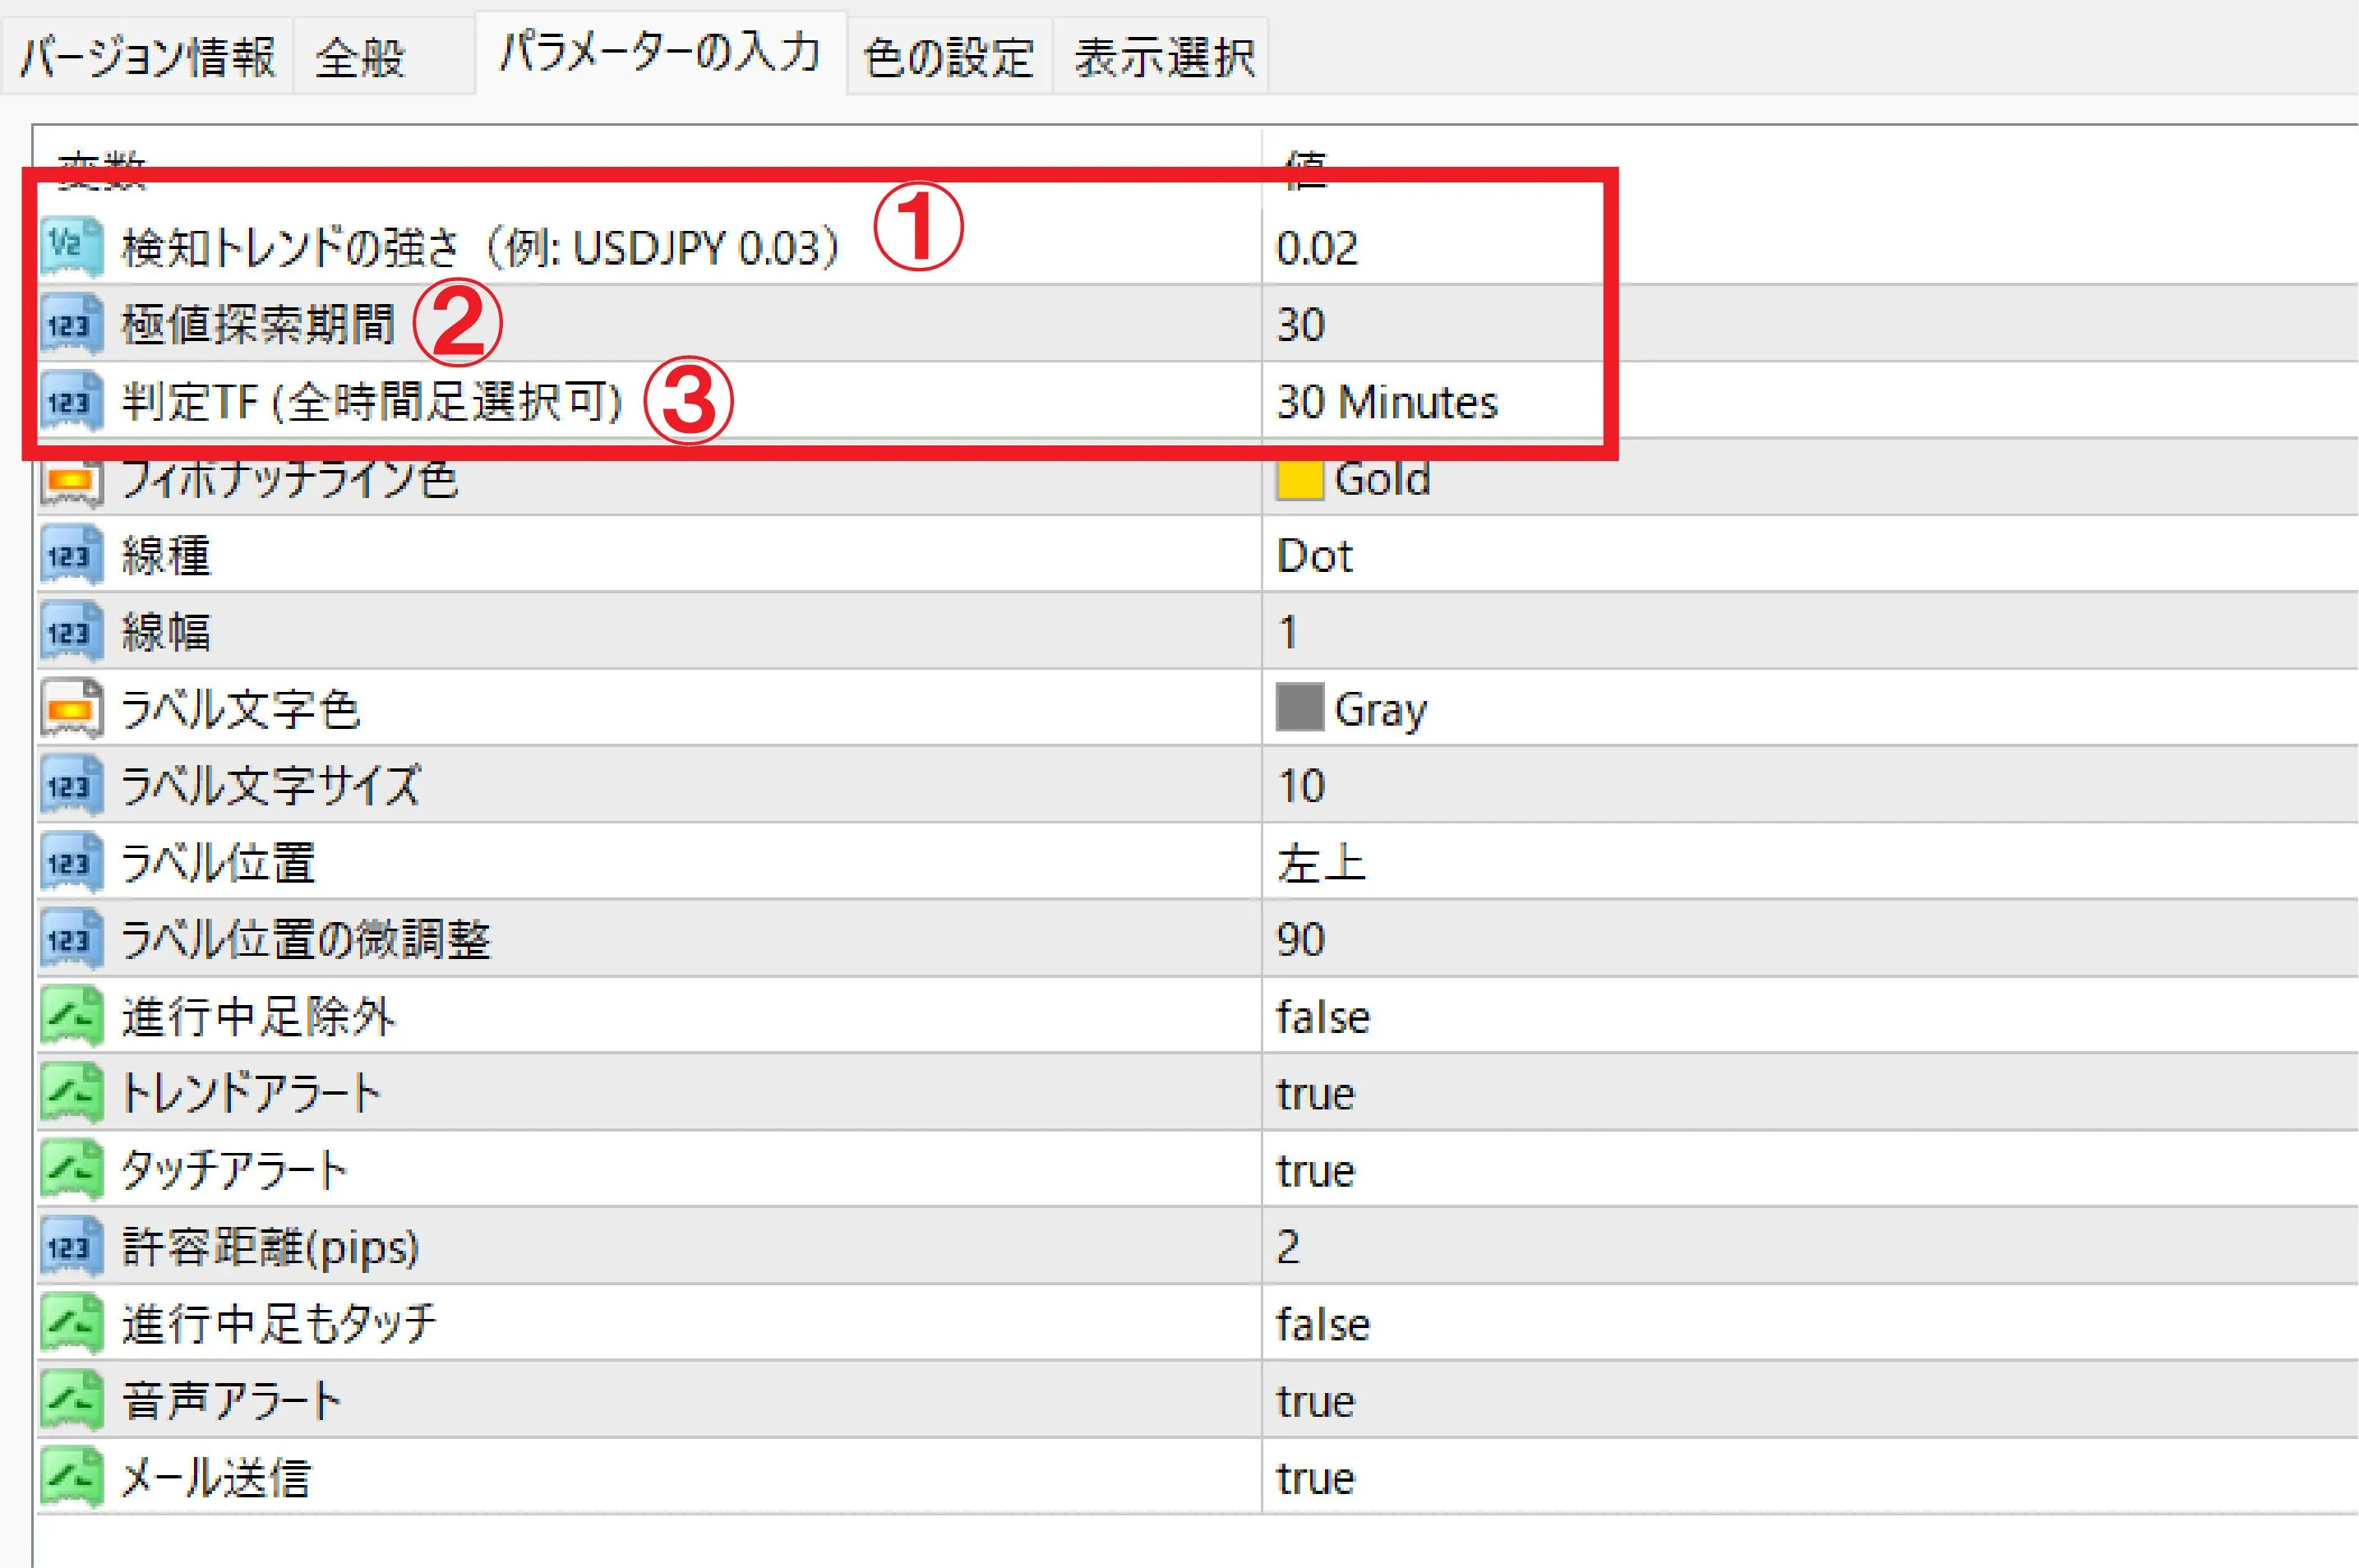
① Strength of detected trend: set how strong the trend must be to detect (for USDJPY: D1: 0.2, H4: 0.1, H1: 0.05)
② Extreme value search period: the period over which highs and lows are searched (number of candles) (about 20–30 candles)
③ Judging TF (any timeframe can be selected): the timeframe used for trend judgment and Fibonacci drawing (D1, H4, H1 recommended)
For example, if you want the trend judgment timeframe to be “1 hour,” set ③ Judging TF to “H1.”
Then, while looking at the actual chart, set the number of candles for judging highs and lows with ② “Extreme value search period” (try changing between 30 and 20 to see the effect).
Next,① Strength of detected trendSince you set the trend judgment timeframe to 1 hour, set the detected trend strength to about 0.05 as a guideline.
※The value for detected trend strength varies by currency pair
※For USDJPY, it is D1: 0.2, H4: 0.1, H1: 0.05
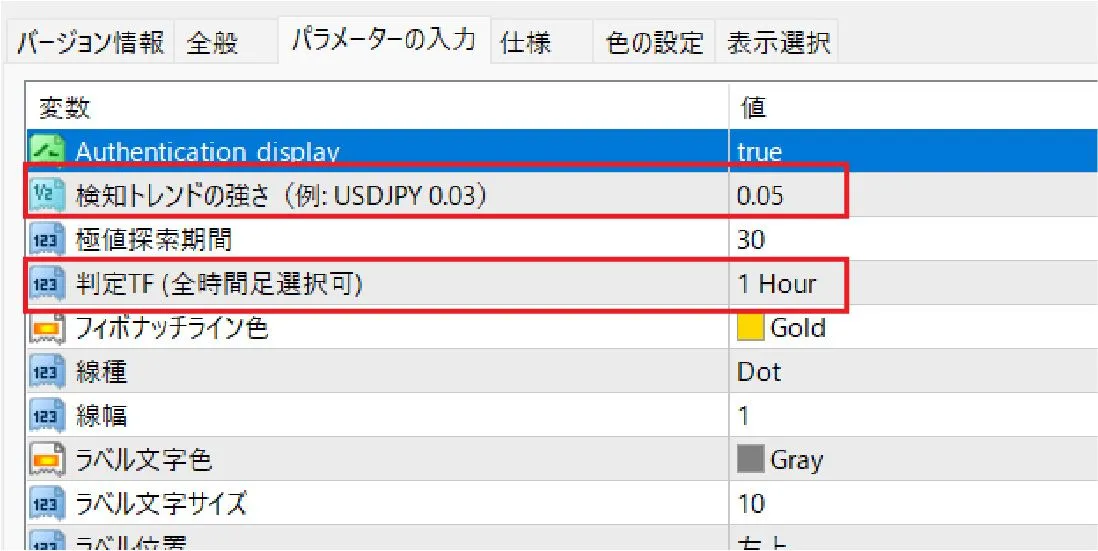
With this, when a trend is detected on the USDJPY 1-hour chart, Fibonacci lines will be displayed automatically.
Next, watch the 5-minute or 15-minute charts, wait for the lines to reach levels, and enter.
※ Similarly, if you set ③ Judging TF to “H4,” you should set ① Strength of detected trend to 0.1.
※ ③ Judging TF is different from the chart’s display timeframe. The chart itself can remain on the lower timeframe you intend to trade (M5–M15, etc.). The tool will read higher-timeframe data in the background and automatically compute line positions.
※ About strength of detected trend: The higher the value, the more likely lines are drawn only in strong trends; lower values increase how often lines are drawn.
Using the above as a guide, if you feel lines are drawn too frequently or too rarely, adjust gradually.
Step 2: Wait for reach via alerts
If the following are ON, you’ll be automatically alerted when price approaches a Fibonacci line.
- Trend alert: enable line-reach alert
- Touch alert: allowable distance from the line (initial value 2 pips)
- Sound alert / Email notification: how to be notified
※ Alerts only trigger at 23.6%, 38.2%, and 50.0% (61.8% and beyond are not notified, so if you want deeper retracements, please check the chart visually).
Also, if trend alert= trueis enabled, you will also receive a notification the moment a higher timeframe trend occurs (when a new line is drawn).
It’s a two-step notification: “trend occurrence” → “retracement line reached”.
Step 3: Confirm lower timeframe reversal and enter
When an alert rings, open the chart to confirm actual price movement.
① While the higher timeframe shows an uptrend, if the lower timeframe reaches the line → confirm a reversal move on the lower timeframe (bullish candlestick reversal or color change on Heiken-Ashi, etc.) and then enter a buy
② While the higher timeframe shows a downtrend, if the lower timeframe reaches the line → confirm a reversal move on the lower timeframe (bearish candlestick reversal or color change on Heiken-Ashi, etc.) and then enter a sell
The basic flow is: “higher timeframe trend occurs” × “lower timeframe reversal confirmation” to enter.
Do not jump in the moment the alert sounds; use it as a trigger to confirm.
Common stumbling points
① The line disappears and it shows no clear trend: This means the higher timeframe is considered to be in range (consolidation). In this case, the entry rationale is weak, so it’s safer to skip.
② It doesn’t move on other currency pairs: This version is designed specifically for USDJPY. If you want to use it on other pairs, please consider the full version that supports all currency pairs at the link below.
https://www.gogojungle.co.jp/tools/indicators/62148
Summary
- Fibonacci originated from a mathematical sequence
- In FX, it’s used to predict the retracement range of price
- 23.6%, 38.2%–50.0%, and 61.8% are representative ratios
- Because many traders watch them, they tend to react to those levels
- However, effectiveness depends on market conditions (whether there is a trend)
- Using this tool you can automate this entire process
First, install this tool on your chart and get a feel for how the alerts sound in practice.
As you get used to it, you’ll likely want to try the same method on other currency pairs.
When that time comes, we also have a full version that supports all currency pairs, so if you’re interested, please check it out ▼
https://www.gogojungle.co.jp/tools/indicators/62148