
The misconception that you can win with RSI divergence. Why the masses are being deceived
This is Max, Pro Trade Coach.
Today, we’ll discuss that phenomenon in oscillator analysis that is often mistaken for “professional-grade alchemy.”
■【Lie⑥】The misconception that you can win with divergence
The divergence, often treated as an application of the classic oscillator indicator “RSI,” refers to counterintuitive occurrences such as the actual chart price making higher highs while the RSI graph makes lower highs, and is explained as a sign that a trend may reverse.
To put it bluntly: this alone does not greatly improve accuracy.
Many people are misled by the formal-sounding term “divergence,” as if it were some high-precision alchemy, but that is a large misconception. Why can’t you win? The reason is that the mechanism by which divergence appears is very simple, and it is merely a phenomenon that occurs quite frequently on charts.
When a chart that has been in an uptrend for a long time forms a deep pullback (decline) and then rises again to exceed the recent high slightly, a bearish candlestick may appear. Just this much movement can easily generate divergence. If such signals alone could cause the market to reverse neatly, there would be no losers in FX.1In reality, even after divergence appears, it is common for the price to consolidate briefly and then resume its original trend direction (divergence negated). It is crucial to recognize how dangerous it can be to blindly trust plausible jargon and surface signs.
■The true way of reading without being fooled by jargon
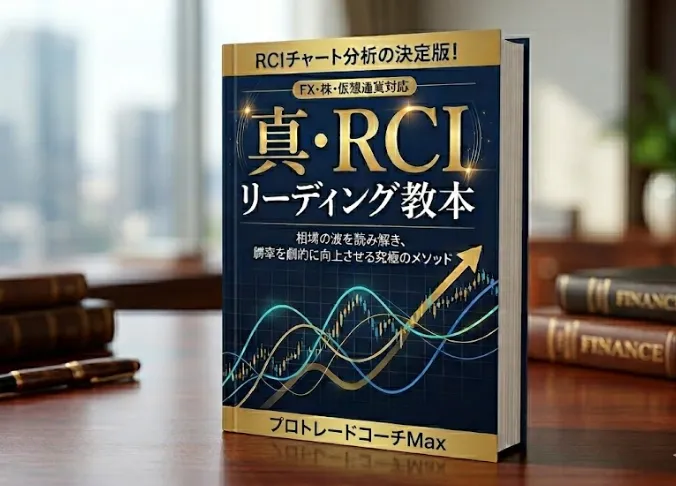
For those who want to study the fundamental market physics that actually works in modern markets, not just superficial signs like divergence, please take a look at the “TrueRCI Leading Manual(500 yen) offered on GoGoJungle.9% of the essence of professional foresight to help you break out of the losing group.