
What happened to the USD/JPY after everyone went home last night
Latest 2026 Edition!!
You can watch the interview VTR with President Hayakawa of Gogojan and me here
There are also free gifts available.
Good morning everyone.
Last night’s USD/JPY move was,as described in yesterday’s article, this is how it unfolded.
The trend continued.
That is all.
USD/JPY 1-hour and 1-minute charts for after you all get home from work
There was a fairly impactful US economic indicator release at 21:30 last night.
Isn’t the timing for trading after you get home to trade around the economic indicators at 21:30?
First, be aware that the economic indicators exist.
The market moves based on whether the results are better or worse than the expected numbers.
There isn’t a rule that good results always lead to dollar buying, so you should have an image of “movement.”
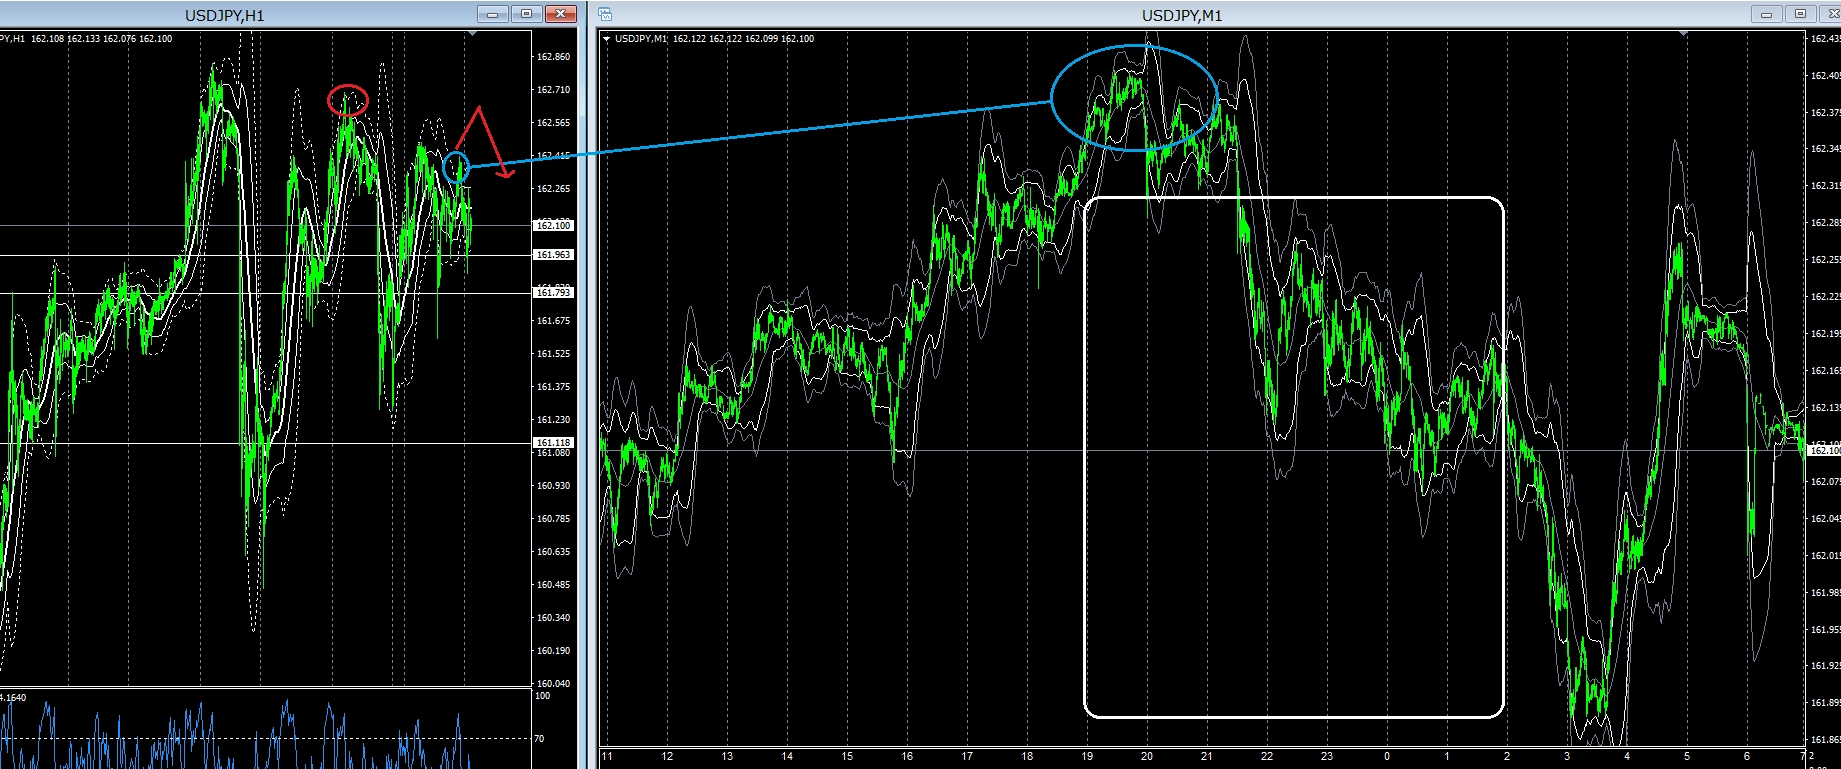
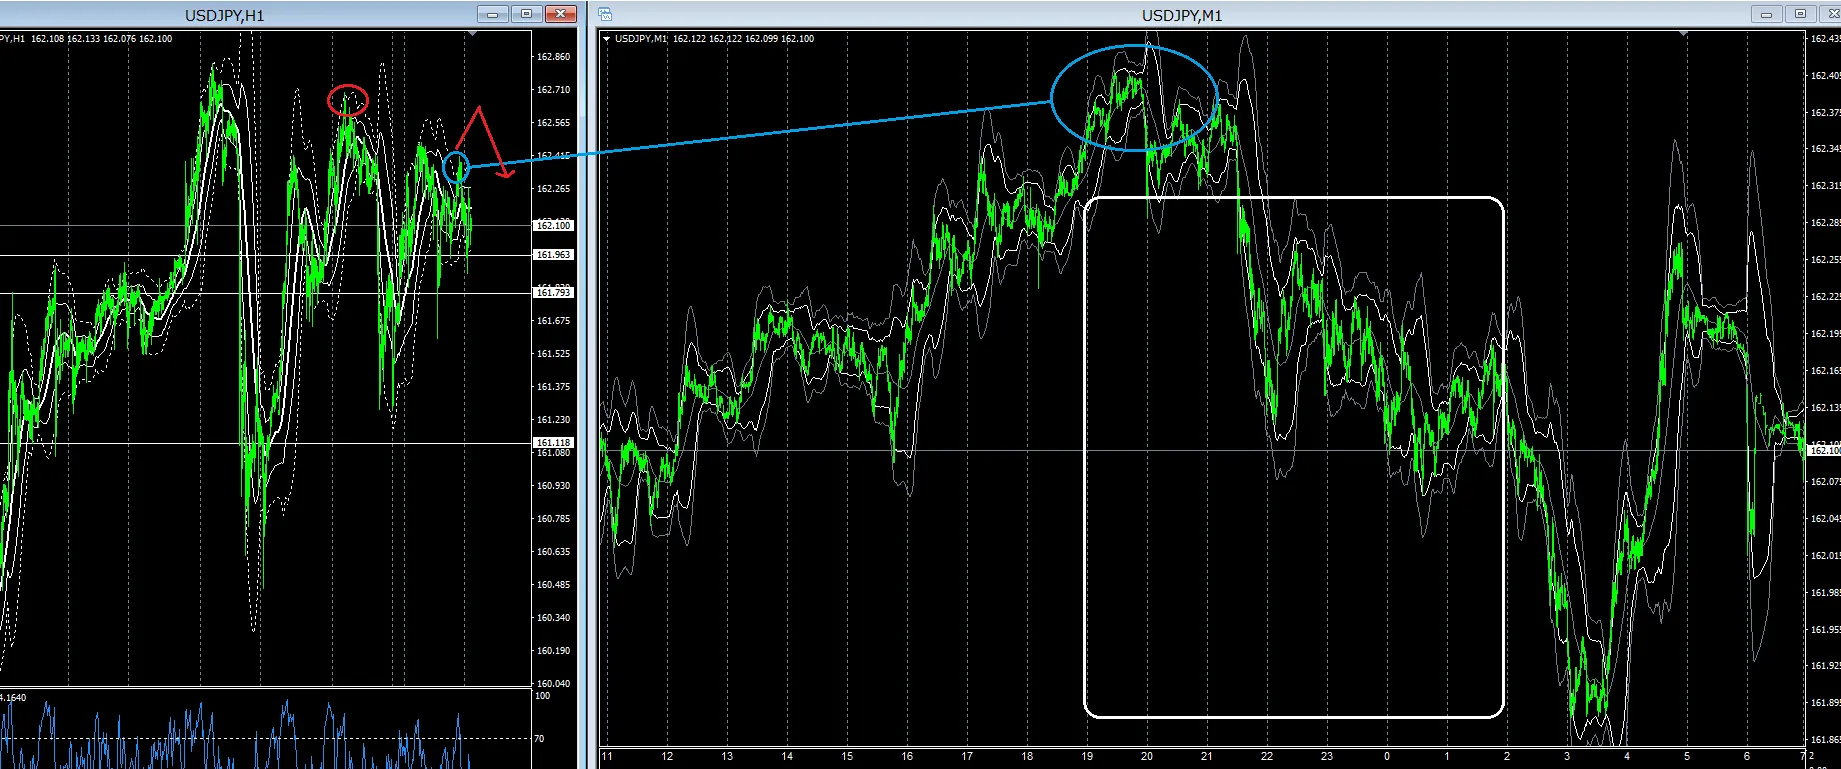
I expect you’ll encounter near the blue circle high after you get home.
According to yesterday’s article, the trend was to continue selling, so you could judge this as a temporary top for a return move.
If, contrary to expectations, it rises like a red line, it relates to the red circle high; if you don’t break through, it will trend down, but since it is assumed the latest high has been broken upward, a range is also possible.
However, this time the economic indicators contributed to a decline in the end.
The trade aiming for a blue circle top would be about timing and stop losses, so with an unusual hedge you can do a certain amount of gambling.
As I mentioned in yesterday’s article, you can enter trades even after movement starts, and once it moves you have more time to think, expanding your options.
If you look at the 1-minute chart, it formed a white square-like drop after hitting the top, but dear billionaires, did you attempt a short break?
I think you could have taken a position between 21:30 and 22:00.
Nontraditional hedge users in FX can take a small retrace selling scenario with hedging and an S-position.
I’m sure you’ve all tried various methods, but using them well or poorly depends on looking at the current chart flexibly and from multiple angles, and building at least one of your own scenarios to take a position.
If you can adopt this approach to charts, I think you can reduce losses.
Read my Investment Navigation and see where you should stand by analyzing where you start, then try starting with your method from there.
Isn’t it overwhelmingly advantageous to take a position where things move rather than where they don’t?
Thank you for your continued support today as well.
For traders who desperately want to succeed in trading, who dream of making a living from trading, I recommend this product—the trading techniques you can learn on your own, and these are the ones we provide below: