
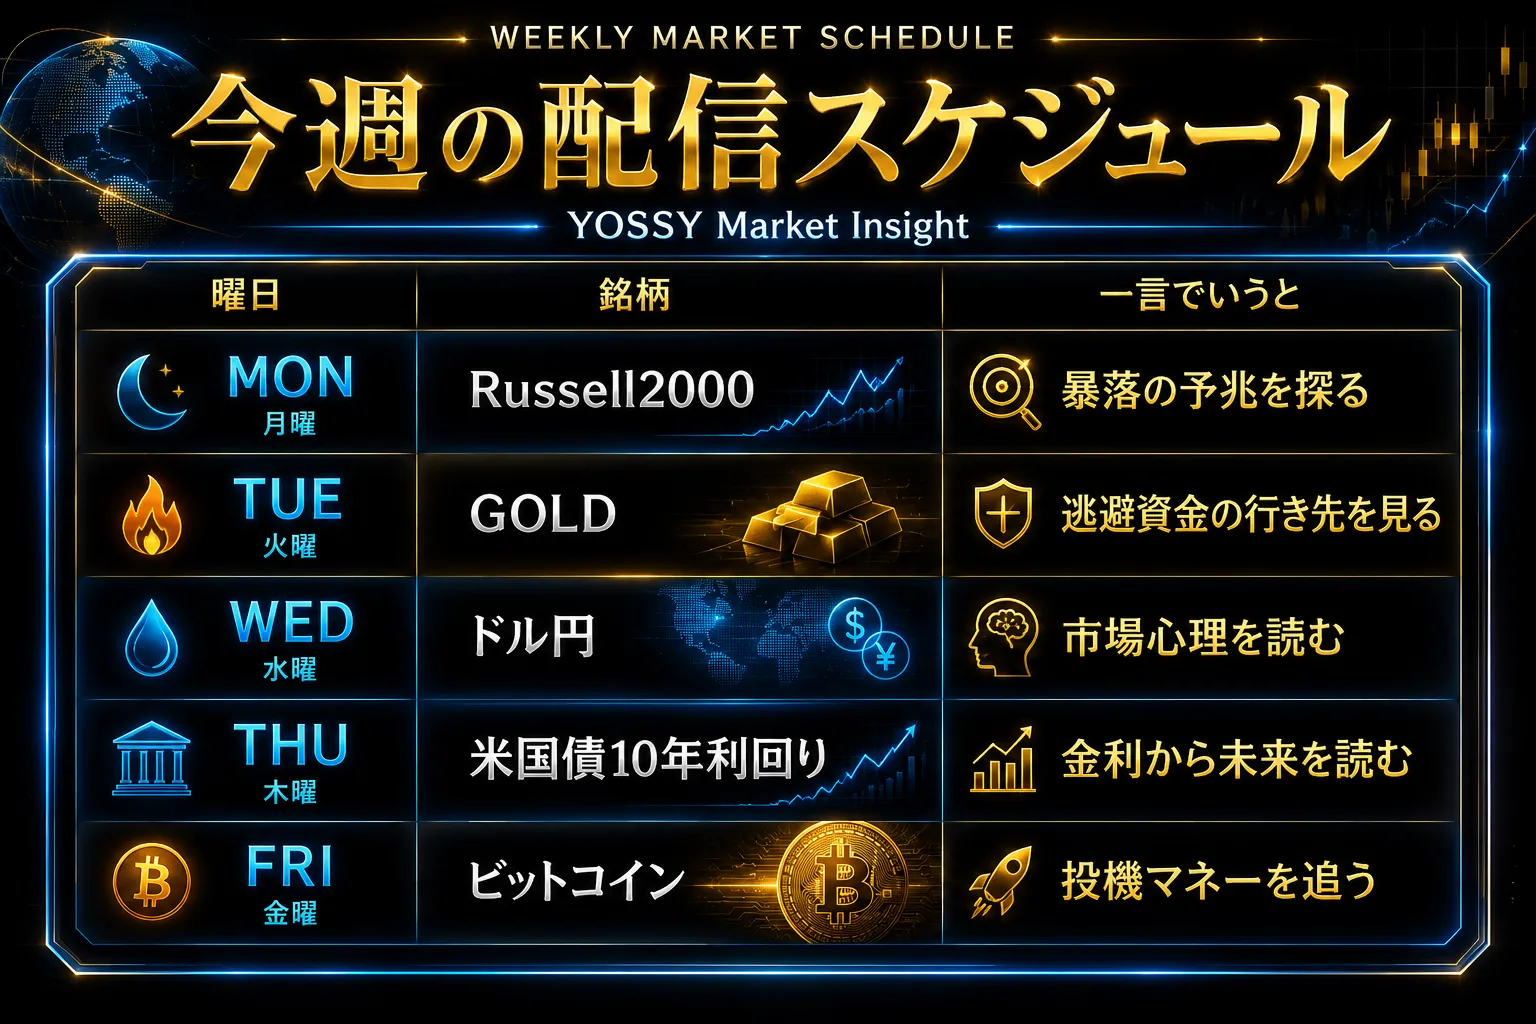
July 16 (Thu): 【BB & HM】 Nikkei 225 vs. US 10-year Treasury yield
This time
“The thermometer of the economy”
“U.S. 10-year Treasury yield”
comparison will be made.
【Overall Scenario Probability】
This week's overall market: …
“Rising: 55% / Falling: 45%”
※ Because the +2σ opening tendency of the NY Dow and the rise signal of Bitcoin, and the alignment of the S&P 500 harmonic and the triangle ascending scenario directions indicate a bullish tilt
※ Presented as a reference level.
【This Week's Market Focus Points】
This week's market is showing slight signs of rising in each market that had been directionalSence up to last week, forming a scenario where some indices are beginning to show gains.
The NY Dow and Bitcoin are showing a slightly open +2σ side, and the direction is also aligned with the upward scenarios of the S& P500 harmonic and the triangle rise.
In the Nikkei 225, signals suggesting a short-term rebound are appearing, and important moving-average battles are worth watching.
The U.S. 10-year Treasury yield is in an environment favorable to rising, and this week's price action is likely to clarify the overall market direction.
More details will be explained in the paid section.
➥The continuation is explained in detail in the members-only report.
If you have not registered yet, please click here ↓
【Integrated Version】
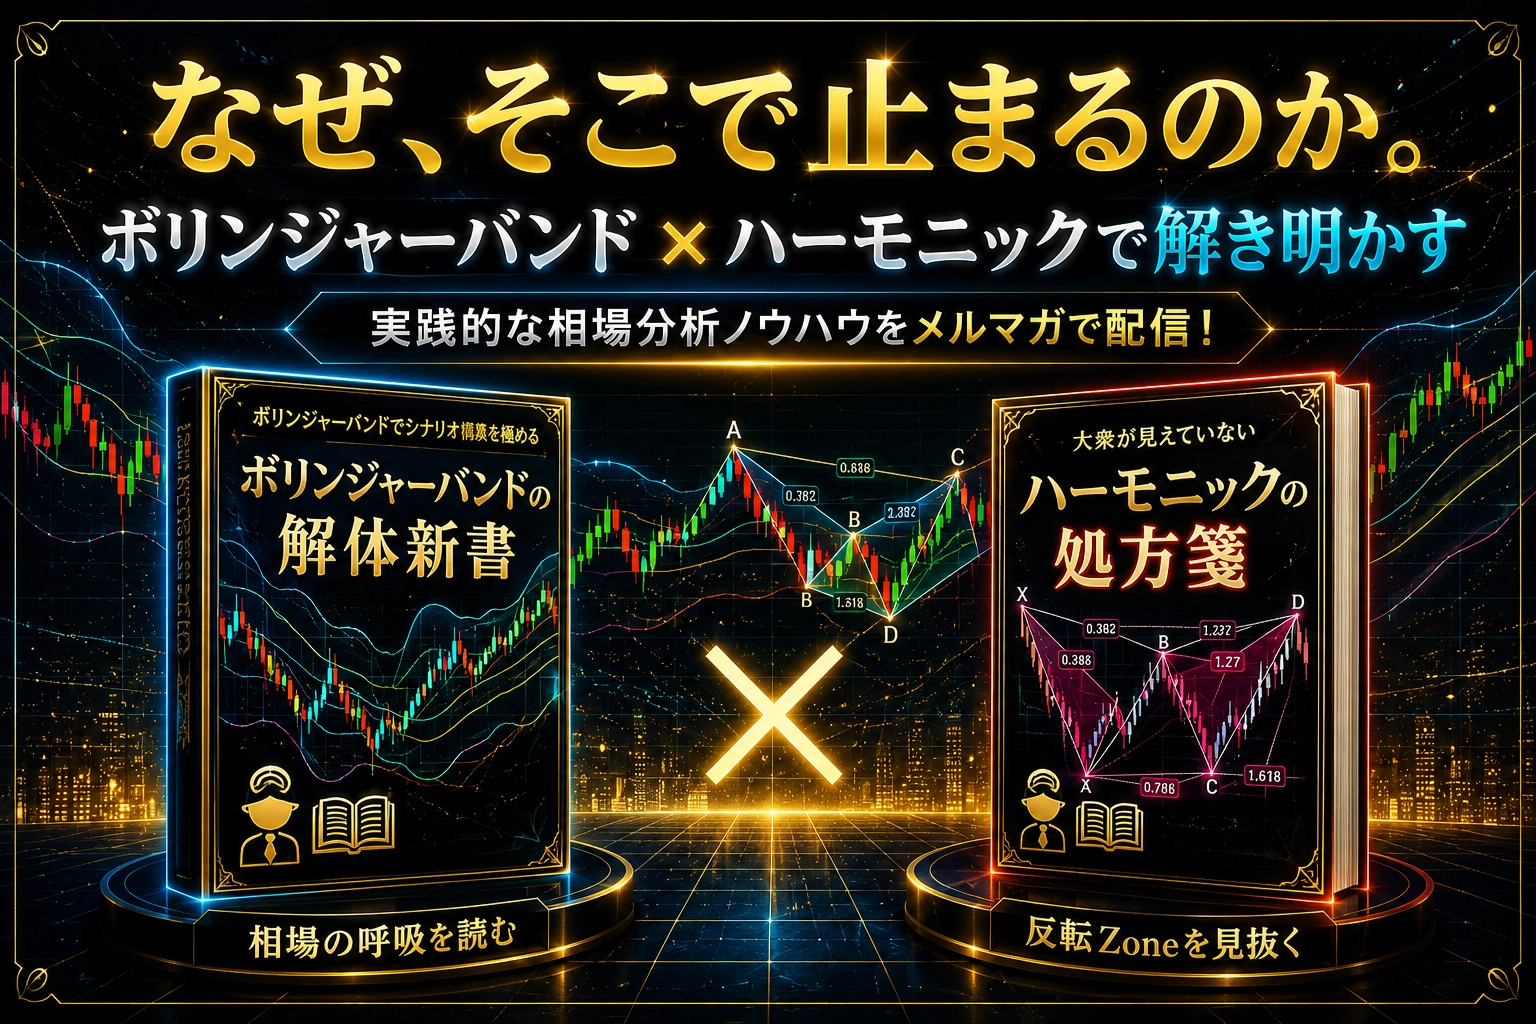
“Why does the market stop there?” Bollinger Bands × Harmonics. A fusion of statistics and geometry to capture turning points in the market with high precision!
https://www.gogojungle.co.jp/finance/navi/series/1613?via=articles_detail_aside
(※The following is for members only.)
--------------------------------
【Environmental Awareness】