
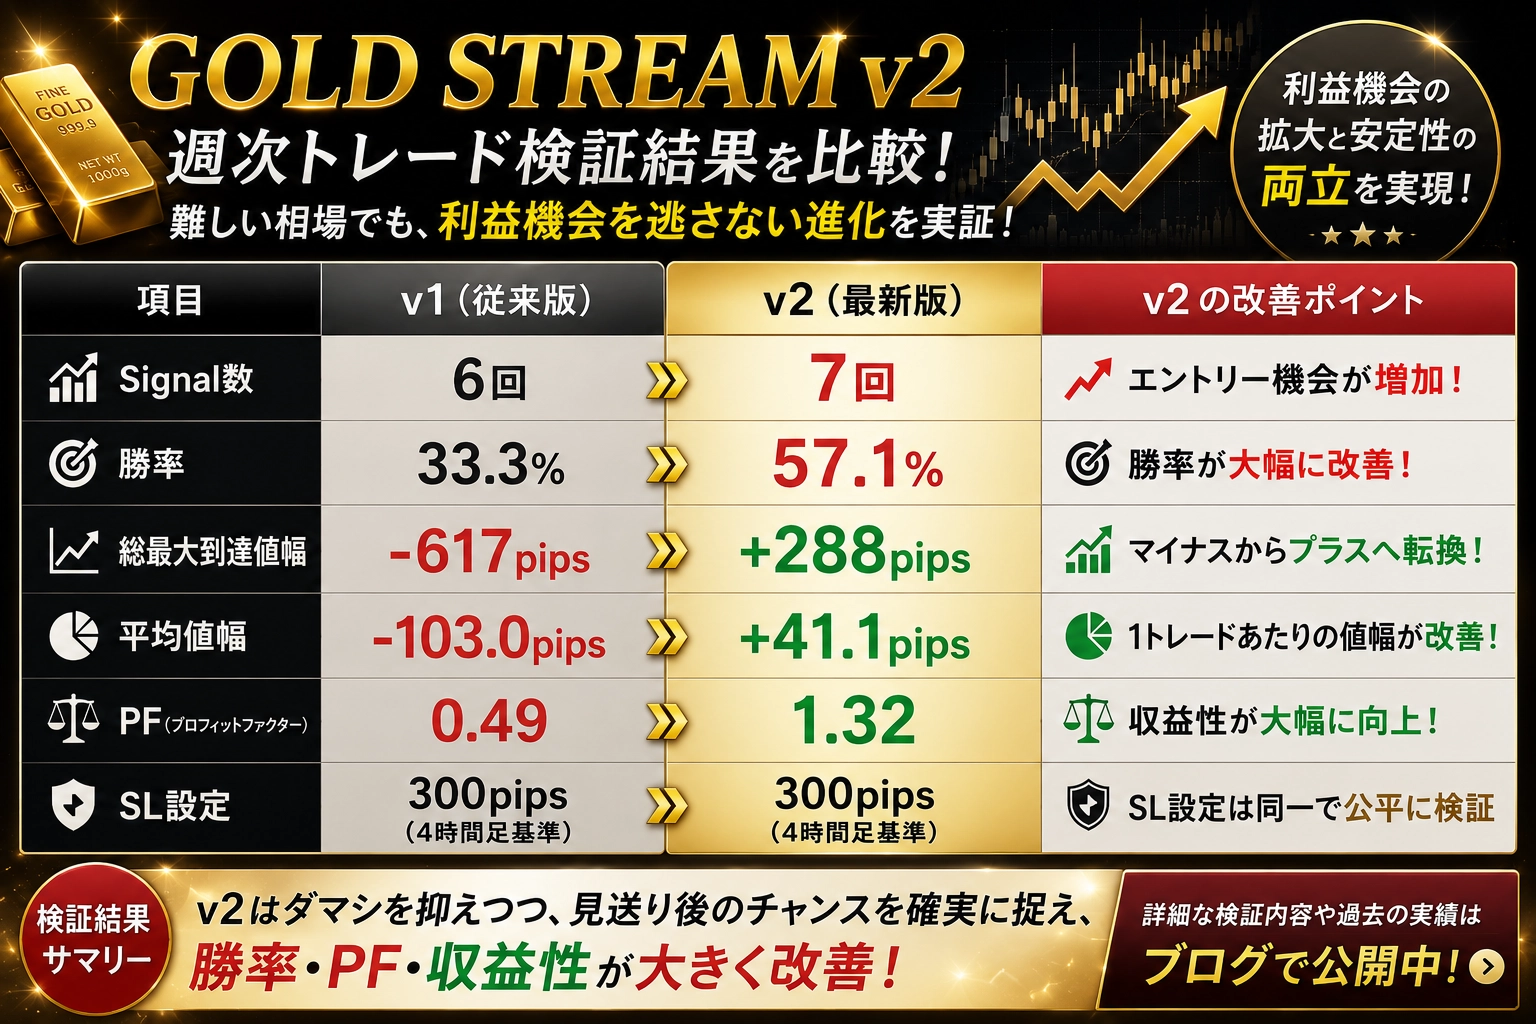
GOLD STREAM v1 vs v2 【Weekly Trade Verification & Delivery History】Gold Day Trading Specialized Type "GOLD STREAM" 2026.7.6~7.10
This time, in addition to our usual weekly verification,
we will publish the weekly verification results of
GOLD STREAM v2 that was recently upgraded.
Using the Rakuten MT4 CFD environment for publication.
From now on,to be useful for those who are primarily considering domestic FX/CFD accounts, we will also disclose verification data in a domestic account environment.We plan to publish them.
If you are considering system implementation or operation, please use this as参考.
“What will the results be like in a domestic account environment?”
To answer such questions, we will clearly verify and publish GOLD STREAM v2's performance.
We hope these results, based on actual market data rather than desk research, will be helpful for building your trading strategies.
And furthermore, this time,
not only the weekly verification results of GOLD STREAM v2,
we will also introduce the newly released“AI × FIBO Expansion”
visualization tool for target price ranges
【AI WAVE】
“I entered but I don’t know how far it will move…”
“Take profit too early, can’t capture all the gains…”
To address these common trader challenges, by combining AI market analysis with FIBO Expansion,this new tool is designed to visually help you grasp price ranges and profit targets that the market tends to reach.We will explain in plain terms in the latter part of the article how this works with actual charts.
In the latter part of the article, using actual chart images,
- why that price range was extracted as a target
- how to combine with GOLD STREAM signals
- how well it performed in actual market conditions
we will clearly explain.
Not only the entry accuracy,
but also those who want to improve the exit/profit-taking accuracy should read this.
The combination of GOLD STREAM and the new tool【AI WAVE】opens upnew possibilities that we will check together.
Let’s look at them together.
【v1 Weekly Trade Verification】 ”GOLD STREAM” 2026.7.6~7.10 MAX Calculation▼![]()
【Last week's delivery history】
![]()

【July 6–July 10, 2026】 GOLD Market Summary
■ Price Trends
- In the first half of the week, following last week's rebound, profit-taking sales dominated as the dollar recovered, starting with a heavy tone on the upside.
- In the FOMC minutes, inflation vigilance was reaffirmed, and rising U.S. rates weighed on GOLD.
- In the second half of the week, oil price rises due to Middle East tensions increased inflation concerns and, with expectations of higher interest rates for longer, selling pressure was prevalent.
- For the week, GOLD fell about 1.7%, turning into a week with renewed correction after a rebound.
■ Demand/Supply & Investment Factors
- Inflation concerns from rising crude oil prices strengthened expectations of Fed rate hikes, creating headwinds for GOLD, which does not yield interest.
- Conversely, central banks, led by China, continued increasing gold reserves, providing mid-to long-term price support.
- Geopolitical risk supported safe-haven demand, but monetary policy factors showed stronger influence in the week.
■ Investment Trends
- Short-term players traded on the basis of FOMC minutes and U.S. economic indicators, leading to high volatility.
- The main themes remained "inflation" and "expectations of additional rate hikes," and reaction to monetary policy outweighed safe-haven demand.
■ Overall Assessment
【SILVER Market】
SILVER moved in tandem with GOLD, weakening. A stronger dollar and higher U.S. interest rates were selling pressures, but industrial demand from solar, EVs, and other sectors remained solid, supporting the downside floor. In the short-term, policy can sway the pace, but in the medium-to-long term, tight supply-demand persists.
【COPPER Market】
COPPER stayed firm on expectations of Chinese demand and supply constraints. Expectations of global infrastructure and AI-related demand supported the market, while concerns about economic slowdown capped gains. In the mid-to-long term, continued supply tightness supports prices.
Weekly Trade Verification AI Evaluation
【GOLD STREAM v1 Weekly Trade Verification2026.7.6~7.10 】
■ Entry Signal Accuracy Evaluation (Strength/Correlation Analysis)
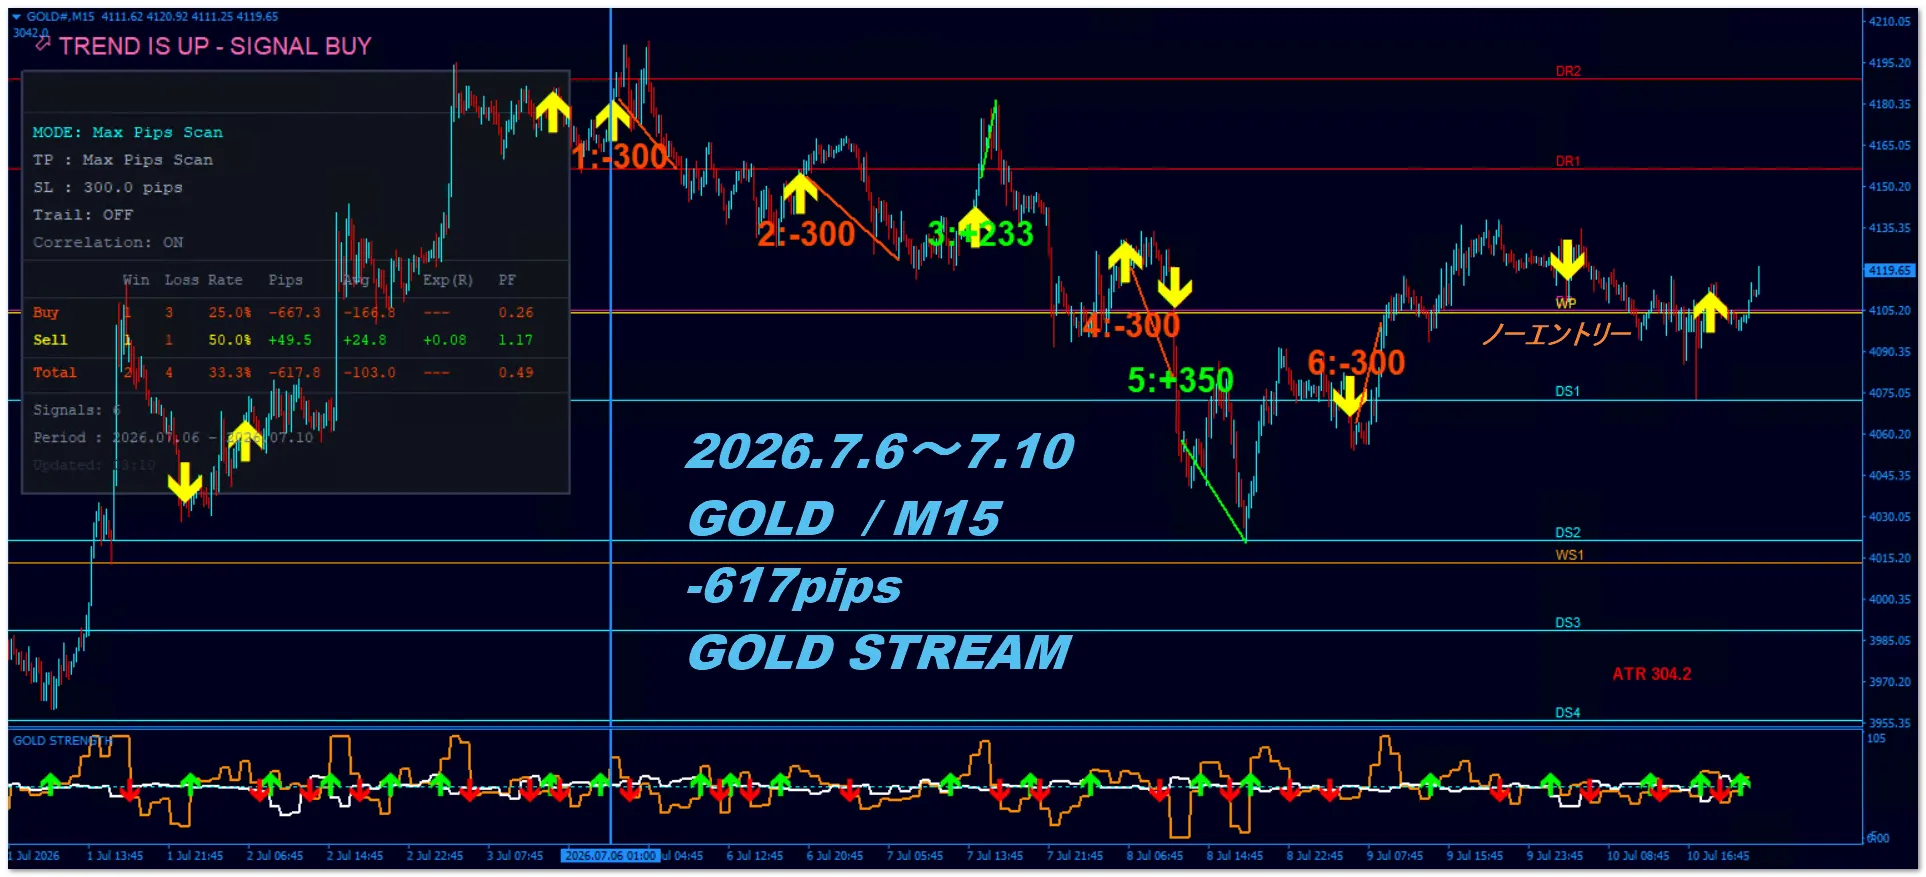
From the images, GOLD price this week was a range-bound environment with frequent direction changes.
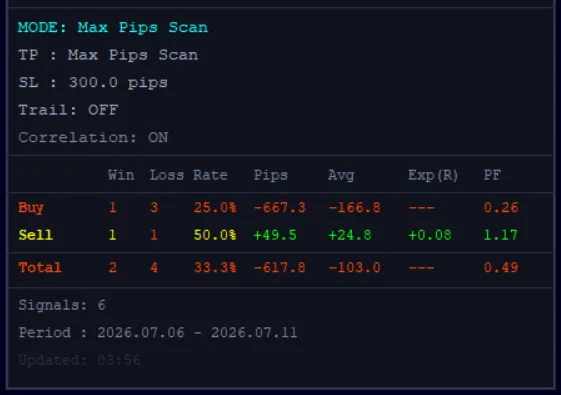
GOLD STREAM v1 generated a total of 6 entry signals based on strength and correlation analysis, but this week the trend continuation was weaker, with noise and short-term reversals dominating, making it a challenging week for the system.
v1 verification results are,
- Signal count: 6
- Win rate: 33.3%
- Total maximum range: -617 pips
- Average range: -103.0 pips
- PF: 0.49
- SL setting: 300 pips (4-hour basis)
Result: as above.
Individually,
- ① -300 pips
- ② -300 pips
- ③ +233 pips
- ④ -300 pips
- ⑤ +350 pips
- ⑥ -300 pips
Thus, while profit signals occurred, many reversed before developing into a large trend, and 4 SLs were hit.
Notably this week5-day ADR 866 pips showed relatively high volatility, yet there were few trends moving in one direction, resulting in a typical range market with frequent brief spikes up and down.
Looking at ADR levels alone, there was enough price range, but movement was dispersed, making it difficult for a trend-following system.
Therefore, while strength judgments maintained some function, the difficulty of determining trend continuation was very high this week.
■ Trade Evaluation
This week's result ended negative, but in system testing what matters is not that some weeks are losses, but whether losses are managed.
With fixed SL of 300 pips on the 4-hour basis, losses were limited, avoiding a large drawdown.
Additionally, profits such as +233 pips in #3 and +350 pips in #5 show an advantageous tilt toward profits, indicating that the issue was more about market environment misalignment than a failure of signal accuracy.
The maximum attainable range when fully held is only a reference value; in range-bound markets like this, prioritizing risk management over capturing every possible move is reaffirmed as important.
■ GOLD Market Difficulty
★★★★★(5.0 / 5.0)
Direction often reversed and stalls after breaks occurred frequently, making this a high-difficulty market for both discretionary and systematic traders.
■ GOLD STREAM v1 Weekly Trade Verification Evaluation
★★☆☆☆(2.0 / 5.0)
- Win rate 33.3%
- PF 0.49
- Total max range -617 pips
- 4 SL hits
- Struggled in ADR 866 pips range
This week was tough for v1, but it also clearly highlighted the system's weaknesses, making it a valuable verification week.
In trending markets it performs well, but in choppy, directionless moves there is room for improvement.
■ v1 Weekly Trade Verification Summary
Markets alternate between winning weeks and enduring weeks. What matters is not hiding losses but turning the results into the next evolution.
This verification clearly shows GOLD STREAM v1's issues and points for improvement.
True strength is tested in difficult markets, not favorable ones.
Next, we will verify how far GOLD STREAM v2 could conquer this high-difficulty range.
【v2 Weekly Trade Verification】 ”GOLD STREAM” 2026.7.6~7.10 MAX Calculation▼![]()
【GOLD STREAM v2 Weekly Trade Verification2026.7.6~7.10 】
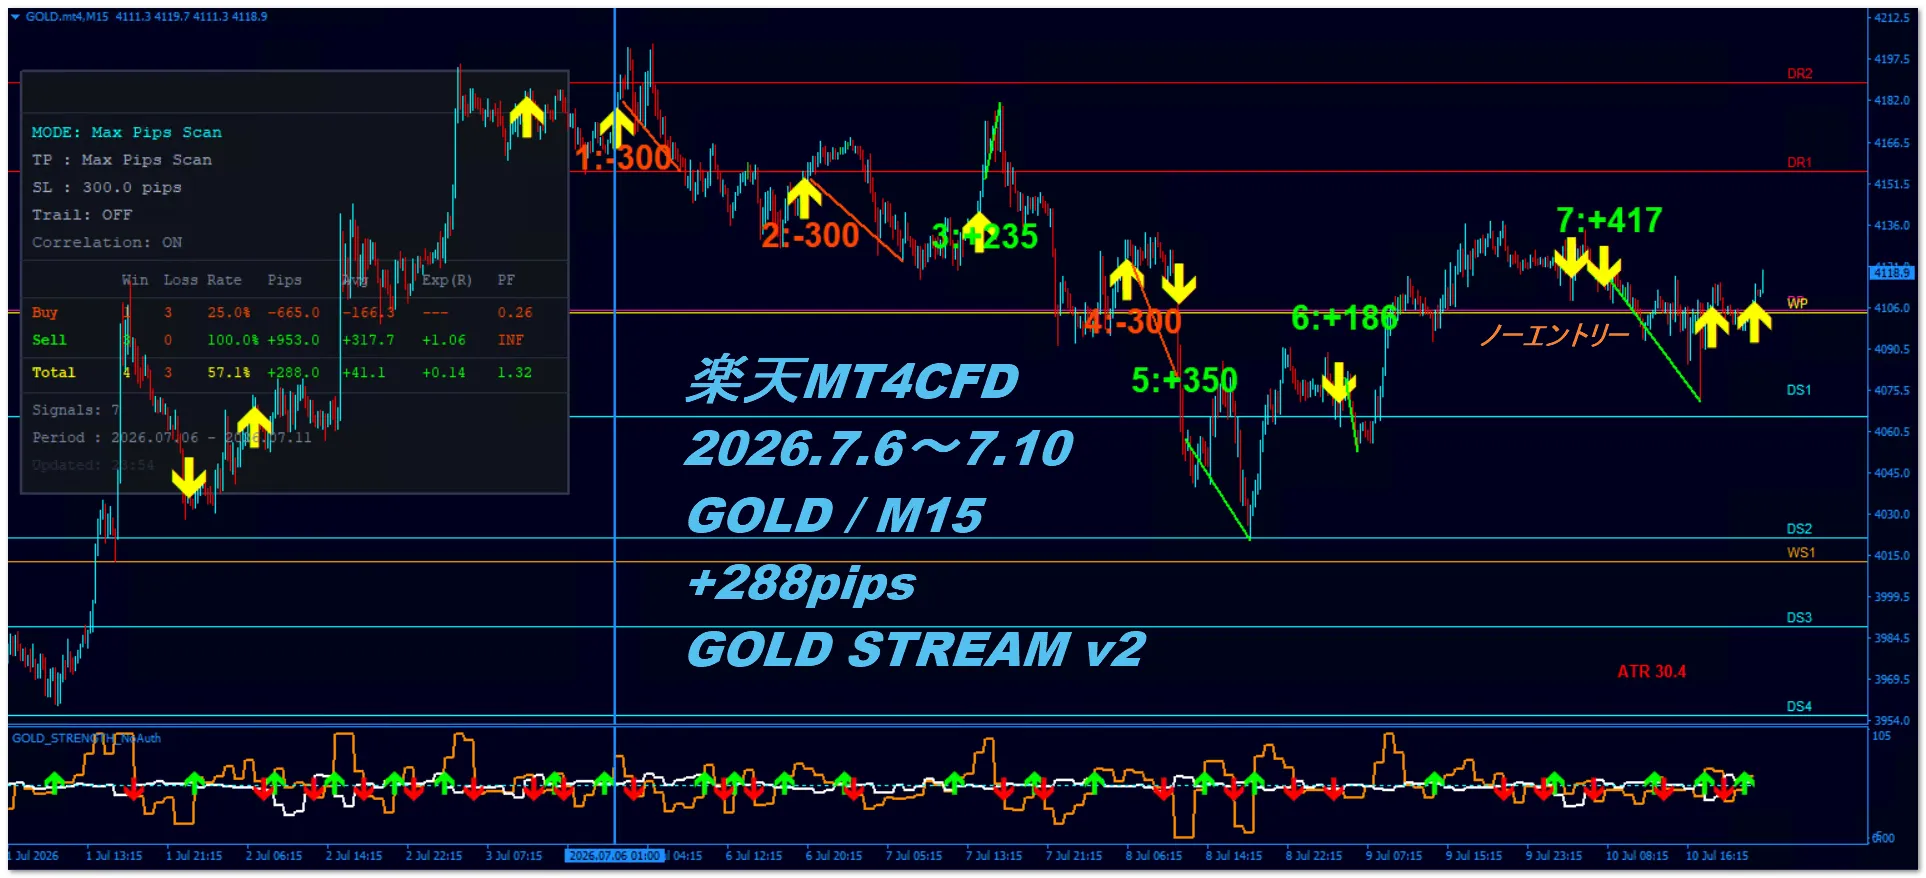
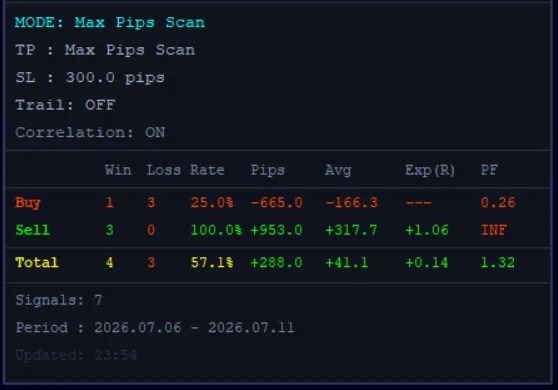
In GOLD STREAM v2, seven signals are formed based on strength and correlation analysis.
Result: 4 wins, 3 losses, win rate 57.1%,
max attainable range on full-hold basis: +288 pips.
A notable point is that in v2, even after passing up on entries, signals are actively formed in high-advantage situations, resulting in increased entry opportunities.
In scenarios that previously were passed or were difficult to adopt due to precision, improved strength/correlation analysis now captures new trading opportunities.
In fact, in the latter half of the images, after a no-entry pause, signal 7 appeared, expanding profit opportunities.
This week was not simply about more signals; it was about selecting only high-advantage moments while avoiding unnecessary entries, reflecting v2's design philosophy.
The center-to-late portion of the image was a challenging area with a lot of buy-sell overlap, but by avoiding unnecessary entries, losses were limited.
v2 verification results are,
Thus it was.
Individually,
- ③ +235 pips
- ⑤ +350 pips
- ⑥ +186 pips
- ⑦ +417 pips
and when the market direction aligned with the strength, profits grew steadily.
Meanwhile,
- ① -300 pips
- ② -300 pips
- ④ -300 pips
hit the 4-hour SL.
However, this week the actual price movement was highly fragmented relative to the ADR 866 pips, producing a low trend-continuation environment.
In that context, maintaining a positive balance shows the effectiveness of v2's filter and correlation analysis.
Also, the obtained price ranges shown in the images are only reference values for the full-hold maximum range (MAX value).
However, even without aiming to capture the entire range, operating in line with this system's advantages allowed us to capture the major price moves.
■ Entry Signal Accuracy Evaluation
★★★★☆(4.0/5.0)
Maintained win rate of 57.1% in an environment where ranges and trends frequently switch. The no-entry judgment also functioned, confirming improved filter accuracy in v2.
■ Trade Evaluation
★★★☆(3.5/5.0)
Not a breakout trend week, but managed positive balance in a difficult market. A solid result emphasizing risk management while accumulating profit opportunities.
■ GOLD Market Difficulty
★★★★☆(4.0/5.0)
Many direction changes and difficult conditions for trend-following; challenging week for discretionary decisions alone.
■ GOLD STREAM v2 Weekly Trade Verification Evaluation
★★★★☆(4.0/5.0)
Not a flashy week, but maintained positive balance in tough conditions, and minimized unnecessary signals—high praise.
This aligns with v2's concept of improving how you lose rather than chasing only winning weeks.
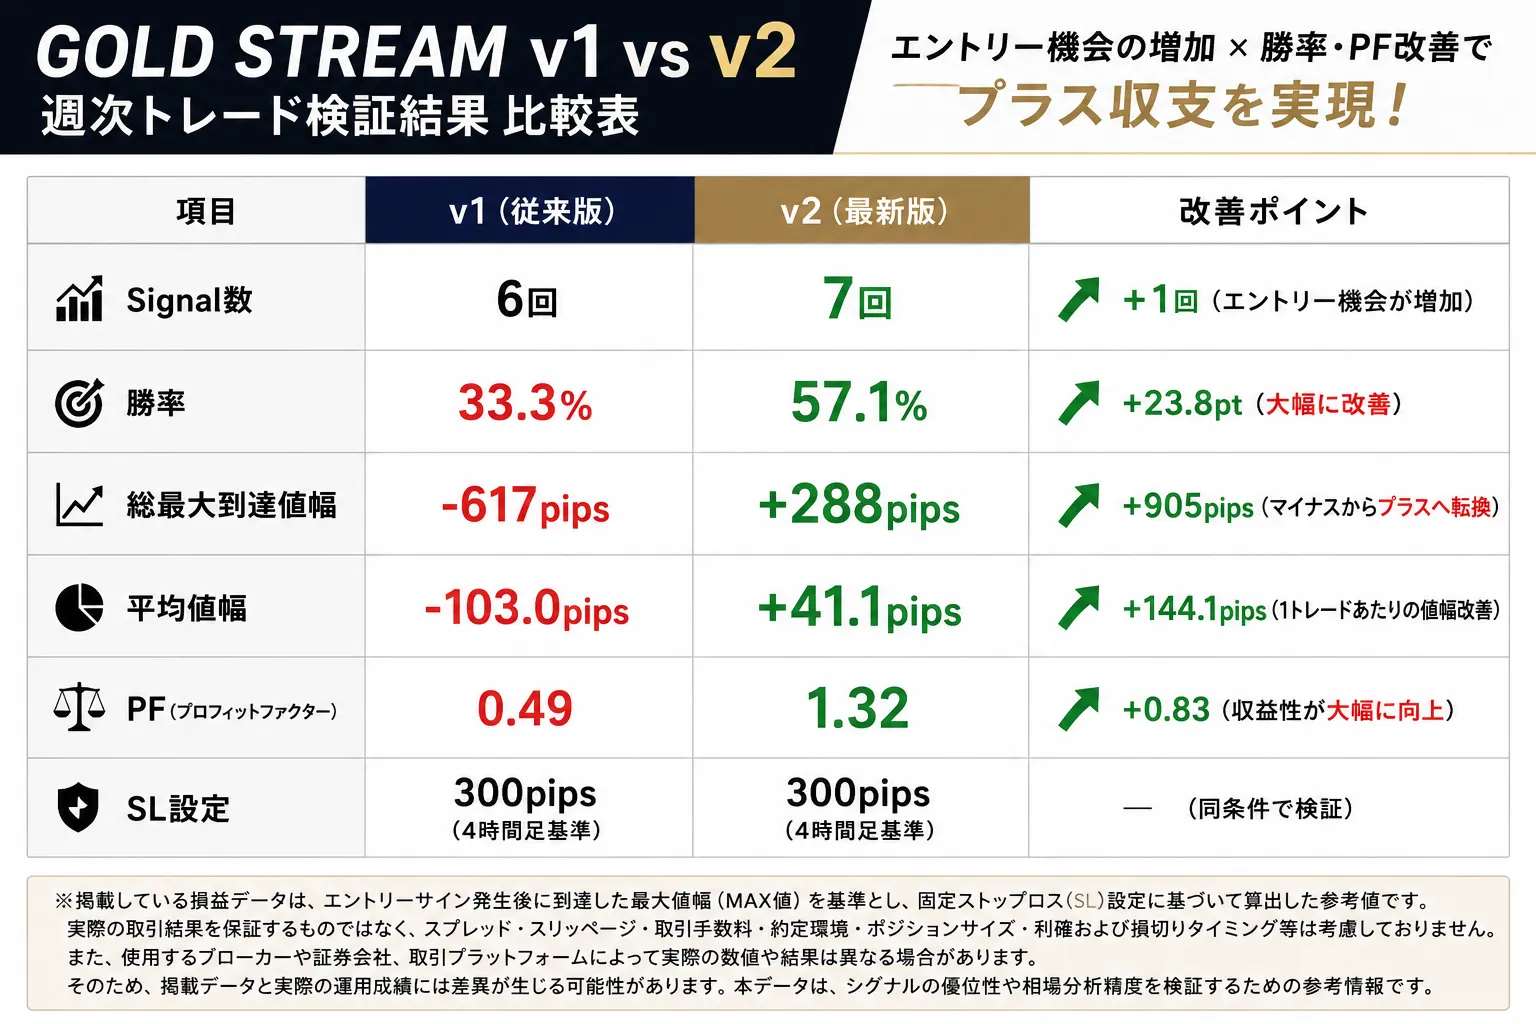
GOLD STREAM v1 vs v2 Weekly Trade Verification Summary
GOLD STREAM v1 vs v2 Weekly Trade Verification Summary
A notable point in this verification is the ability to capture new trading opportunities after a no-entry pause.
In v1, there were 6 signals, butv2 increased to 7 signals, showing flexibility to respond to market flow.
This is not just more trades, but a selective increase in opportunities where the edge was confirmed.
The actual results show that opportunities are seized efficiently without missing market moves, reflecting the system's adaptability to market conditions.
Please also review the historical verification results on the product page.
※ The displayed profit and loss data are reference values calculated based on the maximum attainable range (MAX value) reached after an entry signal occurs, using a fixed stop loss (SL) setting.
They do not guarantee actual trading results, and do not consider spreads, slippage, commissions, order execution environment, position sizing, or timing of profit-taking and stop loss.
Also, depending on trading conditions and price distribution,the actual figures and results may differ depending on the broker, brokerage, or trading platform used.
Therefore, there may be discrepancies between published data and actual operation results.
This data is for reference to verify signal advantage and market analysis accuracy, not a guarantee of future profits. Please use it as a reference when making trading decisions.
━━━━━━━━━━━━━━━━━━━━━━━━━━━━━━
【Preview】
New Tool “AI WAVE” — Examples of Past Chart Applications
Visualizing Target Ranges with AI × FIBO Expansion
Tomorrow's Release
Announcement of the new tool “AI WAVE”
We will pre-release past-chart application examples on the product page to all readers of this verification first.
One note: the following two images are past-chart application examples and are not real-time verifications. Real-time verification for AI WAVE is under consideration.
AI WAVE is,
a settlement-only indicator specialized in deciding where to take profits after entry.
From the wave structure of A→B→C, it automatically calculates expansion (profit target) and displays the setup quality as a numeric AI SCORE.
It is not a tool that generates entry signals, so its role does not duplicate entry-type indicators like GOLD STREAM.
● Application Example 1: When AI SCORE is high (GOLD / H1)
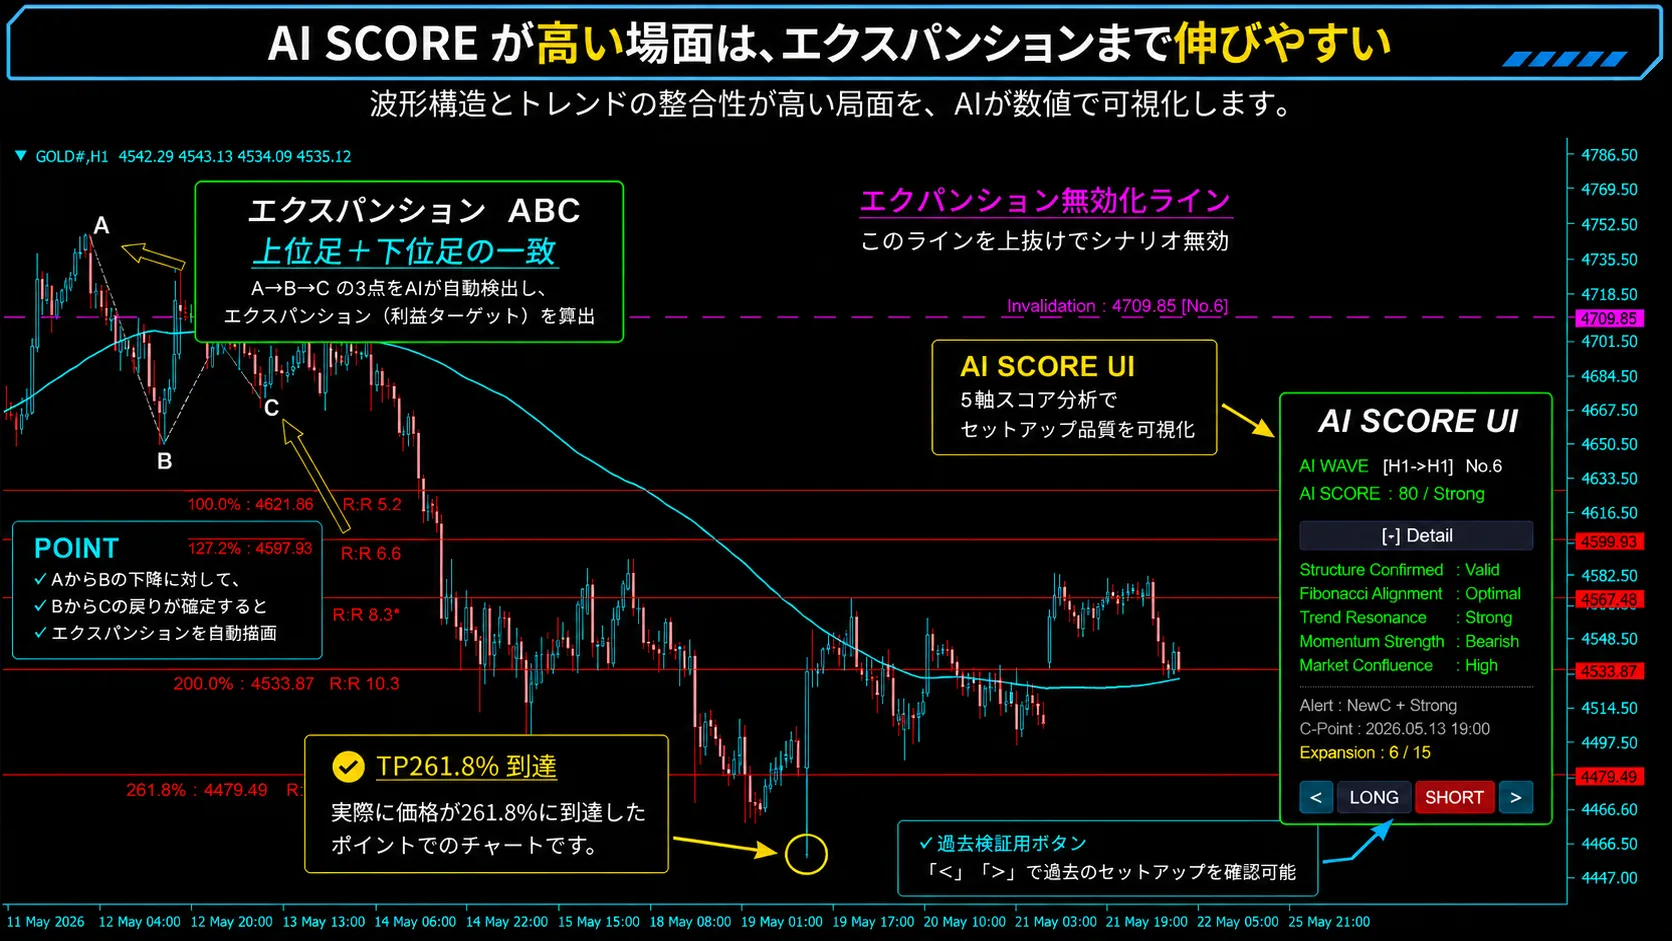
AI SCORE at point C is 80 / Strong.
In this scenario, the price reached the expansion 261.8% target line.
The breakdown of the score (Structure / Fibonacci / Trend / Momentum / Confluence five axes) is always visible on the panel. If the scenario collapses, an invalidation line is automatically displayed.
ーーーーーーーーーーーーーーーーーーーー
● Application Example 2: When AI SCORE is low (GOLD / H1)
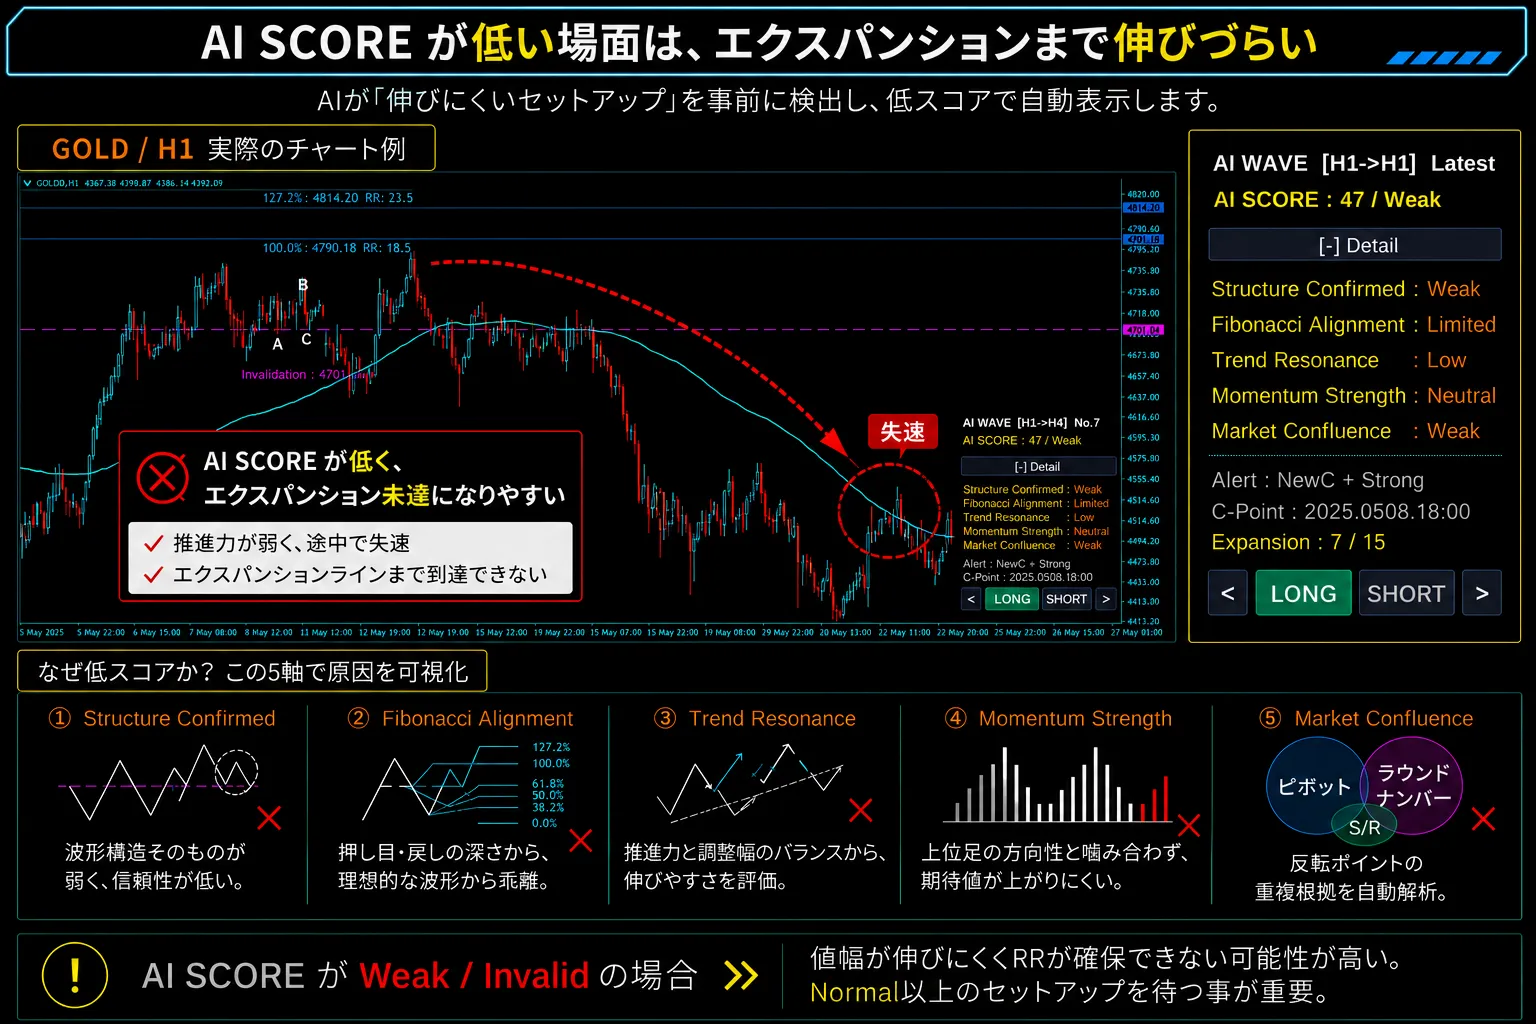
AI SCORE at point C is 47 / Weak. In this scene, momentum did not continue and price stalled before reaching expansion targets.
In AI WAVE, such setups that may struggle to extend are displayed in advance as low scores, providing a basis for target-setting decisions.
━━━━━━━━━━━━━━━━━━━━━━━━━━━━━━━━
Announcement: Sales start Sunday, July 12, 2026, 14:00
━━━━━━━━━━━━━━━━━━━━━━━━━━━━━━━━
AI WAVE will be sold on GogoJungle.
Release price: ¥29,800 (first 20 copies)
▼Product & Details Page▼
https://www.gogojungle.co.jp/tools/indicators/80688
Detailed specifications, supported markets, and FAQs are listed on the product page.
If you have questions, please contact us via the site messaging.
ーーーーーーーーーーーーーーーーーーーー
Disclaimer
The contents of this section are representations and statistics based on past charts and do not guarantee future trading results.
Our products, including AI WAVE, do not provide investment advice; final trading decisions are the responsibility of the user.Depending on market conditions, targets may not be reached or wave detections may not occur.
What is GOLD STREAM?
For short-term GOLD day trading
“Do not hesitate, do not delay, and stay unwavering”
A dedicated system.
Even in volatile markets, it is designed to enter only after establishing justification,
to support highly reproducible trades.
◆ Seven strengths of GOLD STREAM
1. Fully specialized design for GOLD (XAUUSD)
Optimized for GOLD-specific volatility and correlation structureShort-term day-trading logic.
Focus on “immediacy × consistency” often difficult with generic indicators, with practical settings centered on M15 as the main battlefield.
2. Ready → Signal with a two-stage notification
Ready (Preparation): Early notification that conditions are starting to align
Signal (Confirmation): Notification of a complete match for entry decision
➡ Eliminates misses, chasing, and haste,
and makes it a habit to enter after preparation.
【Last week's delivery history】

3. Determine strength and correlation on one screen
Essential for GOLD strategy
Relative strength
Correlation direction
Signal strength
Integrated in a sub-windowwithout repainting.
No need to switch between multiple tools anymore.
4. Visualize practical profit-taking levels with GOLD PIVOT LINE
Day trading: Daily pivot
Target range: Weekly pivot
See at a glance what profit can be reached according to GOLD price movement.
5. ATR-based automatic settlement (Trail EA included)
Basic RR 1:2 or better automatically targeted
Inrange markets are protected by trailing
Eliminates emotional exits
➡Settlement drift as the biggest flawis addressed by the system.
6. Hybrid operation of smartphone × EA
Entry can be done on a smartphone
Settlement trailing EA automatically handles TP/SL/trailing
Allows steady operation even on busy days.
7. Design to cultivate winning techniques
Identify advantageous situations
Proper RR sense
Reduce wasted trades
➡A system to grow the trader themselves.
If you want to end these struggles
Direction matches but gets shaken out
Entering is always late
Exits keep wobbling
GOLD is scary and lacks reproducibility
→ The main cause is often the order of decisions.
Prepare → Correlation match → Confirm → Execute → EA settlement
Just follow this flow, and trading becomes much more stable.
Right now, move GOLD from “feeling” to “repeatability”
GOLD STREAM is not just a signaling tool;
it is an operating system for winning with GOLD.
Please first check the concept and verification on the page.