
A method that determines trends from long-term (average) candles and trades on short-term (average) candles! Does it also work in Bitcoin markets?
Hello everyone, trendy! In contrast to that person, hair is thick and fluffy@xi10jun1.
This time, it will be a more practical report column.
Using Heikin-Ashi and the longer and shorter time frames for technical trading!
This week (February 3, 2017 to February 9, 2017) performance
First, as usual, the performance. I’ll publish the gains and losses first.
- Last week (until February 2, 2017) assets: 61,414 yen
- This week (until February 9, 2017) assets: 65,770 yen
- Change: +4,356 yen
Assets reached a new high! It climbed into the 65,000 yen range! I captured a big move from February 3, and otherwise I’m steadily making progress.
Starting from 50,000 yen and gaining about +30%. Feeling good! I’ll surpass 100,000 yen by the end of the year! Catch up and overtake 1 BTC!
※ Current value differs slightly, but I forgot that a 0.1 BTC long position remained, and during the crash my assets decreased... This kind of mistake leads to asset reductions, so always confirm your current positions before closing the screen.
Practical trading using timeframes!
So, this column will be a practical guide on judging trends from longer (Heikin-Ashi) candles and trading with shorter (Heikin-Ashi) candles.
This week I also took various screenshots, so let’s look at the February 4 trade that made the chart the easiest to understand.
Moreover, it will continue to be Heikin-Ashi charts.
February 4, 2017: 1-hour chart
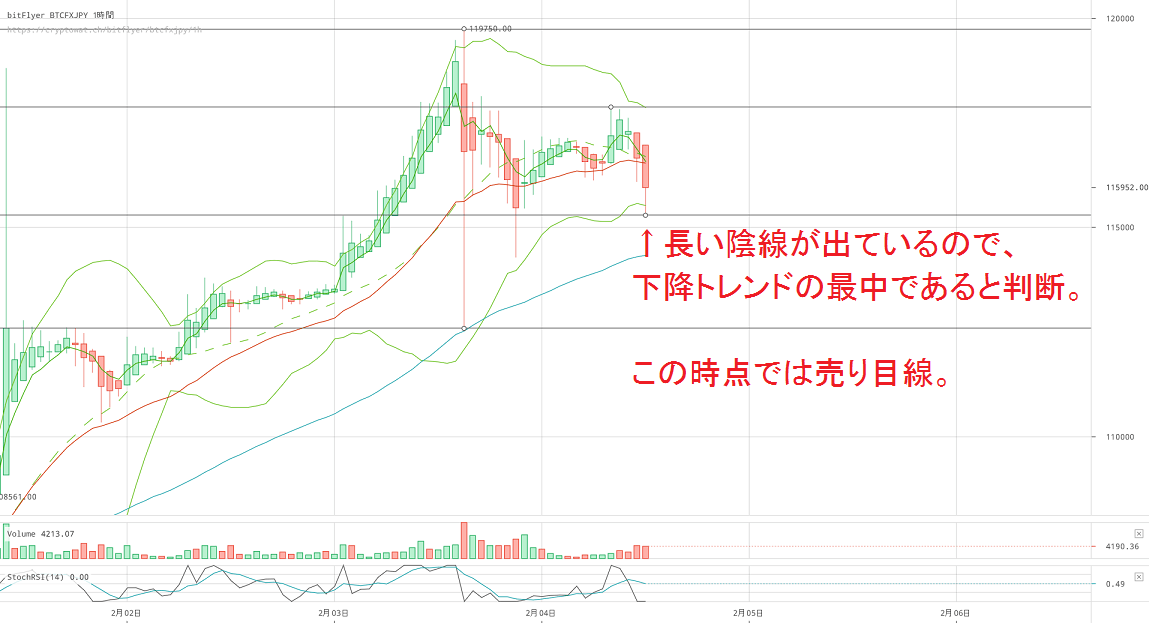
What we’ll use this time is the 1-hour chart from February 4, 2017.
First, determine the trend at this point. Here a bearish candle appears, so we judge that we are in a downtrend.
Compared to the recent bullish candle, the candle is longer, indicating strong selling pressure.
By the way, the tip of the candle is not the absolute lowest price. The current price is a bit higher, so let’s narrow the time frame further to look more closely.
February 4, 2017: 30-minute chart
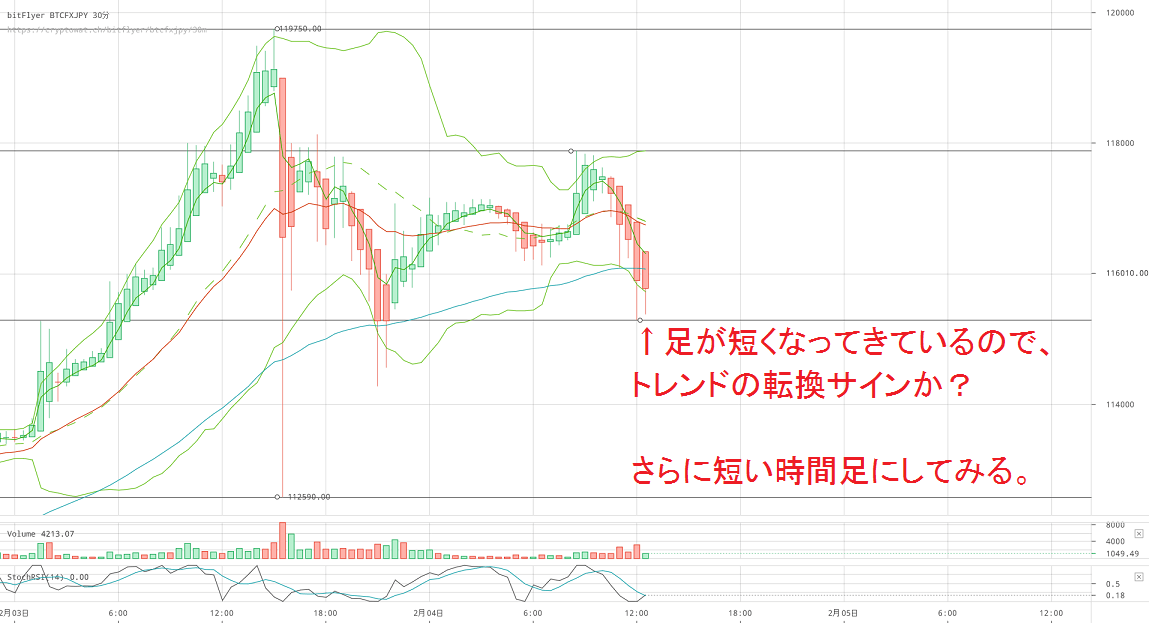
Next, the 30-minute chart.
In the arrowed area, the candle lengths shorten. It’s a bit hard to see, but the current price here is 116,010 yen. It’s about halfway of the candle lengths.
Because the trend might be changing, let’s look at an even shorter time frame.
February 4, 2017: 15-minute chart
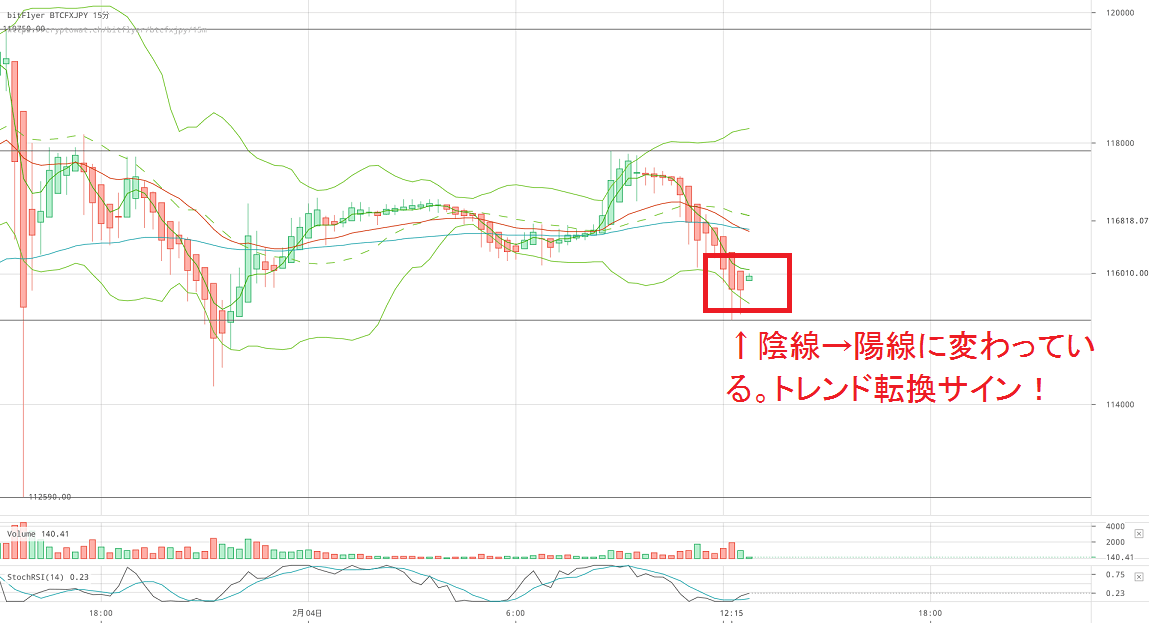
Looking at the red-framed area, you can see the Heikin-Ashi trend reversal signal: a bearish candle followed by a bullish candle.
When you see such candles, you might want to take a position cautiously.
Even so, at this point it’s still questionable whether the trend has truly reversed. The candles after the reversal are still short. Let’s inspect more closely.
February 4, 2017: 5-minute chart
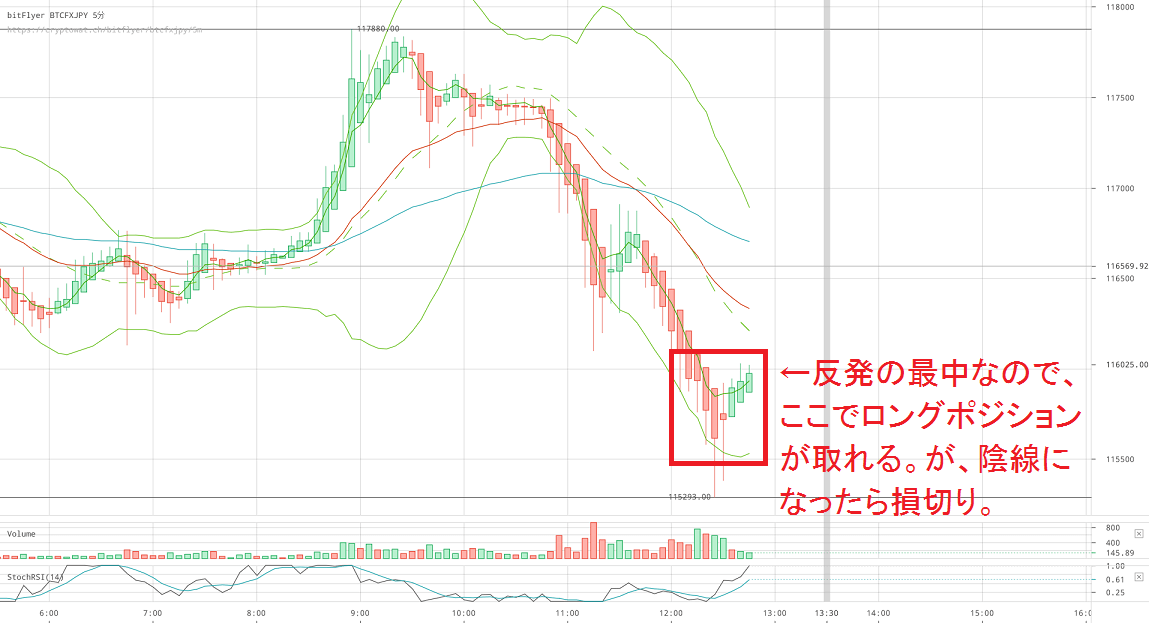
In the red-framed area, there is a beautiful trend reversal signal: bearish candle → doji → bullish candle.
At this point you could take a position, but you should also be wary of a possible third decline.
Let’s zoom in further.
February 4, 2017: 1-minute chart
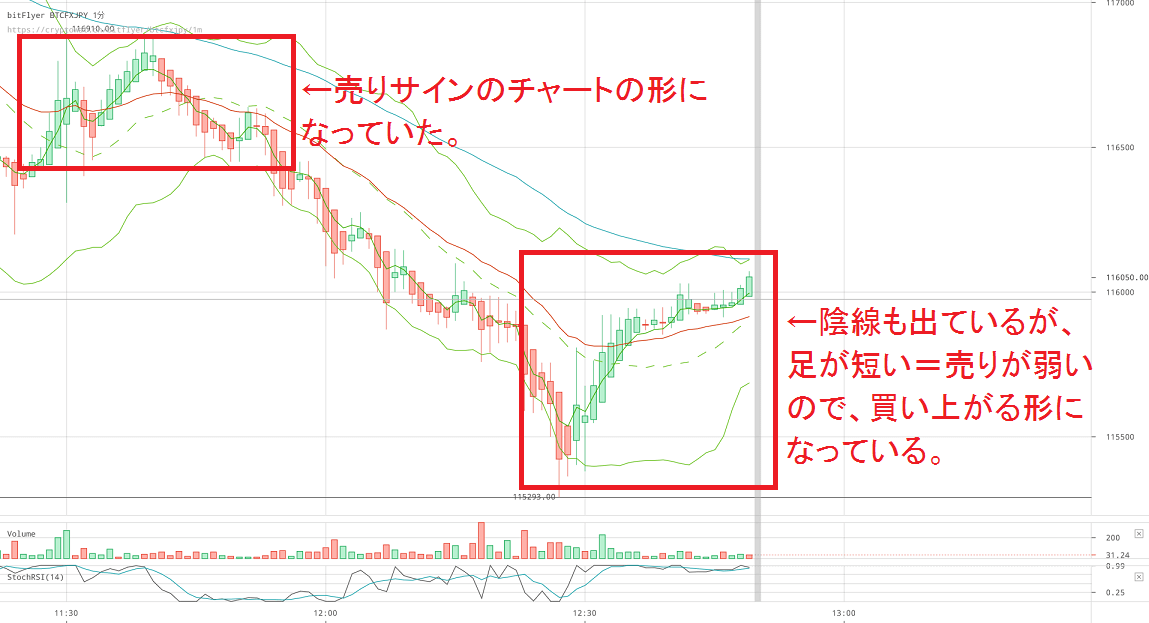
Looking at the 1-minute chart, the red-framed part from the previous 5-minute chart has turned into an upward pattern. Even though a bearish candle appeared, the price is not falling.
On the left side of the screen, the chart forms a selling signal pattern.
If it’s forming this shape, you should be wary of further selling, so you can aim for a short position.
Free summary: Trade with clear trends
It’s great that we could capture a clear chart shape again this time.
As in the last minute of the 1-hour chart, find situations where the trend is easy to identify and confirm with even shorter candles for trades with a good chance of success.
Looking at the chart, the urge to quickly enter a position is a bad habit. I tend to do it too, but first calmly assess the market.
To that end, first look at the longer time frame (1 hour or more) to grasp the overall trend, and then gradually judge the market with shorter time frames (1 minute to 30 minutes). This alone will prevent unnecessary losses.
In this case, I did take a position after the 1-minute chart, but what happened next is explained in the paid section. If you’re interested, please consider subscribing to the paid content as well.
Endnote 1: Shopping with Bitcoin
Actually, on overseas e-commerce site "FANCY," you can purchase items with Bitcoin! It does incur shipping, but there are stylish items you won’t see in Japan!
Instructions for using FANCY are summarized on this blog, so please refer to this.
- →Explaining FANCY account creation, registration, settings, and how to purchase! | Investor Jun of the Yutry Generation
- →How to purchase items on FANCY with Bitcoin (Bitcoin payment) | Investor Jun of the Yutry Generation
※ Free content ends here. After this, there is detailed analysis and future outlook, so it is paid content. If you’re interested in reading more, please consider subscribing. Also, tips or small donations are very encouraging! Thank you for your continued support!