
July 13 (Mon): 【BB&HM】 Nikkei 225 vs Russell 2000
This time
we will compare with the so-called “canary in the coal mine” in a bear market
'Russell2000'
.
【Overall Scenario Probability】
This week's overall market is…
“Up: 60% / Down: 40%”
※Scenario for an upward trend starting after the completion of the S&P 500 triangle and the end of the NASDAQ corrective wave is aligning in direction, and with Bitcoin's rise providing additional support
※Presented as a reference level.
【This Week's Market Focus Points】
This week's market shows the S&P 500 breaking above a key level of the triangle, making the possibility of an upward trend starting after the correction wave completion more visible. Movements supporting an upside scenario are emerging across multiple markets, and the main question is whether last week's reversal to the upside will develop into a full trend reversal.
The Nikkei 225 also shows a waveform expected to develop into an expansion, and including Bitcoin and GOLD movements, this week's price action should clarify the overall market direction.
Details will be explained in the paid section.
➥For more, details are provided in the members-only report.
If you have not registered yet, please click here ↓
【Integrated Version】
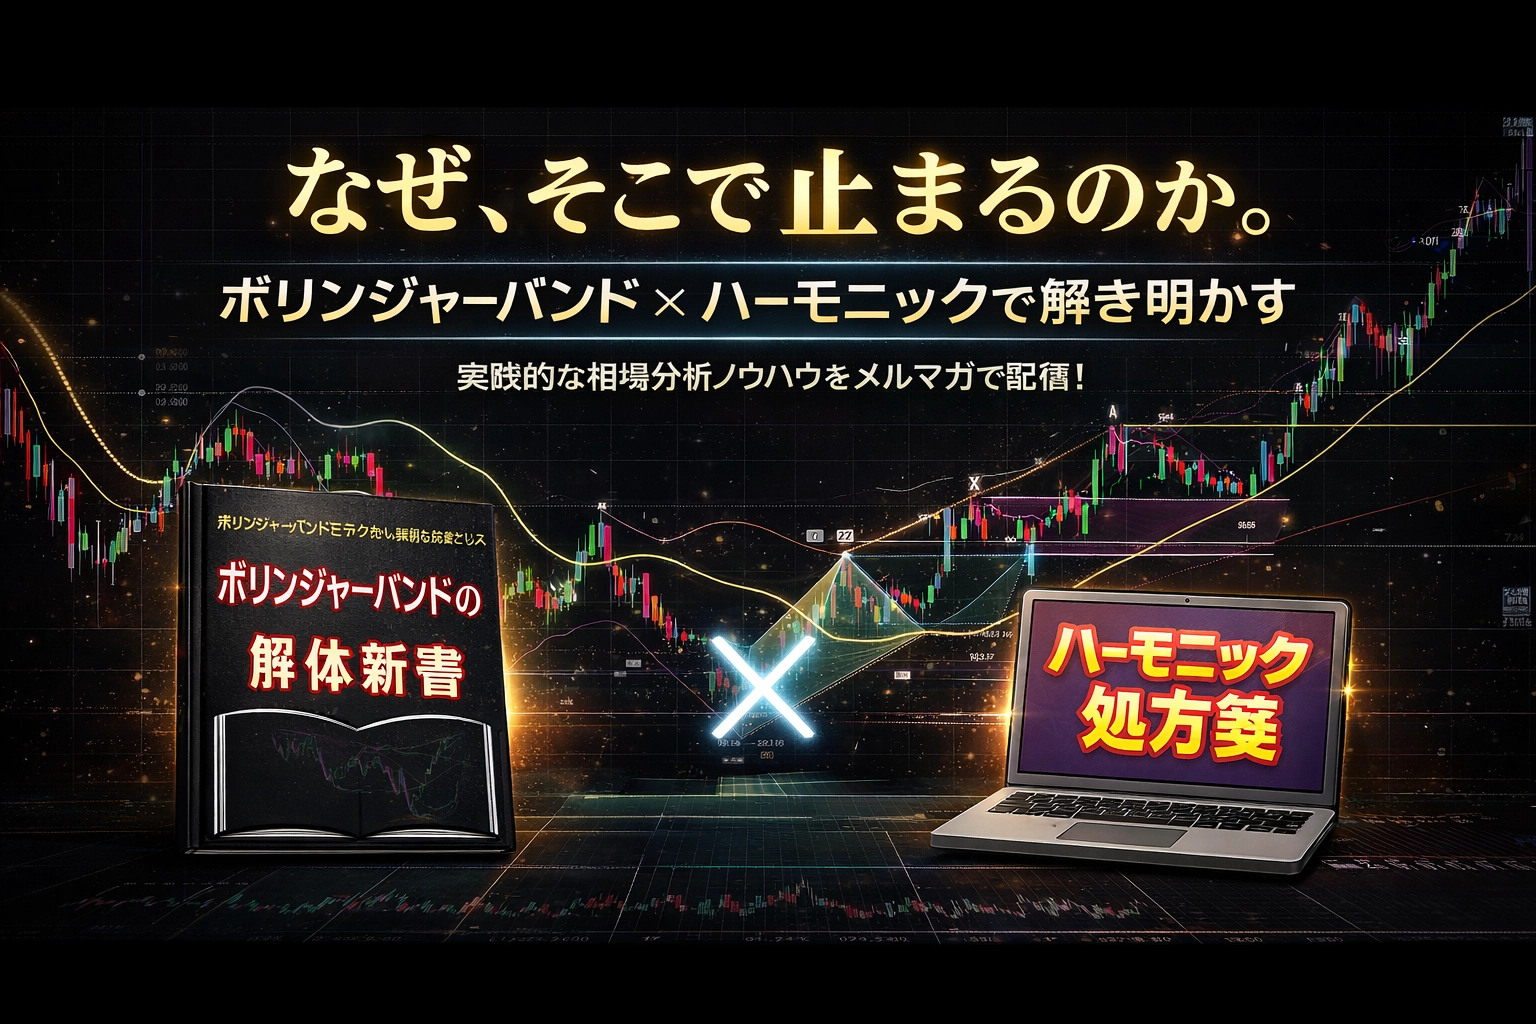
“Why does the market stop there?” Bollinger Bands × Harmonics: a fusion of statistics and geometry to pinpoint turning points with high precision!
https://www.gogojungle.co.jp/finance/navi/series/1613?via=articles_detail_aside
(※From here on, it is for members only.)
--------------------------------
【Situation Awareness】