

2026/7/11 Dollar/Yen, Gold, SP500, and Nikkei 225 Environment

Currently, we are trimming certain features and steering toward lightweight performance.
As planned, it is expected to be lighter than Trendline Pro 2.
There were requests for signals using scores, so we are currently moving toward implementing that.
For behavioral verification, we prepare weekly videos of the USD/JPY price movement.
USD/JPY
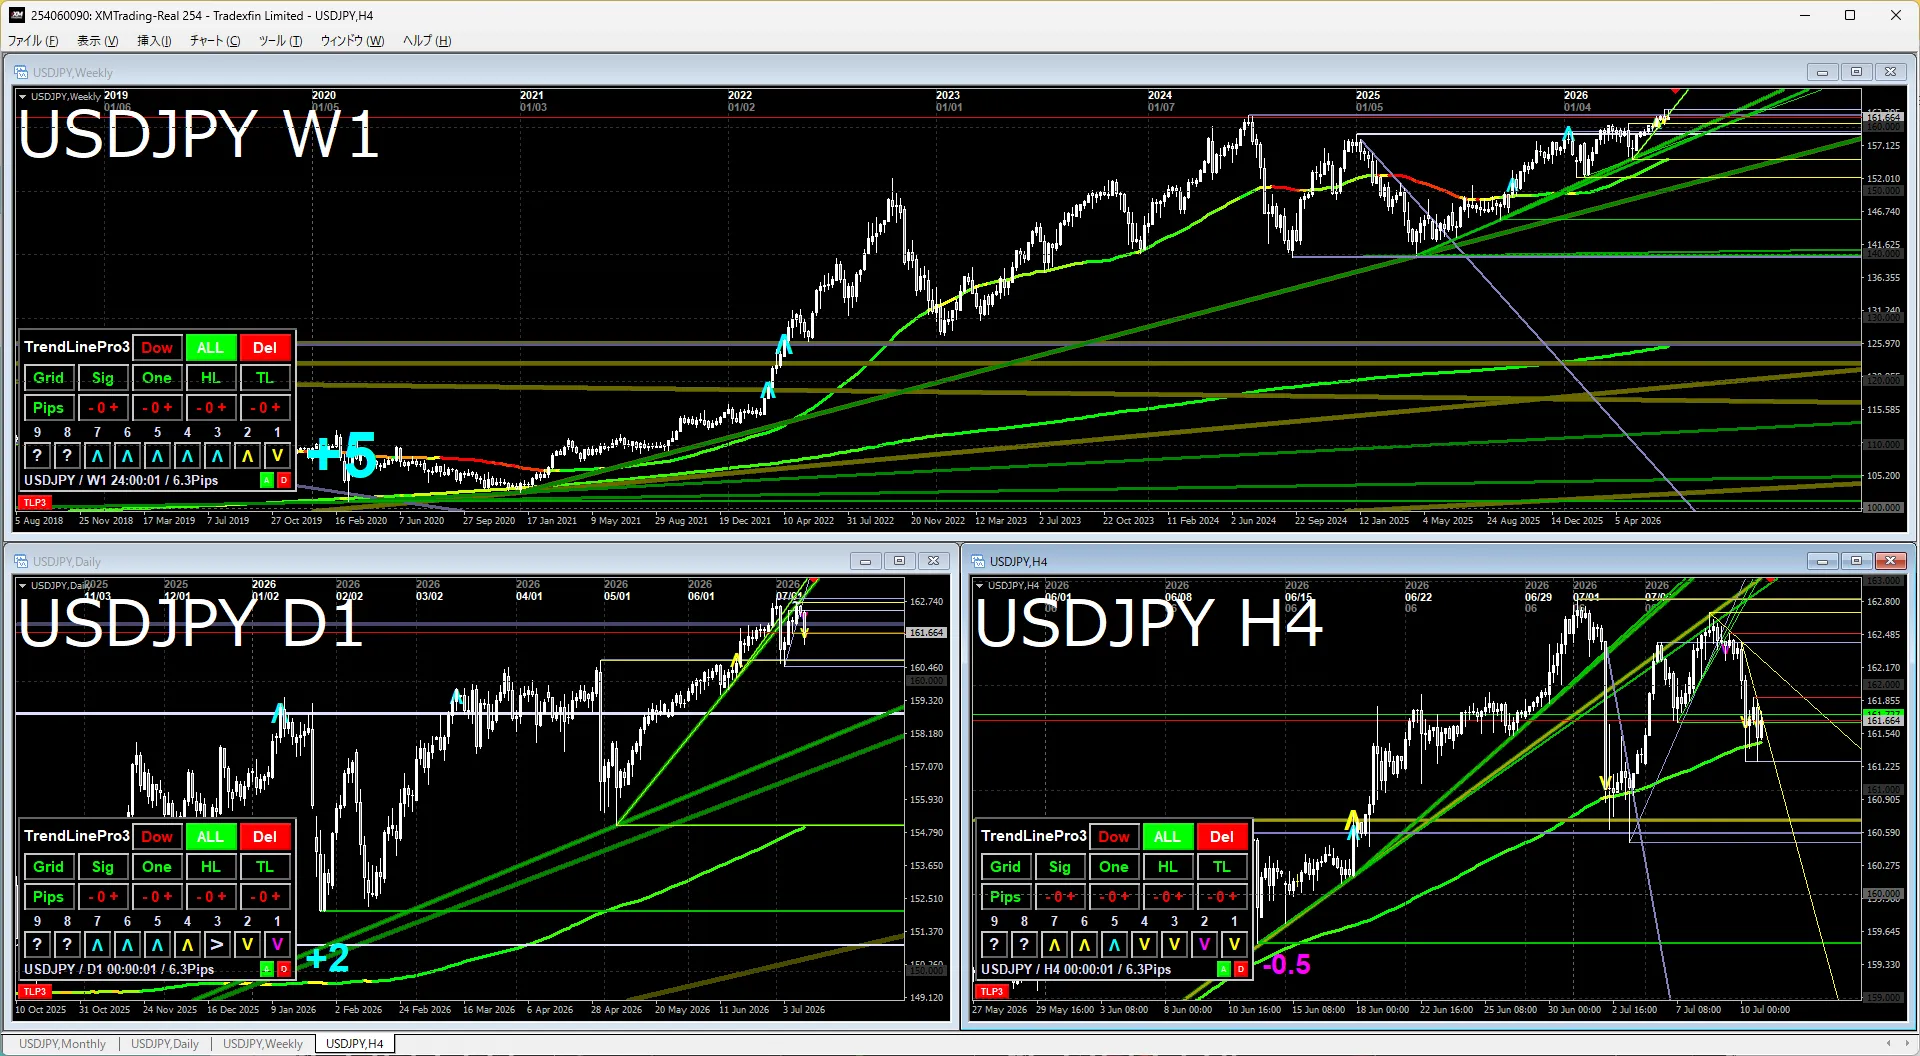
WeeklyThe trend is continuing upward. The monthly high was updated, but on the weekly chart it was just a wick. Nevertheless, since it has already broken upward, there is a basis for further rise.
Daily and 4-hourIt appears to be supported by the yellow horizontal line (support turned resistance) and the 4-hour MA. The minimal correction period is over, so there is a non-zero possibility of testing the downside in the medium term, but more likely it will rise smoothly or remain flat.
Gold
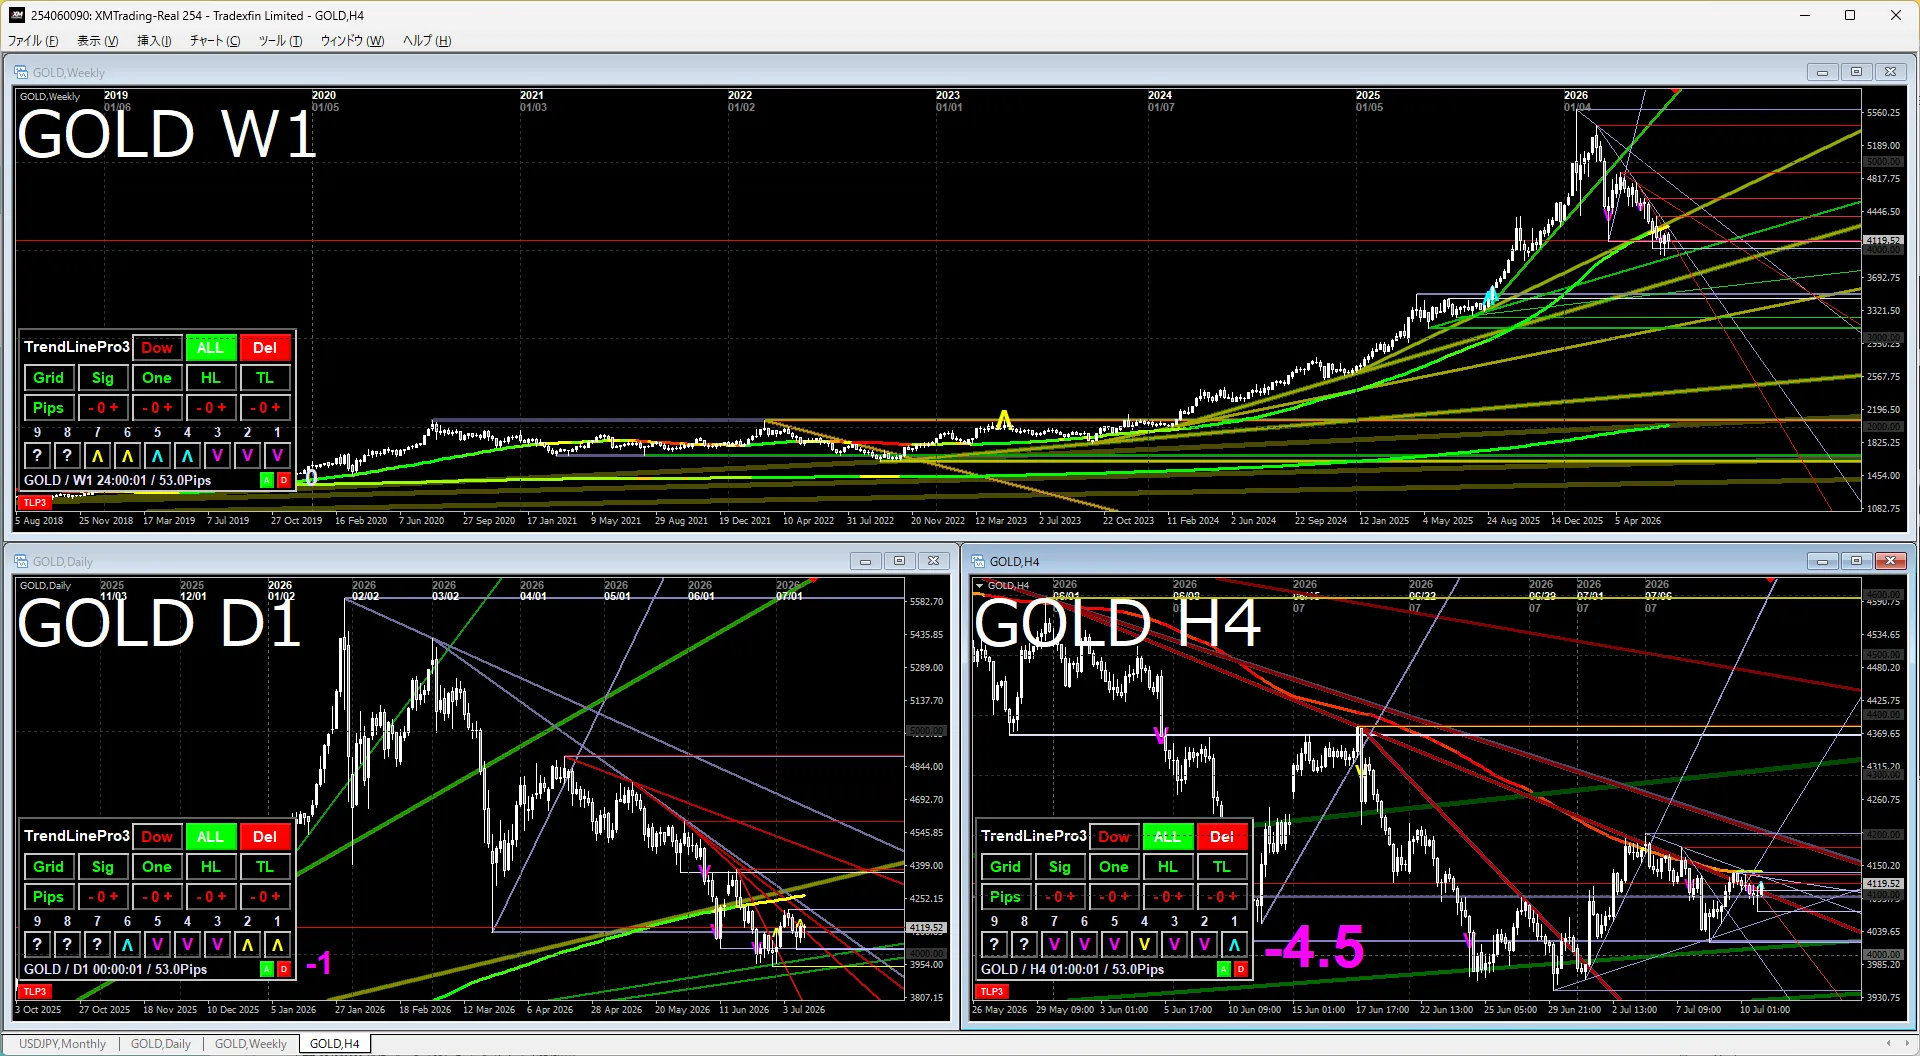
WeeklyWith currency value depreciation being watched, gold is expected to rise in the long term. However, the overheated sentiment has cooled, and a long-term correction may be starting. The score is zero with no clear direction. The green trendline may be watched as a key reference.
Daily and 4-hourWe are watching whether the daily green or red triangle will be broken first. If it breaks upward, it would be a good time to buy on dips. If it breaks downward, around 3,500 is a notable target area. Personally, I am starting to add to long positions from a longer-term perspective.
S&P 500
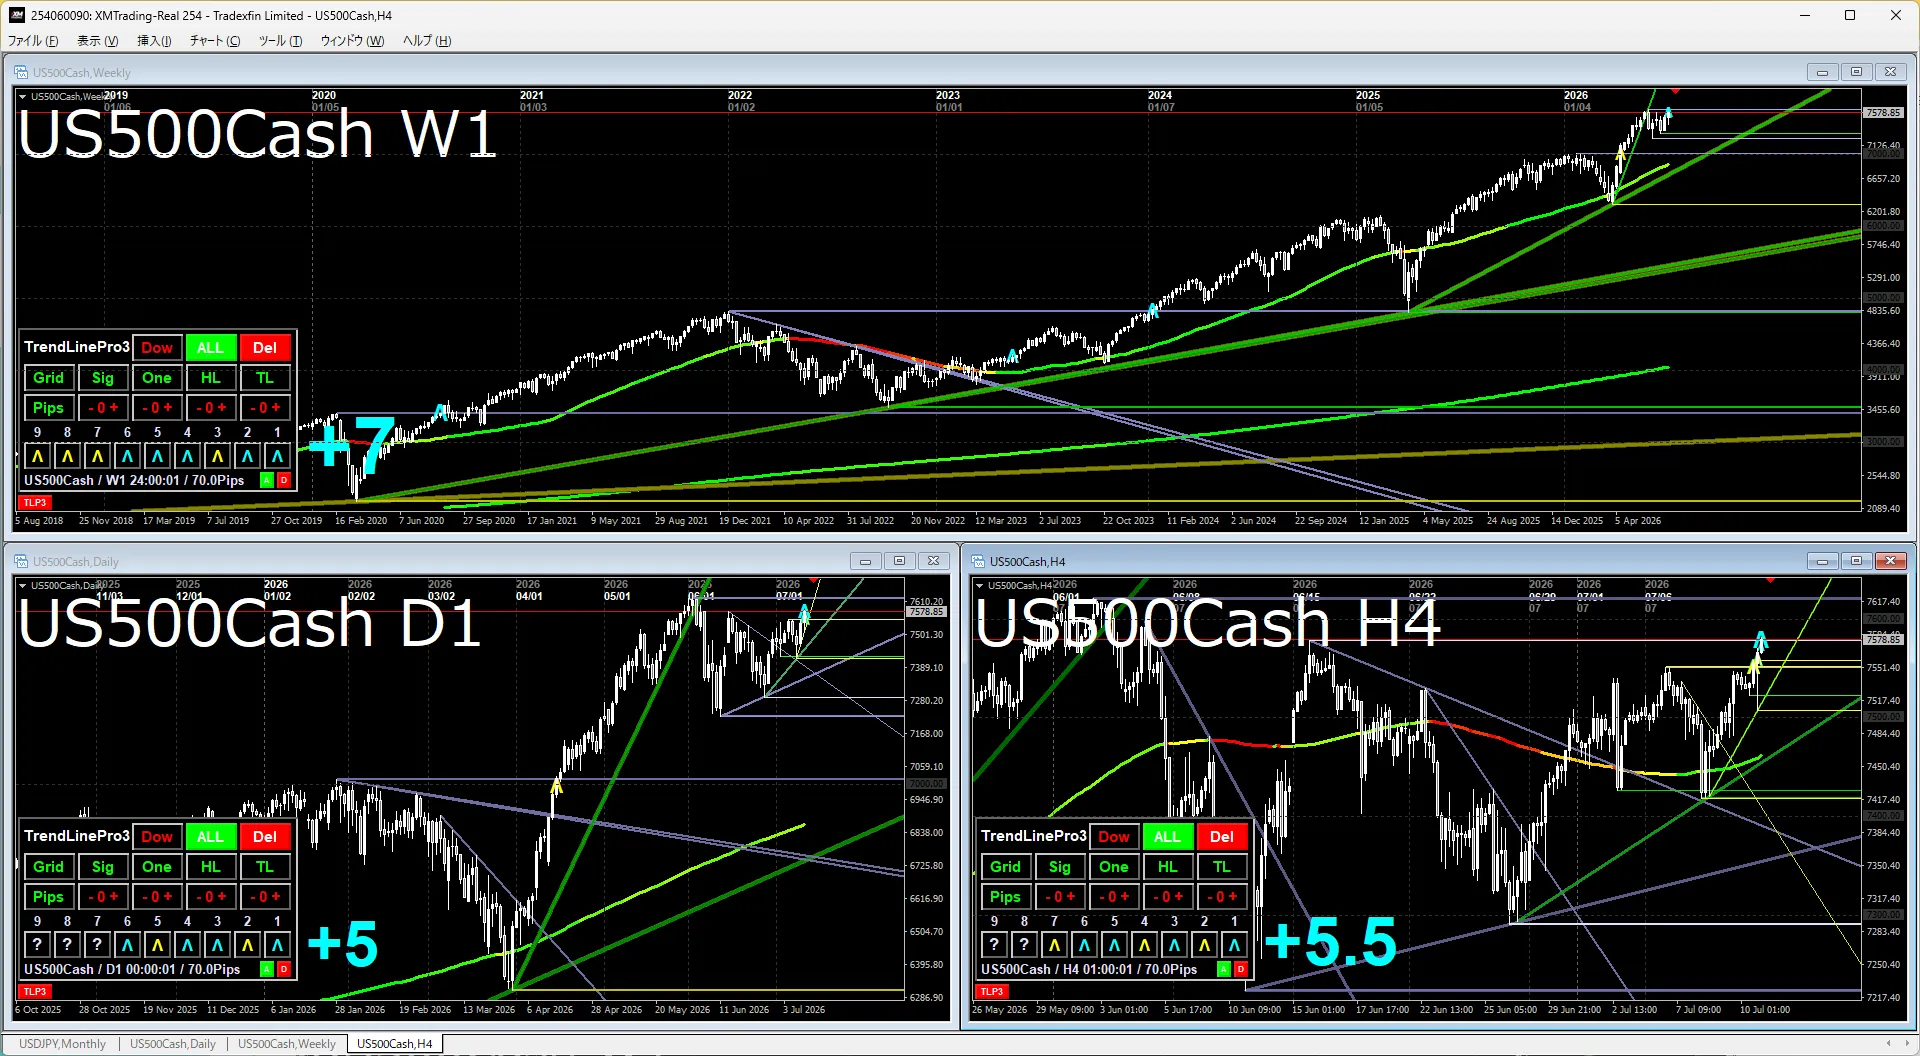
WeeklyThe latest high has been exceeded and the upward trend is confirmed. Culturally, buying tends to be more prevalent here.
Daily and 4-hourIf it surpasses the recent high near 7,580, buying becomes easier. When the high is updated, around 8,500 becomes a notable level to watch. The market seems ready to continue upward if nothing disrupts it.
Nikkei 225
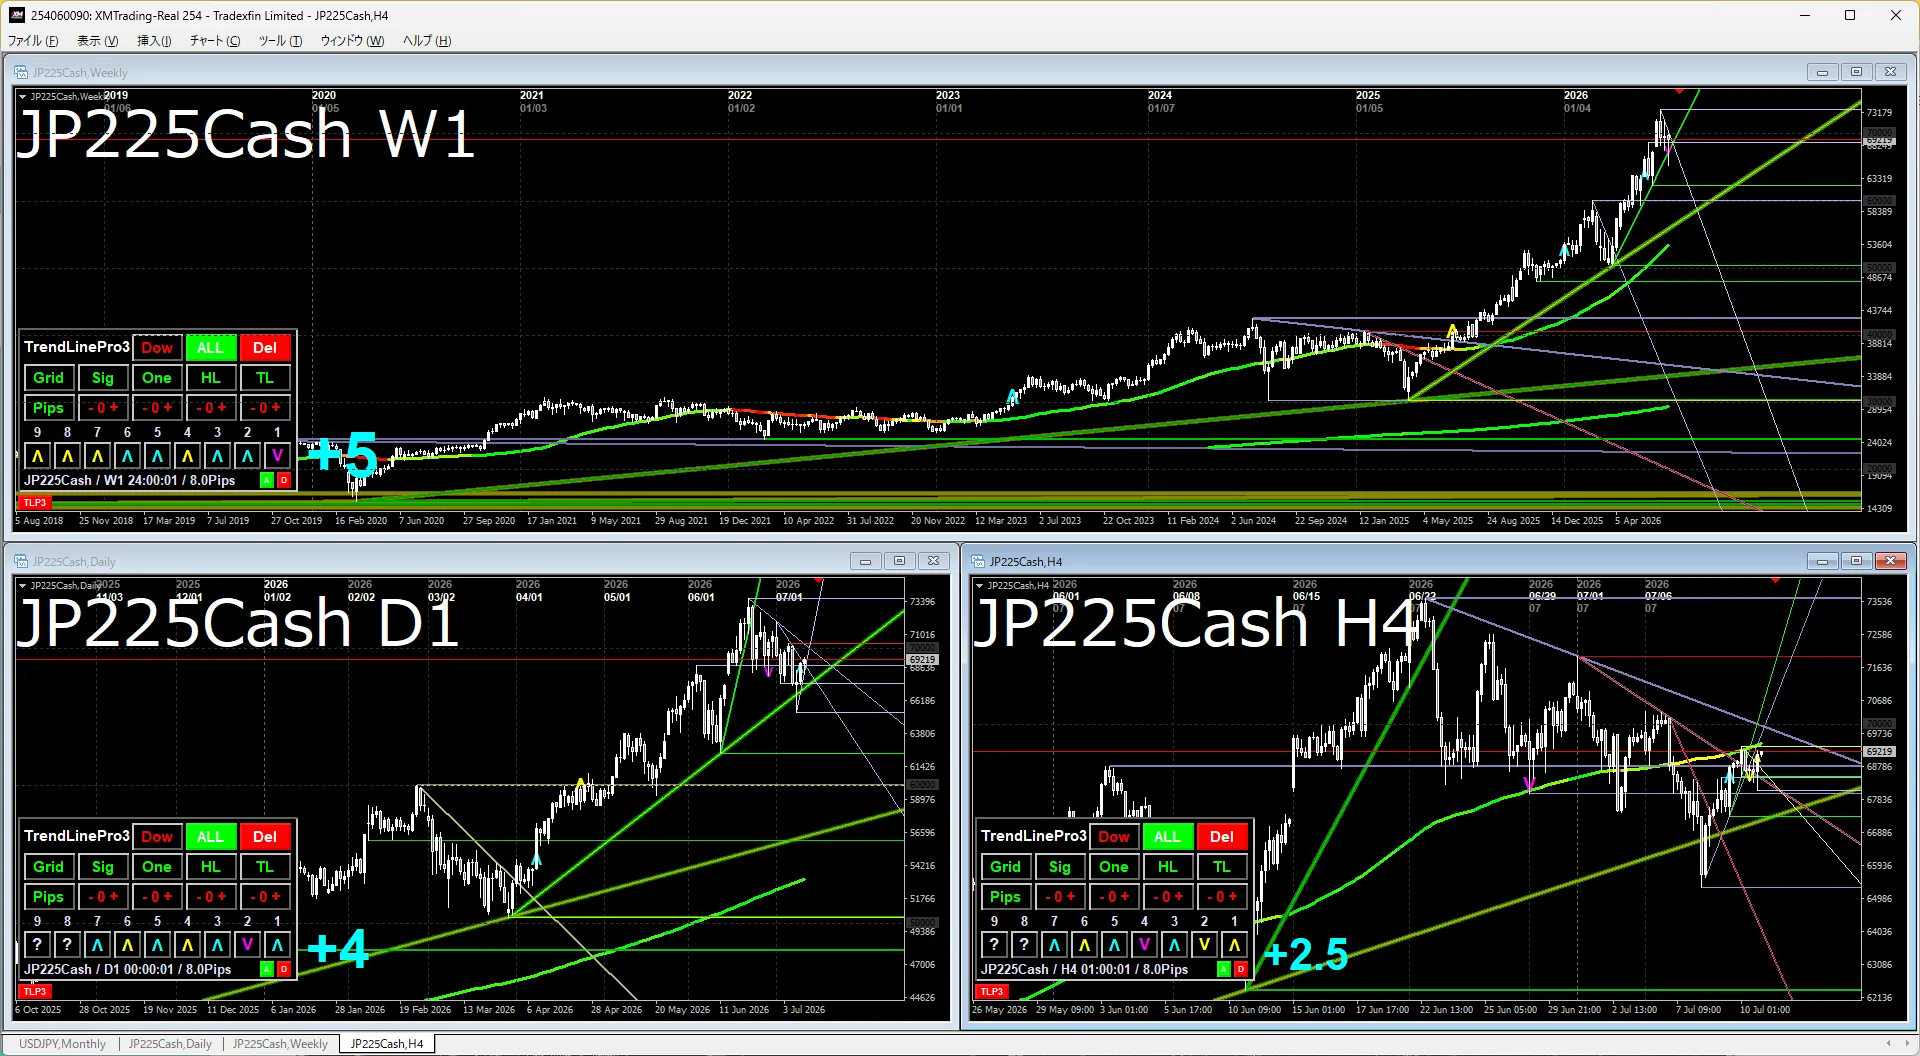
WeeklyThe upward trend continues, but it is unclear whether it will rise to the near-term ceiling of 80,000 in one jump.
Daily and 4-hourLast week's sideways movement has settled the market a bit, and in the near term the green daily trendline and the blue downward-sloping trendline are likely to be watched. The blue line is more prone to break than the green, so a breakout above around 72,000 could trigger buying pressure.
The attached image indicators use the indicators listed below.
If you’re interested, please take a look.