
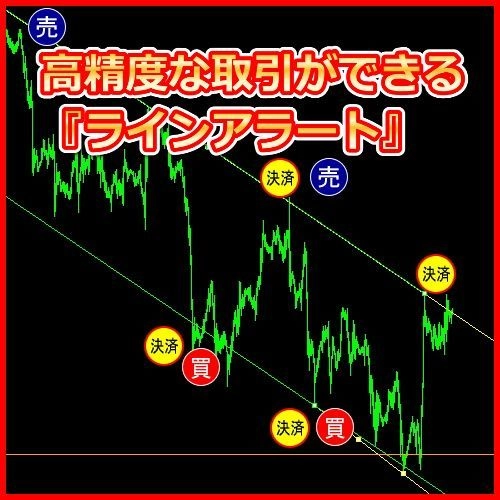
Sales exceeded 260 units!! 【'Line Alert' enables highly accurate trading from trend pullbacks, pullbacks, and counter-trend entries with a line indicator】
“How to attack: which line, in which direction”
A line-and-tilt bottom-top sign indicator that organizes at a glance
Channels, trend lines, highs/lows, horizontal lines.
Even though you understand every line is important,
“Ultimately, where should I enter?”is the most troublesome part.
The ‘Line Alert’combines four kinds of lines
and the天底サイン
to surface only the points of “pullback, retracement, and counter-trend” on the chart.This is a tool for that.If you were to summarize this indicator in one sentence…“A line-specific radar that organizes both trend-following and counter-trend on the same screen.”It’s like a concept image.▼ The four lines and天底サイン have the following rolesチャネルライン:Indicates the range of the pullback/retrace within a trend,acts as a guide for how far to wait.トレンドライン:Visualizes the main direction of the price movement,clarifying the direction to aim for in a trend-following trade.最安値・最高値ライン:Shows the most recent “notably watched” low and high, indicating take-profit and counter-trend candidates.節目の水平線:Visualizes price levels that have repeatedly faced resistance/support,and functions as lines that break away easily when penetrated.天底サイン:Marks major turning-point candidates in the market with a round symbol,giving guidance on how far to carry a position.▼ In actual trading, you can use it in this flow1. First, decide the direction from the orientation of the channels and trend lines“Are we aiming up today, or down?”.2. Once the direction is decided, wait for the price to approach the lines.Focus only on the moments when it touches lines such as pullbacks/retracements/new highs/new lows.“the moment it touches the line”.3. Combine with the天底サイン and other indicators to determine“whether this line tends to rebound” or “whether a breakout would run”enter.View the lines not as vague guides, but as four lines with distinct roles plus the天底サイン,making the decision for pullbacks/retracements/counter-trends simpler..※This indicator is an aid to organize “which price bands to focus on” through line drawing and signal display.※Final buy/sell decisions, lot size, and capital management are at the discretion of the user.This is a tool for that.
-
チャネルライン:
Indicates the range of the pullback/retrace within a trend,acts as a guide for how far to wait. -
トレンドライン:
Visualizes the main direction of the price movement,clarifying the direction to aim for in a trend-following trade. -
最安値・最高値ライン:
Shows the most recent “notably watched” low and high, indicating take-profit and counter-trend candidates. -
節目の水平線:
Visualizes price levels that have repeatedly faced resistance/support,and functions as lines that break away easily when penetrated. -
天底サイン:
Marks major turning-point candidates in the market with a round symbol,giving guidance on how far to carry a position.
1. First, decide the direction from the orientation of the channels and trend lines
“Are we aiming up today, or down?”.
2. Once the direction is decided, wait for the price to approach the lines.
Focus only on the moments when it touches lines such as pullbacks/retracements/new highs/new lows.“the moment it touches the line”.
3. Combine with the天底サイン and other indicators to determine
“whether this line tends to rebound” or “whether a breakout would run”enter.
View the lines not as vague guides, but as four lines with distinct roles plus the天底サイン,
making the decision for pullbacks/retracements/counter-trends simpler.
.
※Final buy/sell decisions, lot size, and capital management are at the discretion of the user.
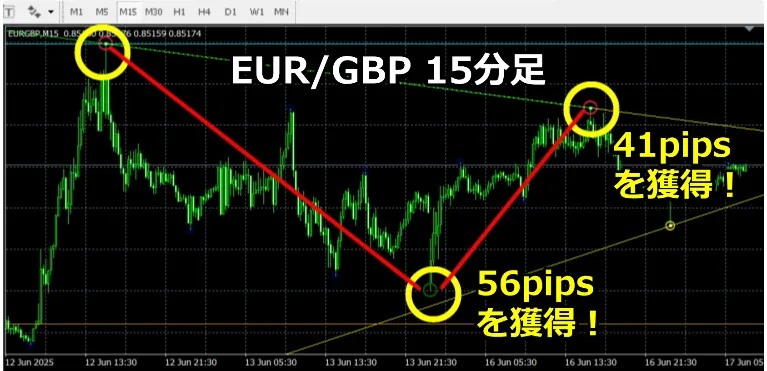
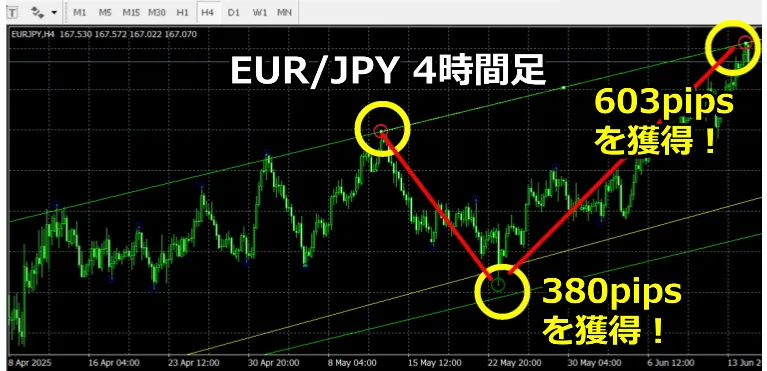
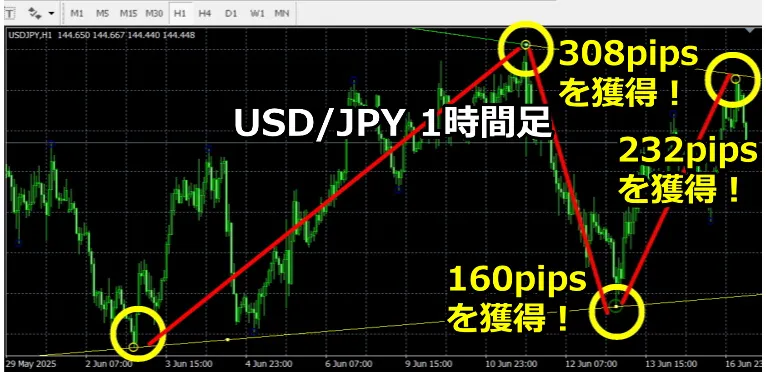
First, a report on recent results!
The product page contains recent results; please take a look.
August 11, Reiwa 5, product page renewed!
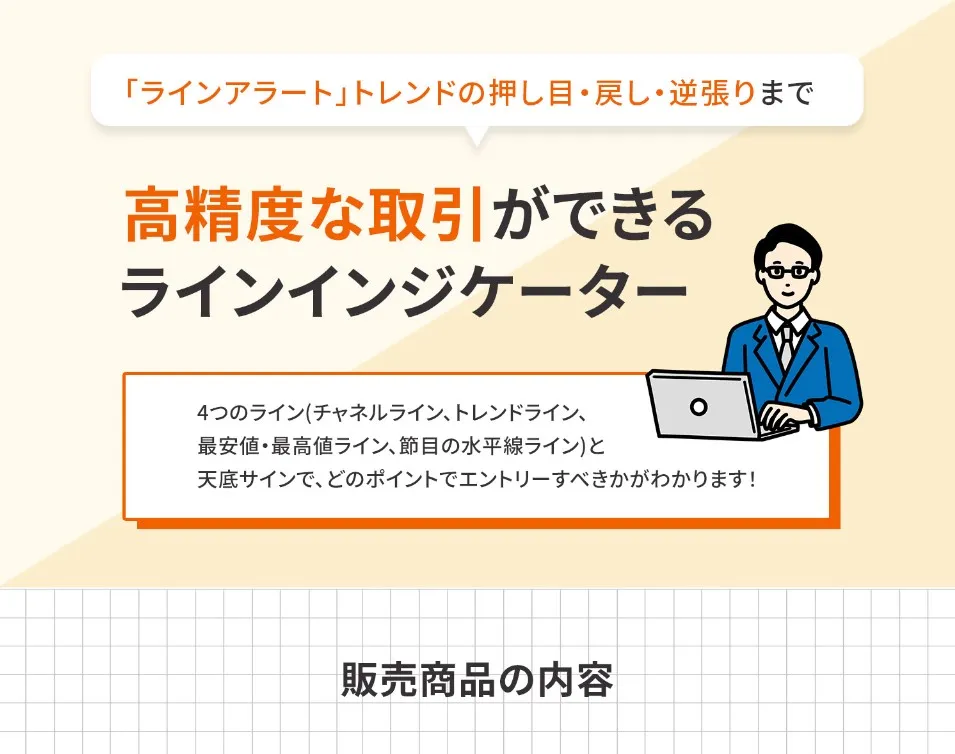
With four lines (channel line, trend line, least/highest line, and pivotal horizontal line) and天底サイン, you can know at which point to enter!
<Upgrade information>
On August 12, 2022, updated to the no-repaint version of 天底サインインジケーター. .
※This is an online community target product※
The following two products are bundled together.
① Line Alert Indicator
② 天底サイン Indicator
<Product description video (no voice except the initial ad)>

Click here to purchase!
https://www.gogojungle.co.jp/tools/indicators/37454
① Line Alert Indicator
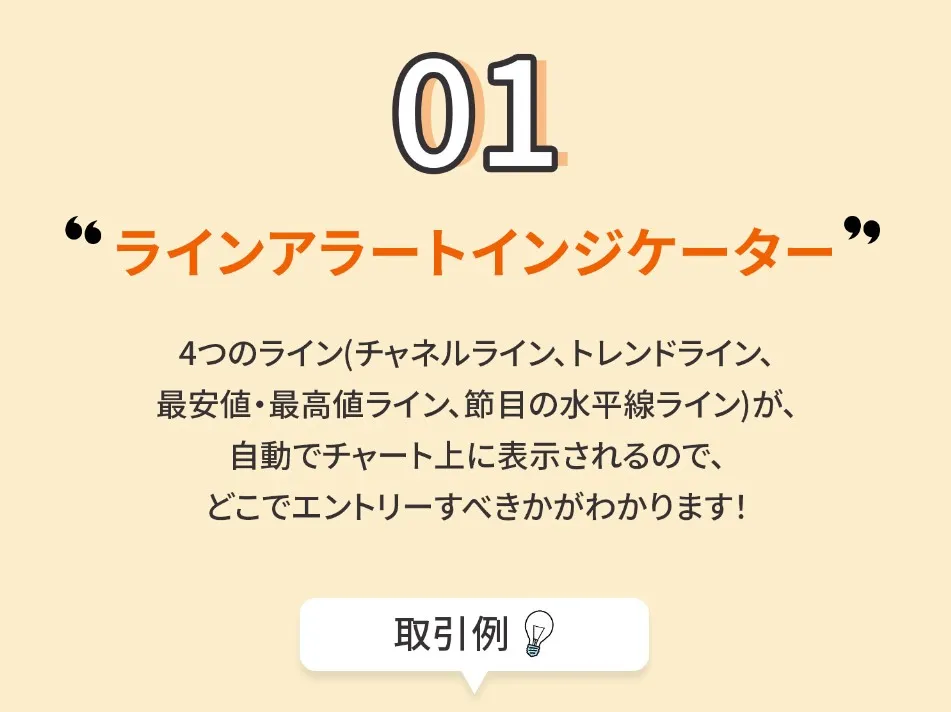
Four lines (channel line, trend line, least/highest line, pivotal horizontal line)) are displayed automatically on the chart, showing where to enter!
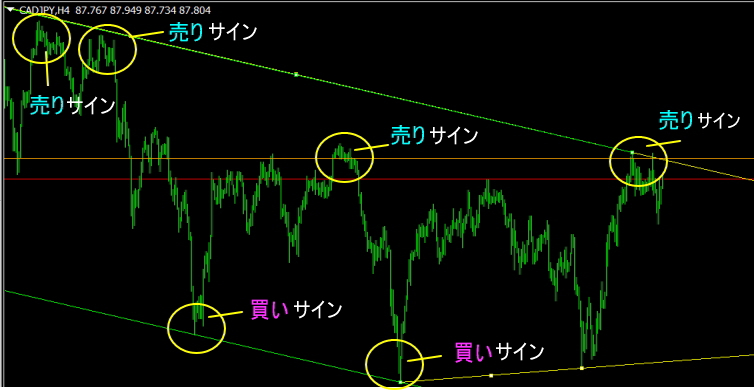
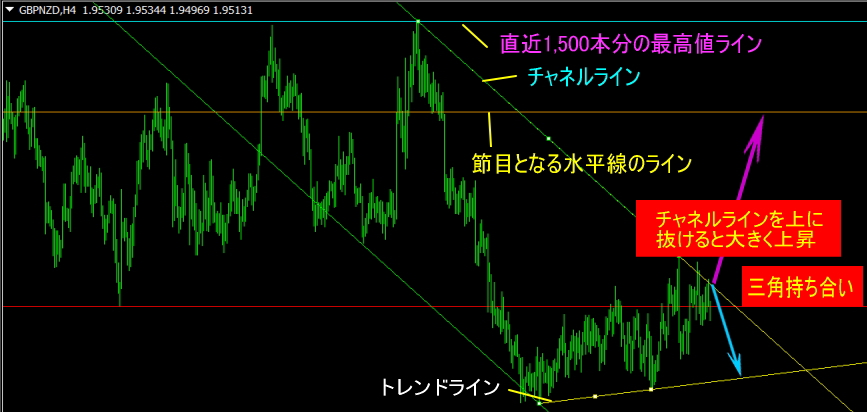
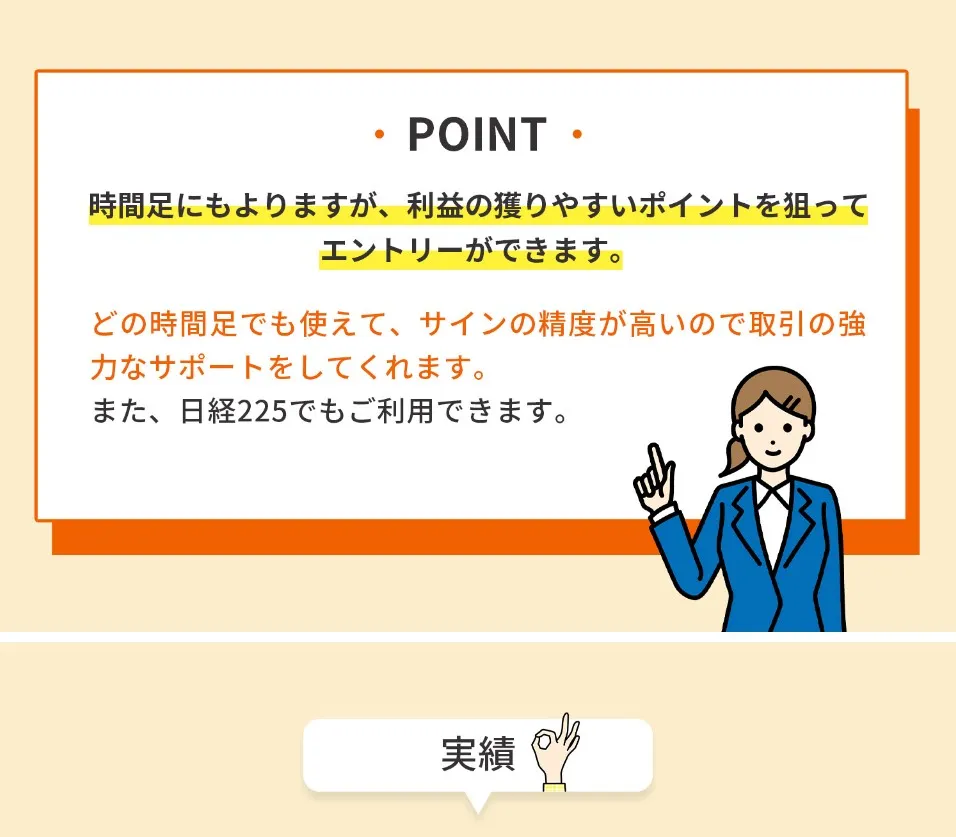
Can be used on any timeframe, and the signal accuracy provides strong trading support. Also usable for Nikkei 225.
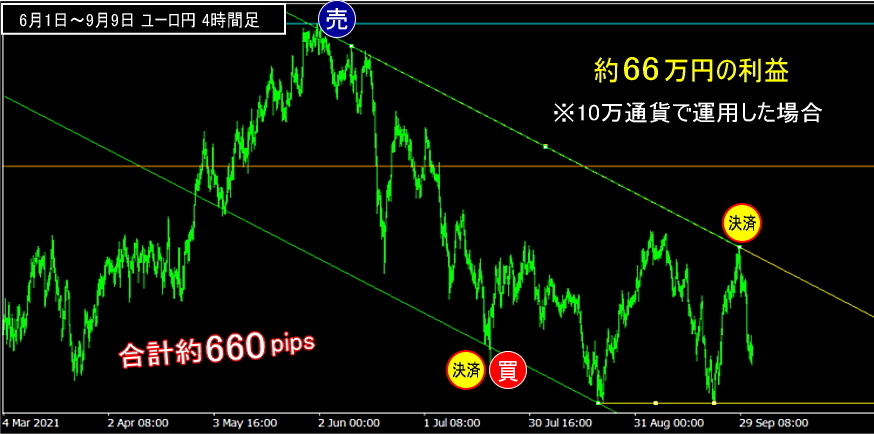
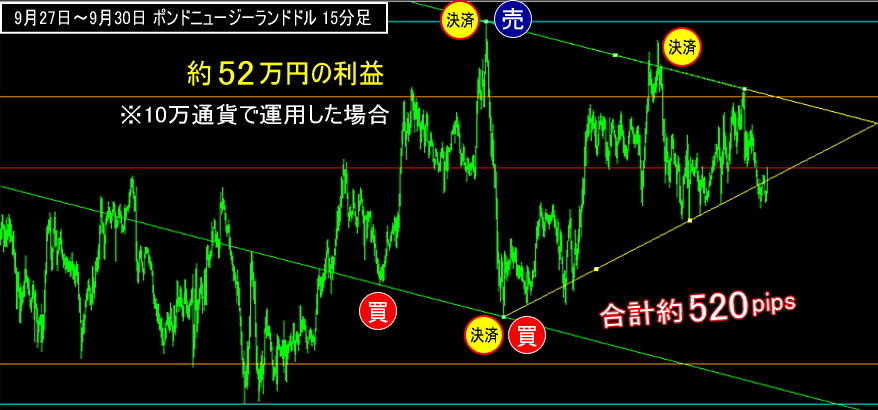
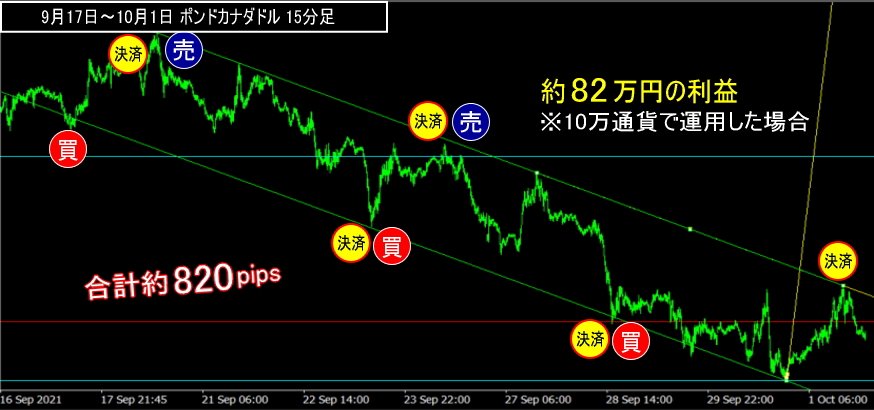
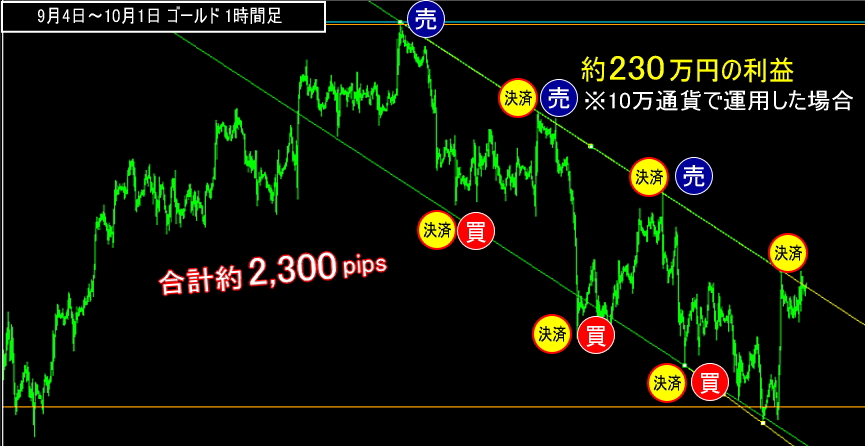
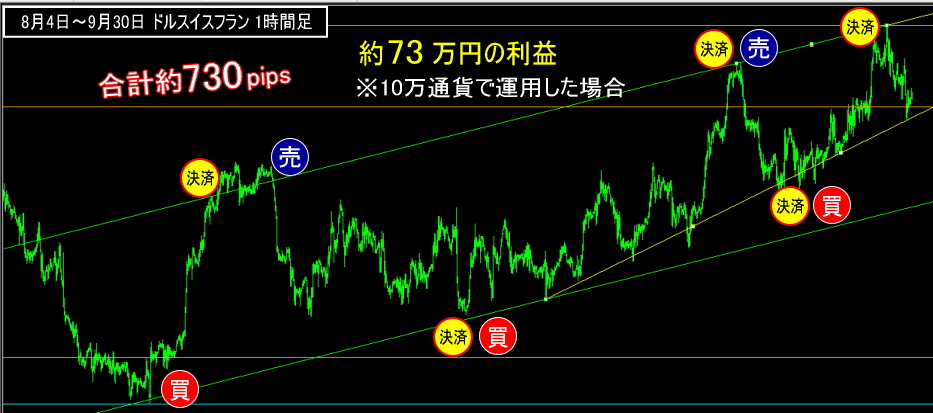
【Indicator features】
・ usable from 1-minute to monthly charts・Entry opportunities: on 5-minute chart about 2 times per day per instrument・Accurate pullbacks/retracements in trends, with possible counter-trend entries・Parameters allow changing the number of candlesticks used to compute each line
② 天底サイン Indicator
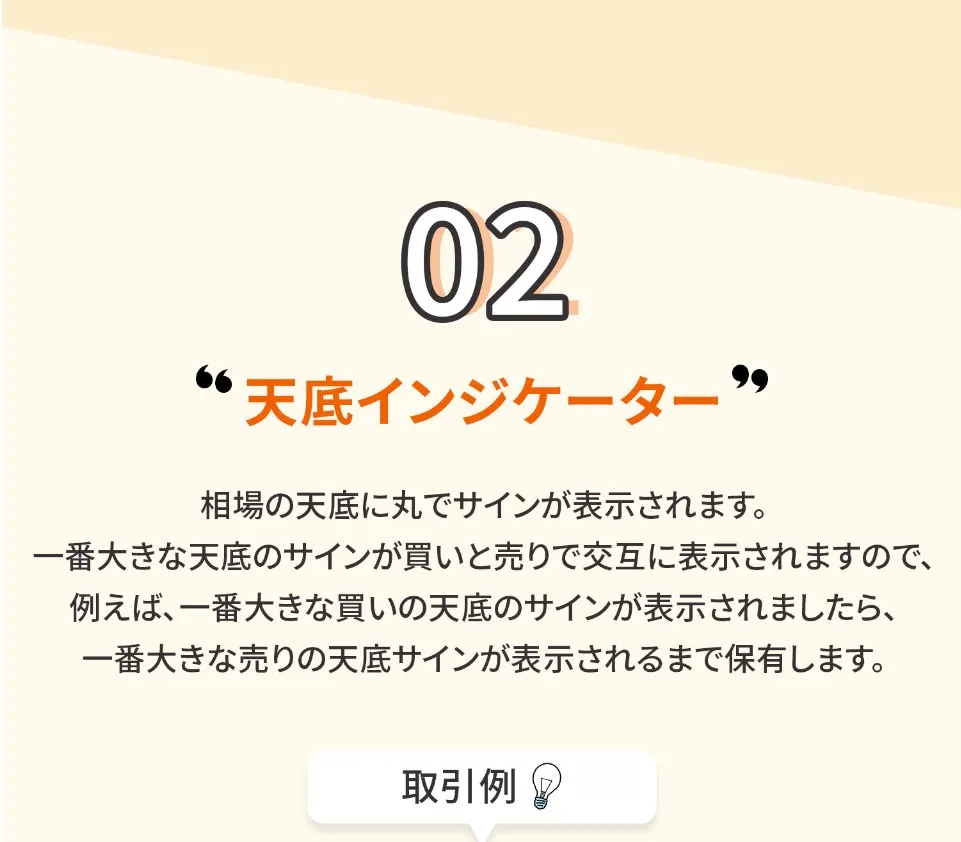
Signs appear as circles at market turning points. The largest turning-point sign alternates between buy and sell, so for example when the largest buy turning-point sign appears, hold until the largest sell turning-point sign appears.
Trading examples:
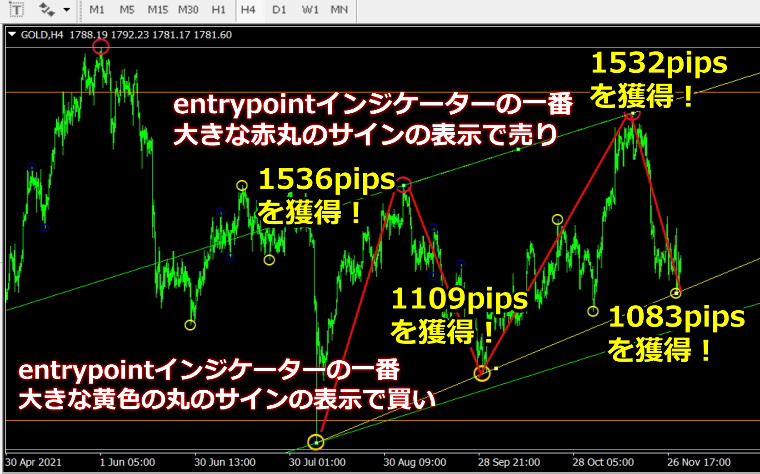
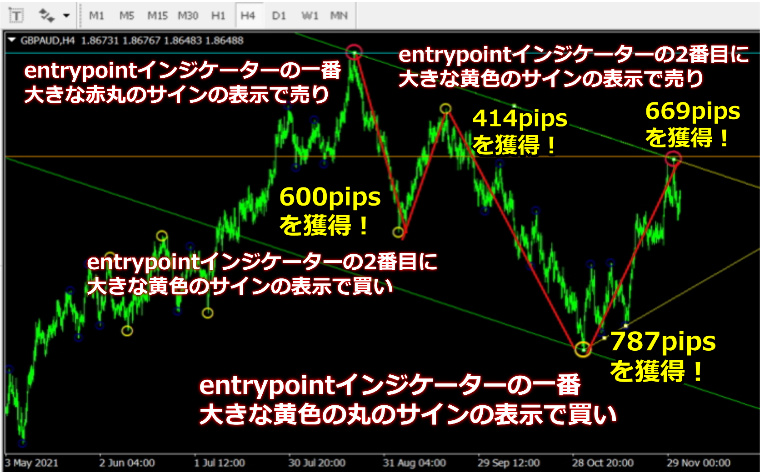
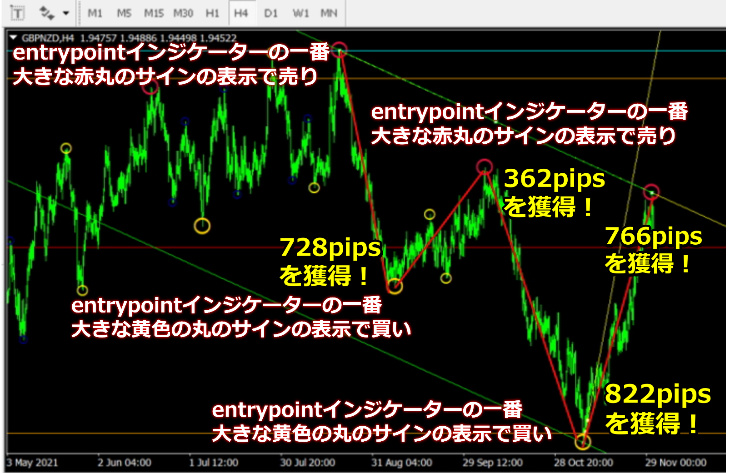
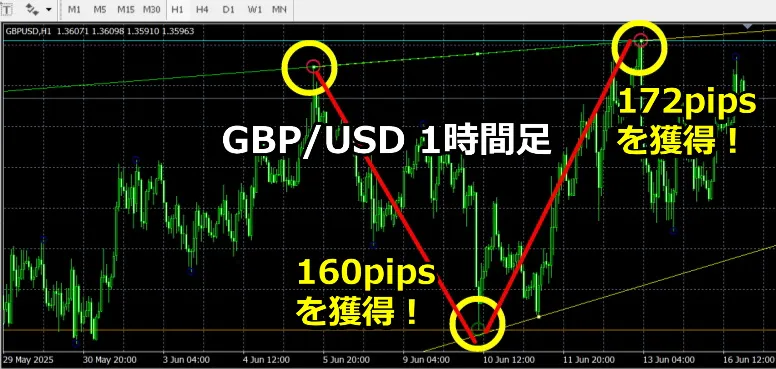
天底サイン Indicator results
Results as of May 2022.
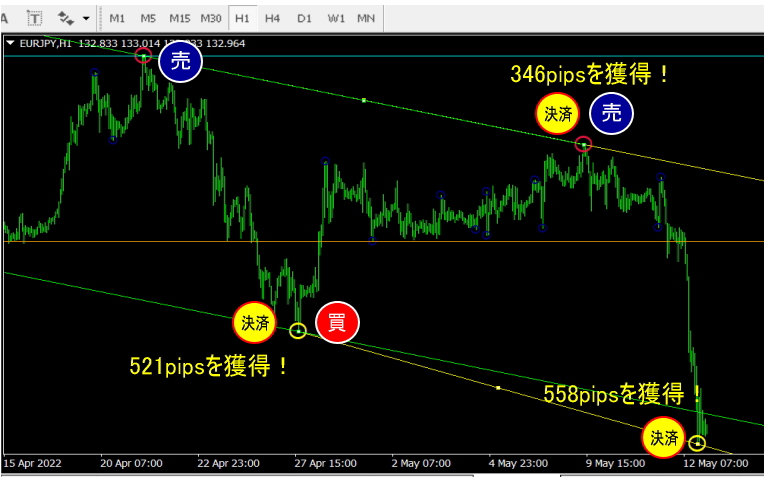
Take profit with sell and buy signs, maximum558 pipsin one trade!
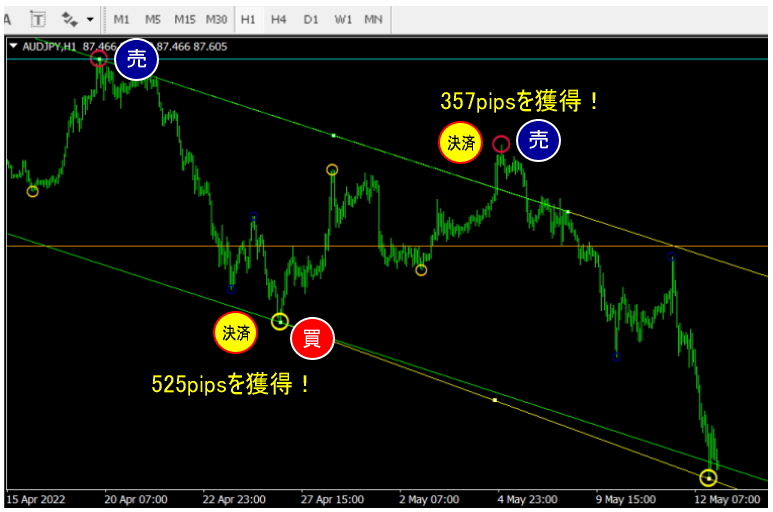
Take profit with sell and buy signs, maximum525 pipsin one trade.
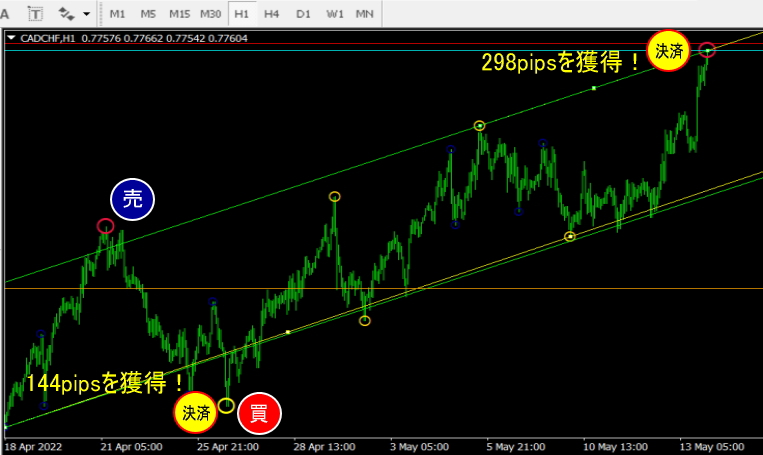
Take profit with sell and buy signs, maximum298 pipsin one trade.
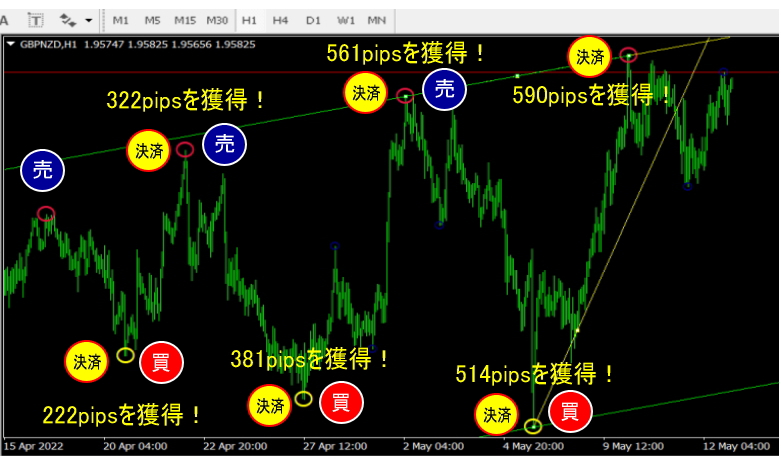
Take profit with sell and buy signs, maximum590 pipsin one trade.
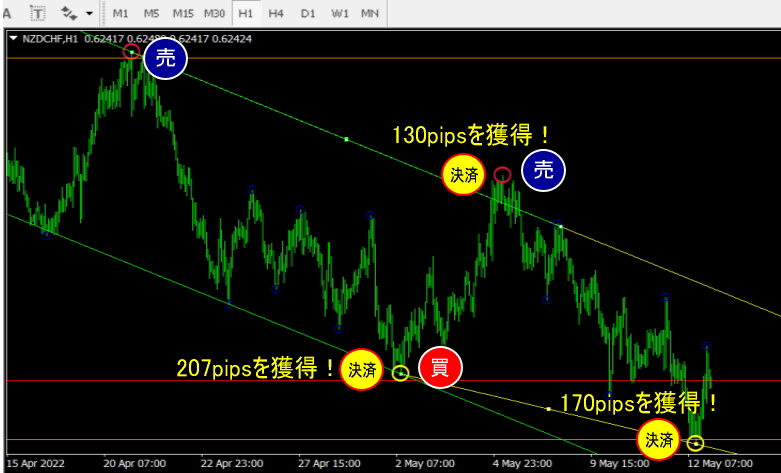
Take profit with sell and buy signs, maximum207 pipsin one trade.
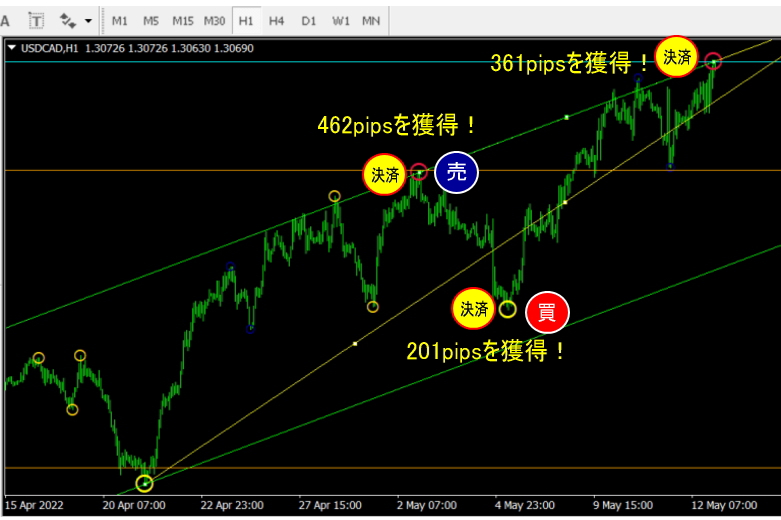
Take profit with sell and buy signs, maximum462 pipsin one trade!
Purchase here!
https://www.gogojungle.co.jp/tools/indicators/37454
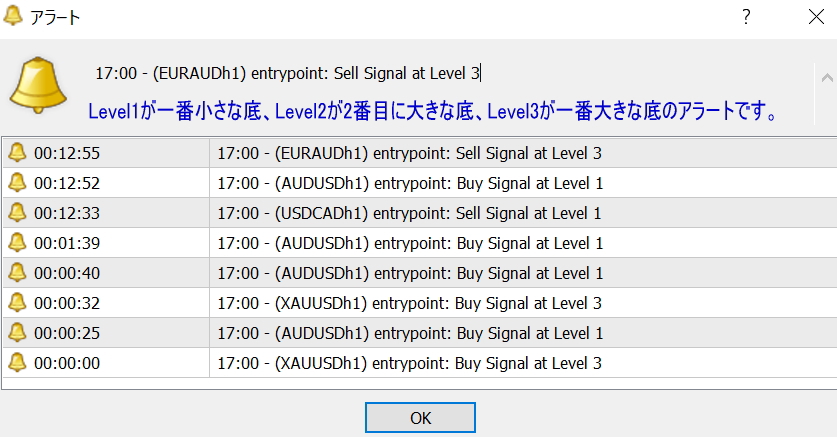
The天底 Indicator includes an alert feature (popup, email, and smartphone notifications) when a sign appears.

【Combinations well-suited with this indicator】
You can display multiple indicators on one MT4 screen, and these combinations are recommended.
①https://www.gogojungle.co.jp/tools/indicators/37692
“Breakout Line” detects points where a large trend may begin!
②https://www.gogojungle.co.jp/tools/indicators/38003
“Channel line indicator to ride the trend” lets you ride rising (or falling) trends to capture many pips!
【Frequently Asked Questions】
Q: Can beginners use the tools to earn money?
A: Yes, the potential to earn is greatly enhanced. It is recommended to enter when the largest round signal of 天底サイン appears or when a price touches the upper/lower edge of the channel line.
Q: Is any time frame okay for trading?
A: Yes.
Q: Can I use with any broker?
A: It can be used with any broker that supports MT4.
Q: Can it be used for scalping?
A: 1–5 minutes = scalping, 15 minutes = day trading, 1–4 hours = day trading or swing,
daily chart = swing, so it can be effectively used on any timeframe.
Q: I am considering using this product together with“Ultimate Sell Sign Indicator” that can sometimes yield 600+ pips per trade (https://www.gogojungle.co.jp/tools/indicators/38800)
Would that be okay?
A: Yes, when the yellow box appears and then a large arrow appears to indicate entry, acting as a filter and resulting in selective entries. I think this combination is a good one.
Q: The manual covers lines, but not the circles (〇). Please explain the meaning and usage of each colored circle (brown large, green large, yellow medium, blue small).
A: The brown circle and green circle are large turning points; the yellow circle is a medium turning point; the blue circle is a small turning point.Basically, use brown or green large circles as guidelines for trading.
Q: Is this indicator buffer-type or object-type? And can it be used for binary options?A: It is object-type. It can be used for binary options.
Purchase here!
https://www.gogojungle.co.jp/tools/indicators/37454
If you join the free online community in GoGoJungle’s My Page, we would be grateful.