
Please look at the "1-hour chart" to calmly confront the chart.
 Latest version!!
You can watch the interview with GoGoJyan President Hayakawa and me here
There are also free gifts.
Good morning, everyone.
Yesterday's USD/JPY range was about 40 pips?
The market has been without volatility, but it won't stay like this forever, so for now just wait.
In that environment, I think it's time to fine-tune your trading technique by slowly collecting small profits.
There is no need to rush. Big opportunities will come surely.
I monitor the 1-hour and 1-minute charts on a daily basis.
The article may also use daily or 5-minute charts, but that is to convey to readers that these are viable options depending on the situation.
There is no need to expand charts with multiple monitors in an MTF setup.
Some people can win in that environment, others can lose.
Personally, I think 1-hour, 1-minute, and the trading screen are enough.
A laptop with one extra monitor is enough.
Those who stare at the 1-minute chart will understand it, especially ultra-wealthy traders.
Now I’ll explain why I look at the 1-hour chart using yesterday's chart.
USD/JPY 1-hour & 1-minute charts
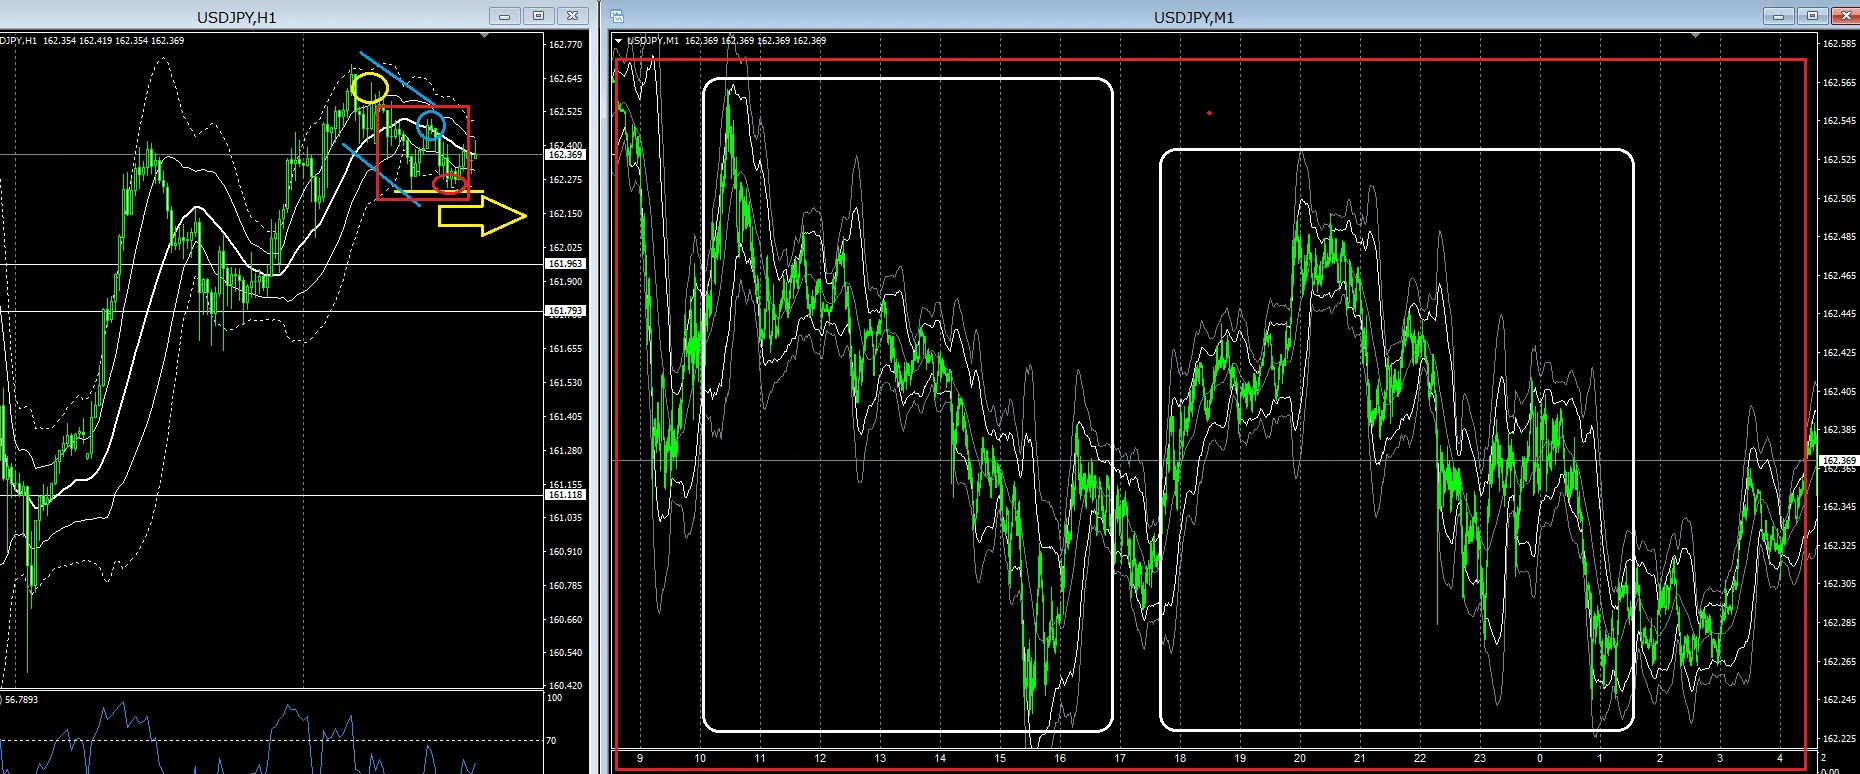
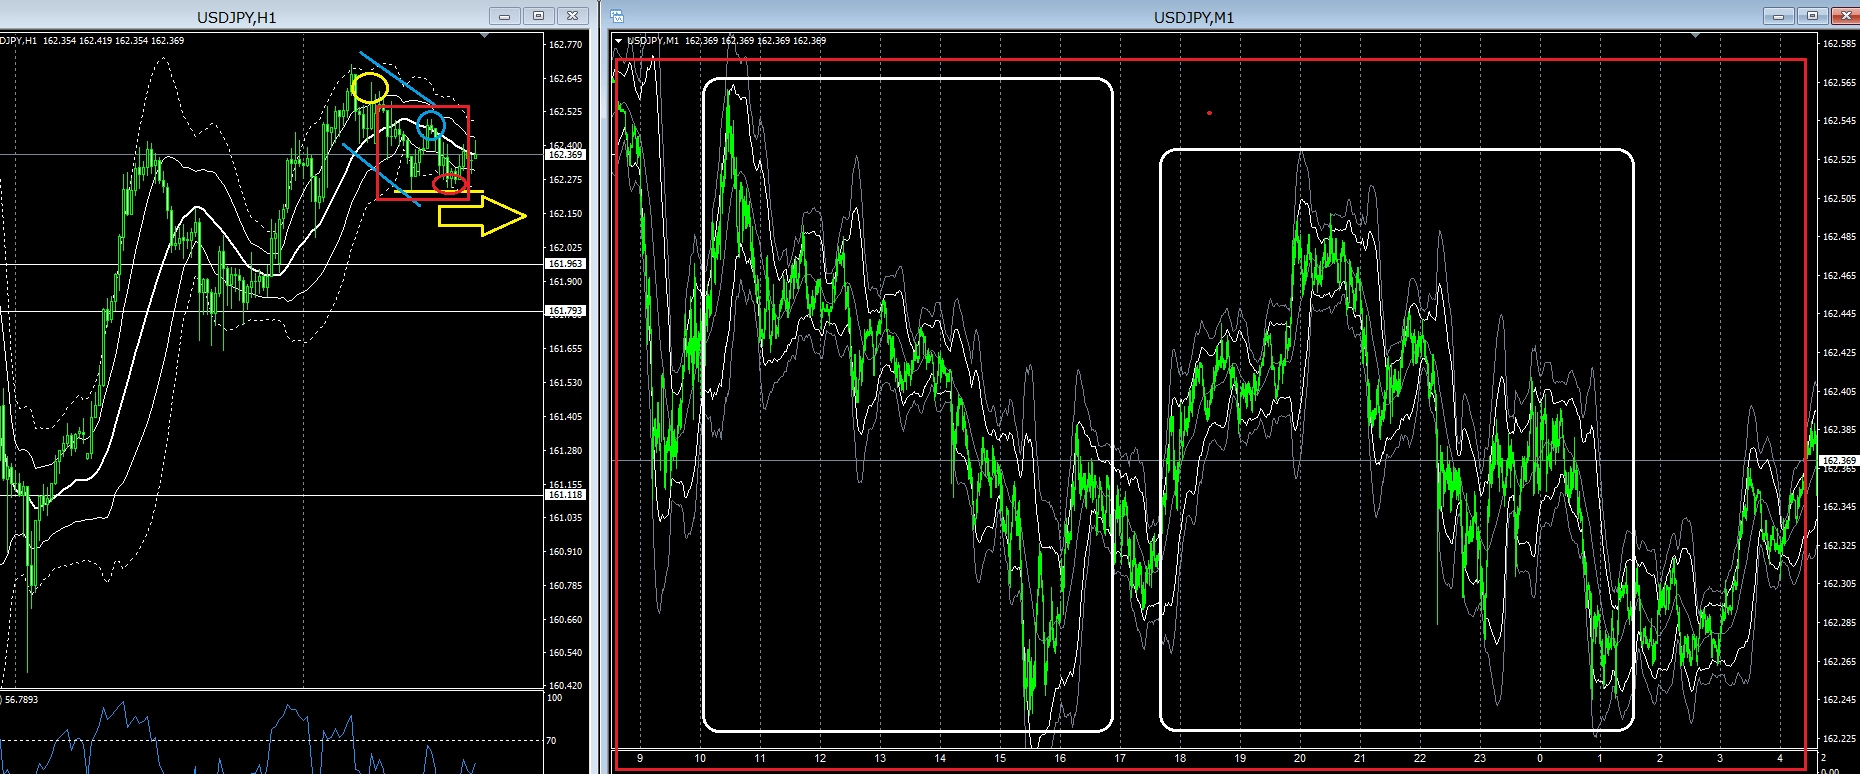
The left side is the 1-hour chart.
Yesterday, movements were generally within the red box.
At the start of Tokyo, I consider whether it will exceed the yellow circle or not.
Since the high price fell below the yellow circle, if it does not exceed the yellow circle, I judge that the downtrend will continue.
As you can see, like the blue diagonal line, both the highs and lows declined, forming a downtrend.
If this does not happen, it would be a range where neither high nor low are updated, which is the yellow → partial.
If this range had a new low during the Tokyo session immediately after the yellow circle, I would have judged it a range.
(No decline up to the yellow horizontal line)
Yesterday, I looked at the Tokyo start and made judgments like this on the 1-hour chart.
The finer movements were seen on the right 1-minute chart.
The white box is a situation that can be traded using the Billionaire Trader chart’s Billionaire Trader line.
In particular, the move from the day's low during Tokyo time to rise after 15:30 was easier to capture.
However, those who are employed cannot encounter this scenario, so if you could join the decline after 20:00, that would have turned into a trade from there.
The high/low updates described on the 1-hour chart are, in a sense, the definition of the trend, and that definition also applies to the 1-minute chart.
But as the time frames get shorter, there are more changes, so for intraday trading, I think it’s better to navigate with the 1-hour chart as a guide and enter on the 1-minute chart.
Aim to trade the down move on the 1-hour downtrend using the 1-minute chart, or aim for a reversal L after a down move.
This differs somewhat from attempting to catch a rise during an uptrend from a down move, so risk (stop loss) should be kept relatively small.
By deciding the 1-hour perspective like this, your own entry points on shorter timeframes become clear.
Now, when volatility is low, you must prepare and validate in advance for when movement begins.
Thank you for your continued support today.
For traders who ardently want to succeed in trading, who want to earn a living from trading, this is the recommended product—trading techniques you can learn on your own. Here it is below: