

【July 9, 2026】Sky and Earth Series (3 types) × Chart Verification (Gold)
This time is a Gold chart verification. I will explain using the Heaven and Earth series trading method for discretionary trading. Entry timeframe is 15 minutes. For environmental recognition, I am using the 4-hour and daily charts.
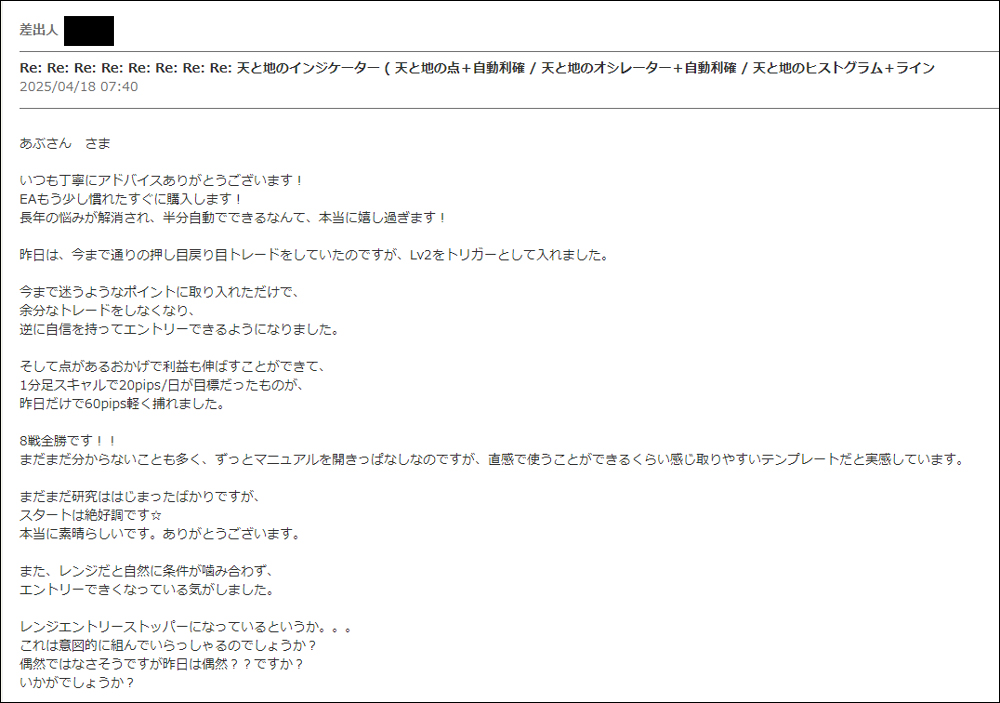
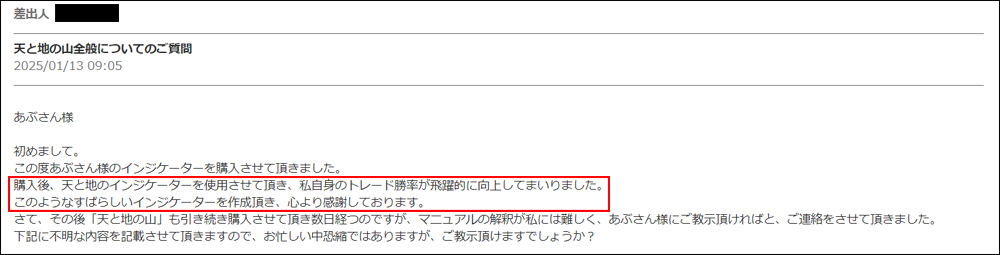
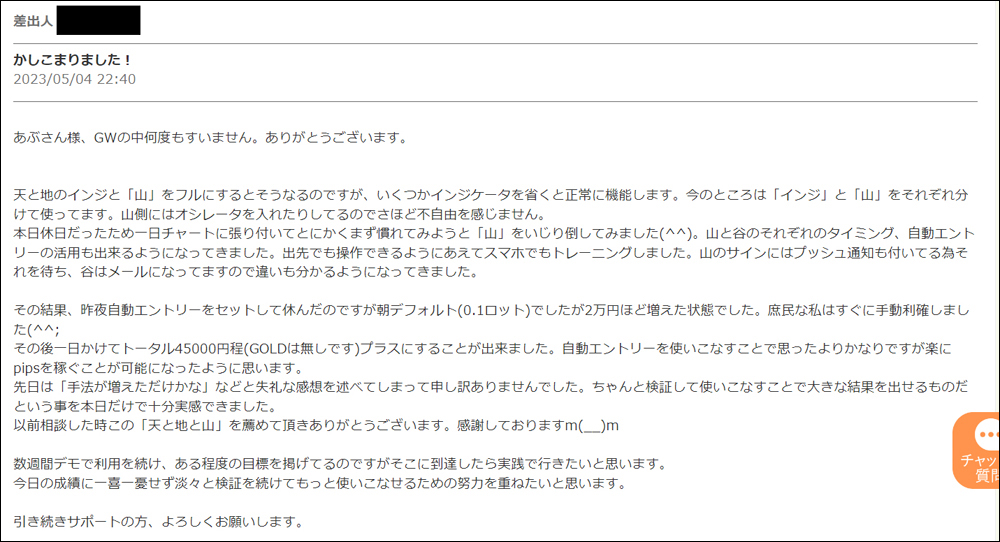
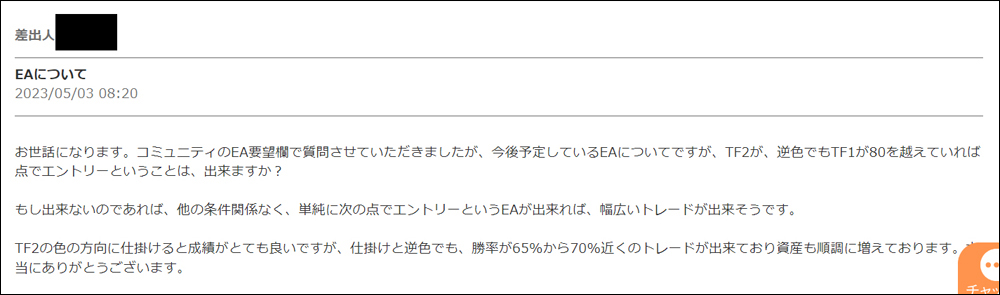
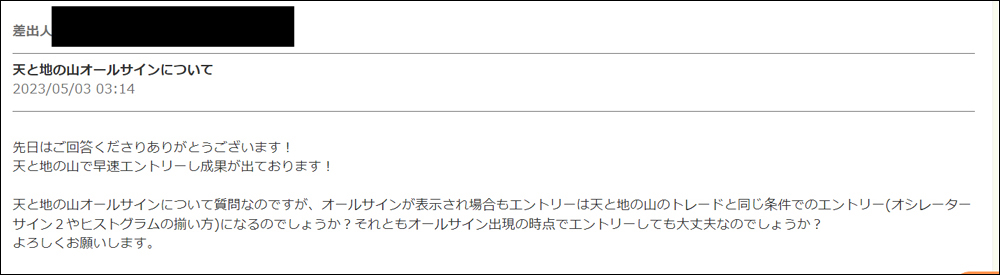
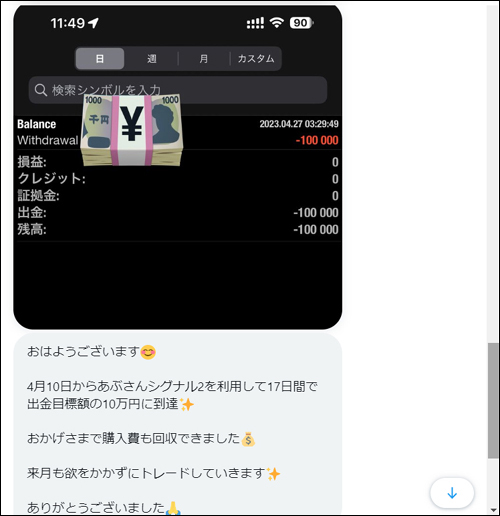
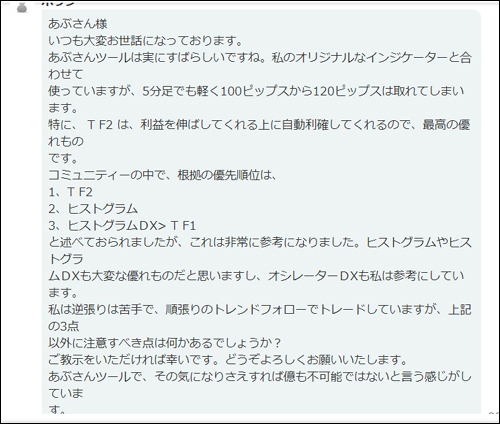
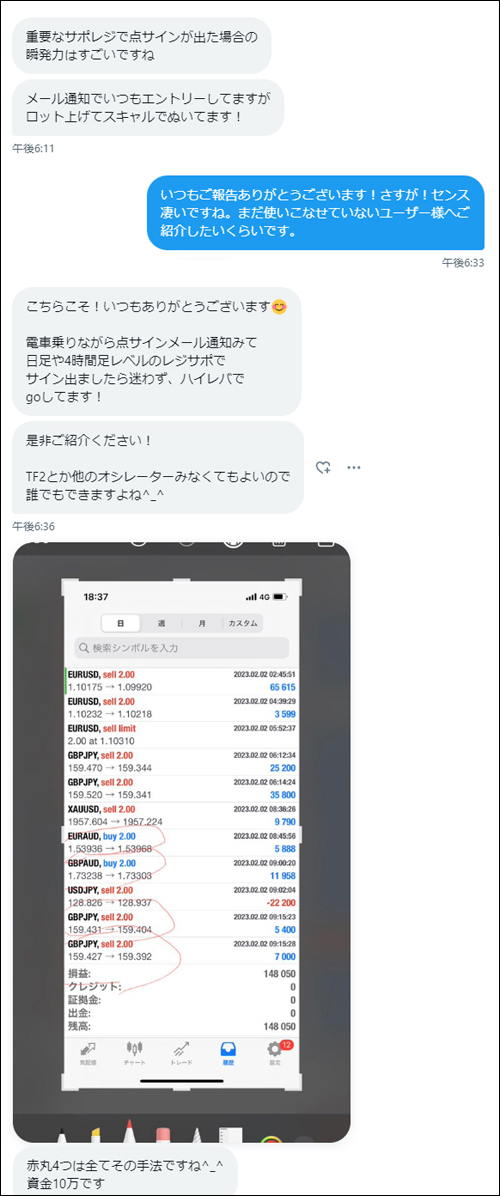
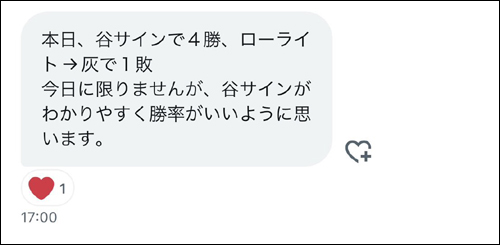
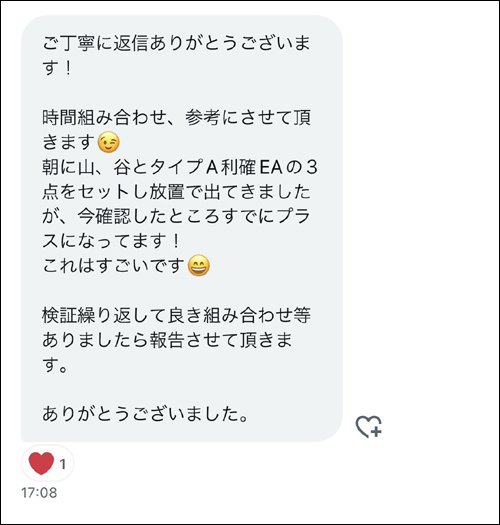
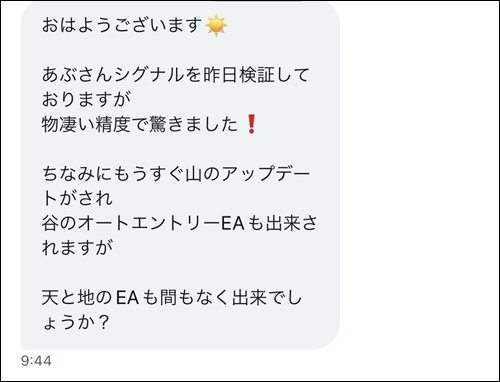
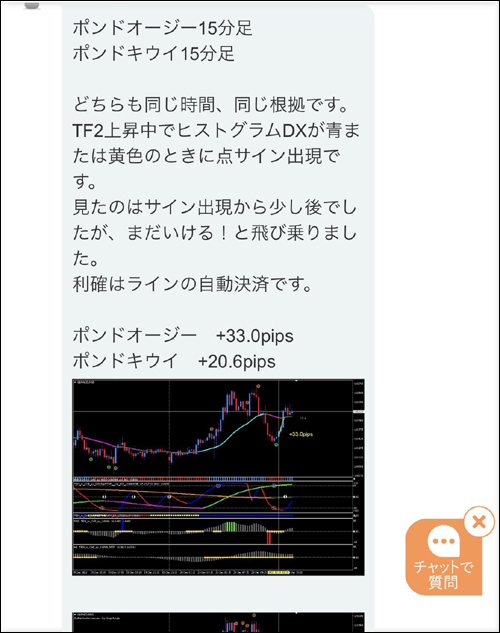
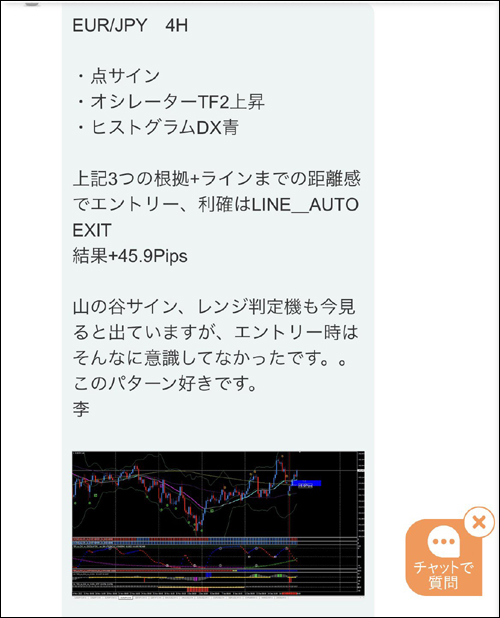
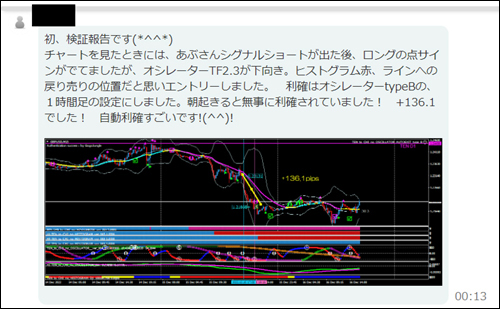
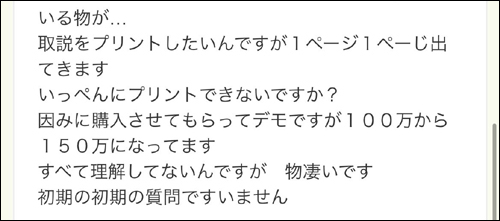
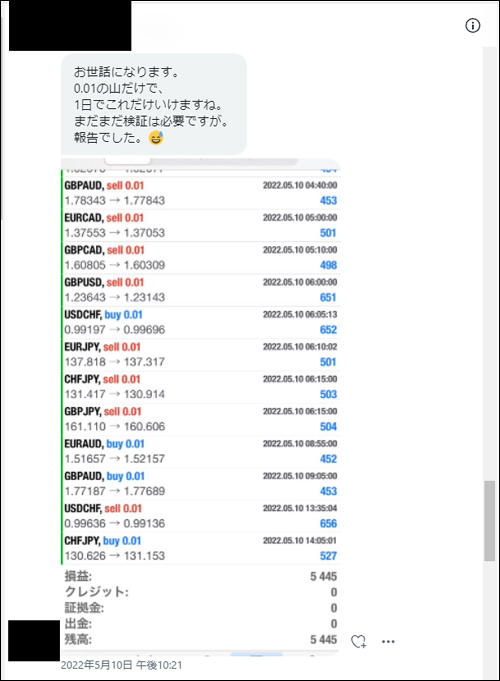
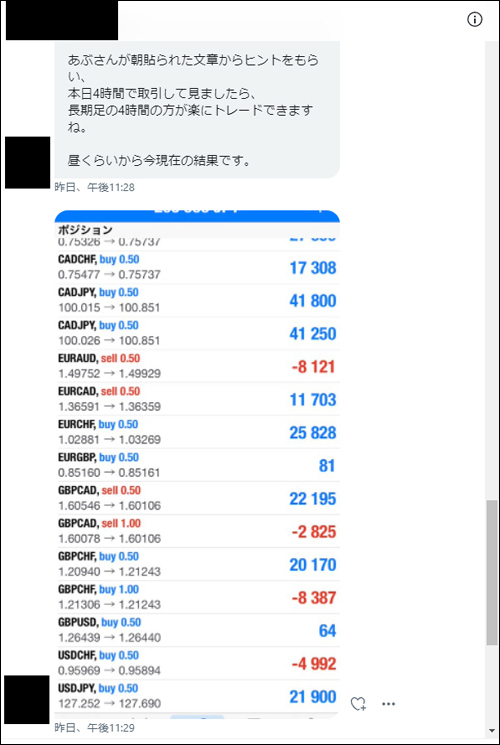
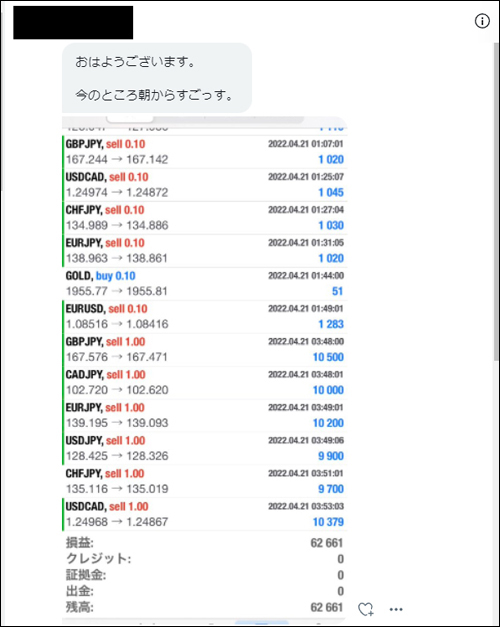
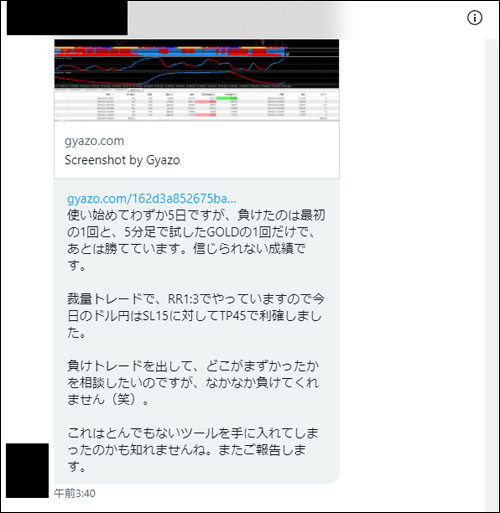
・Voices from people who actually used Prime Combo Signal
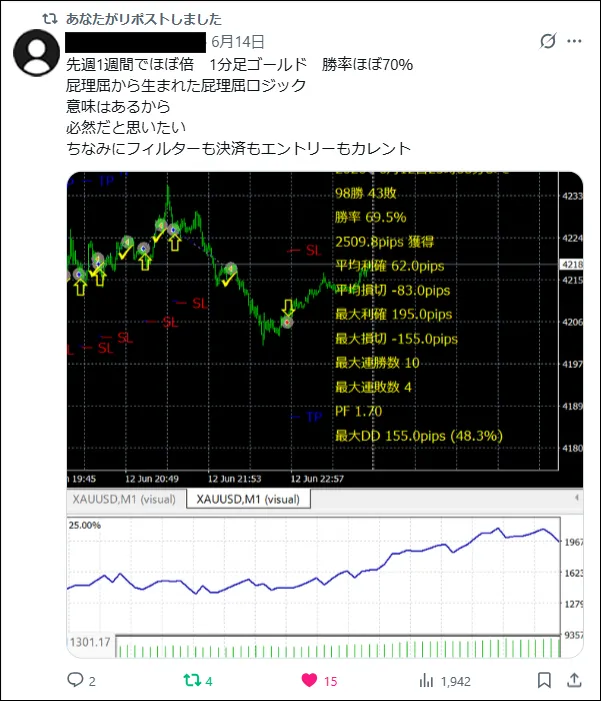
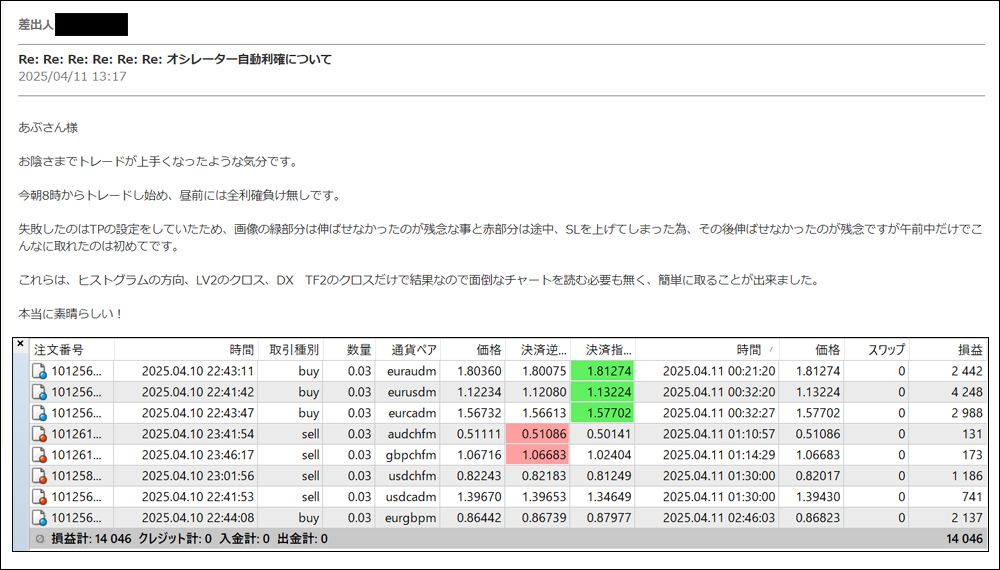
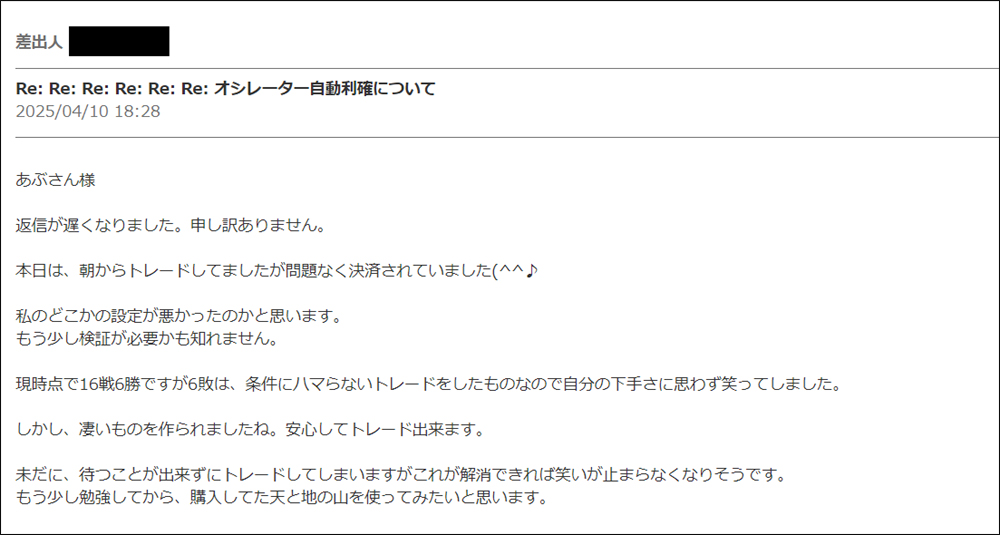
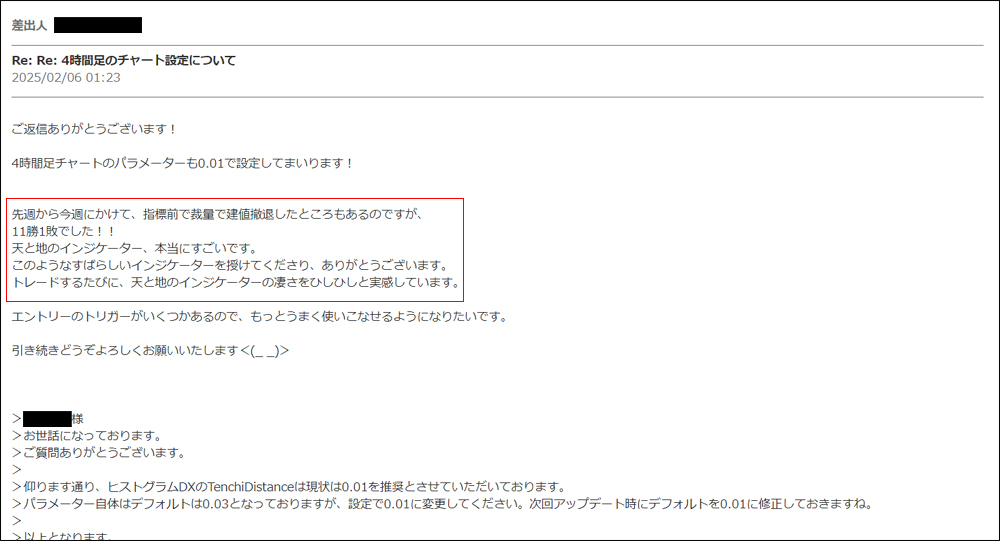
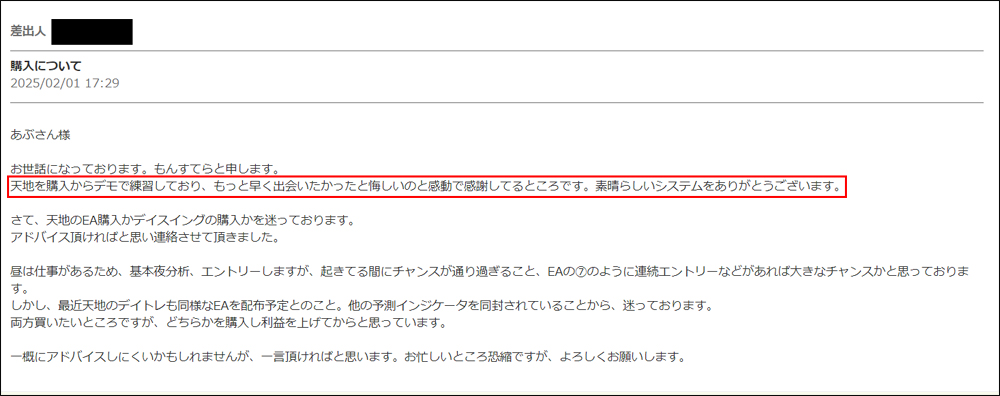
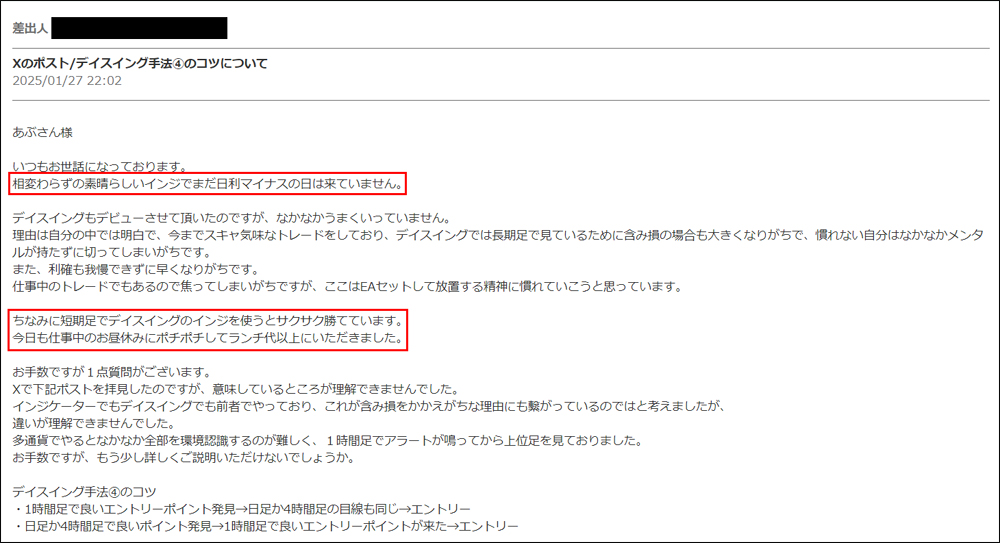
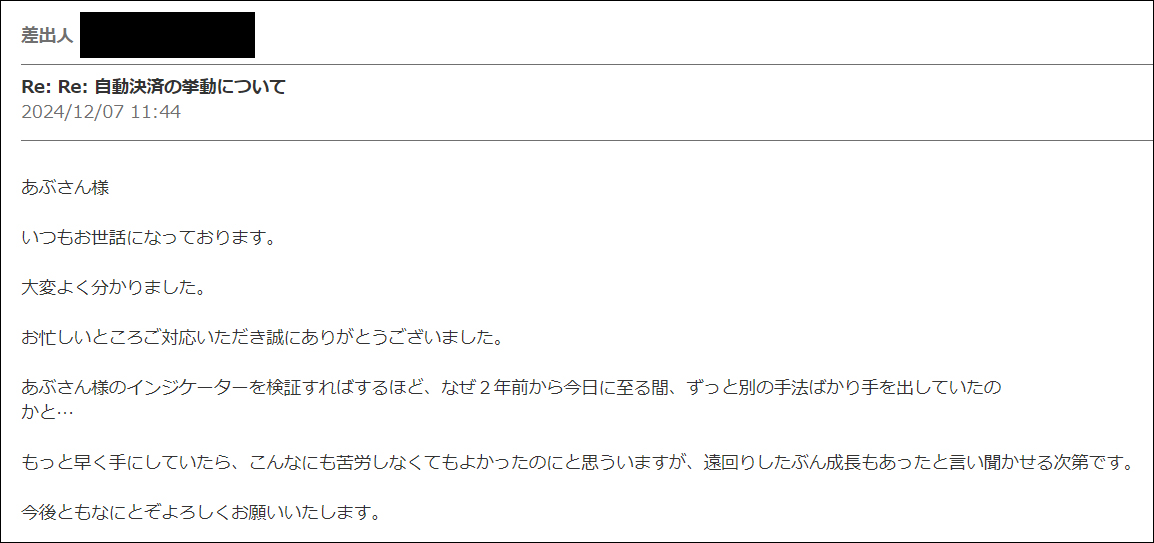
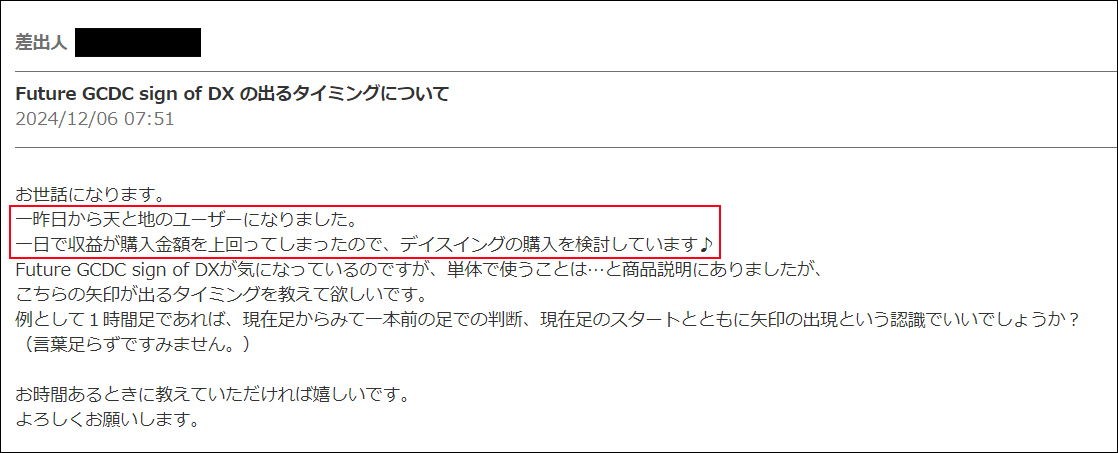
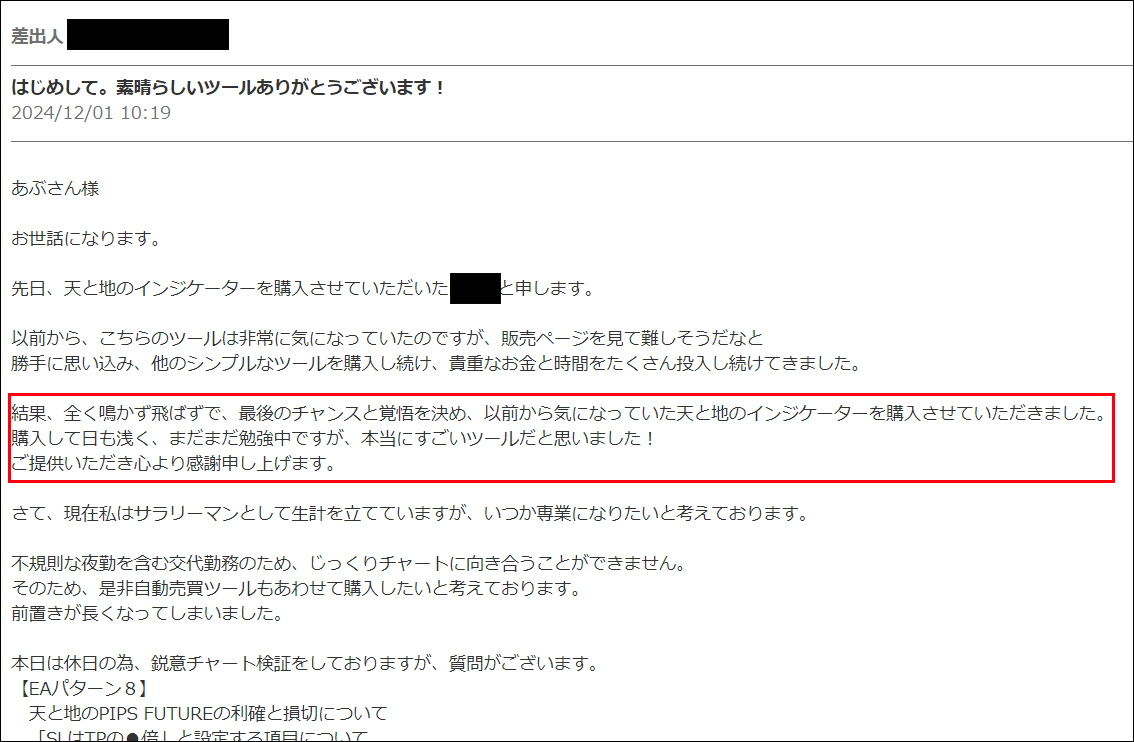
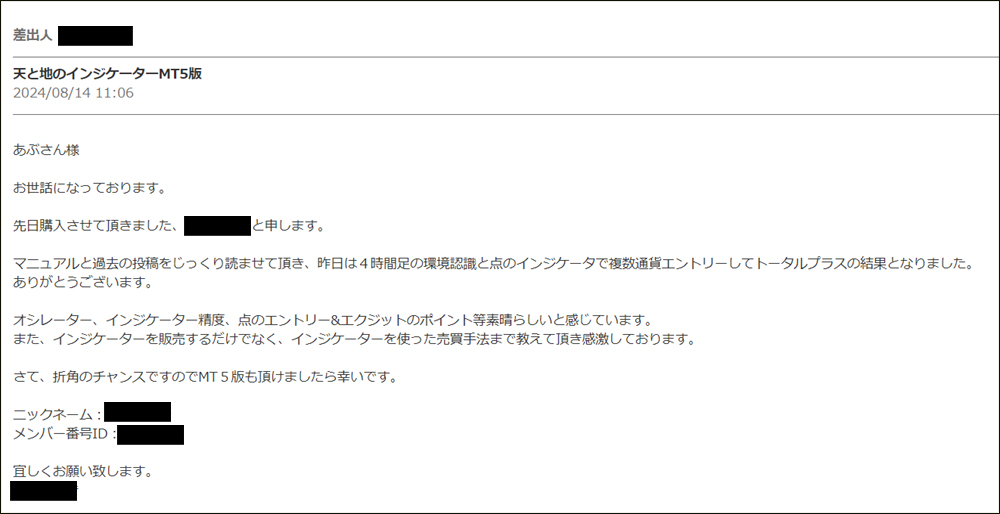
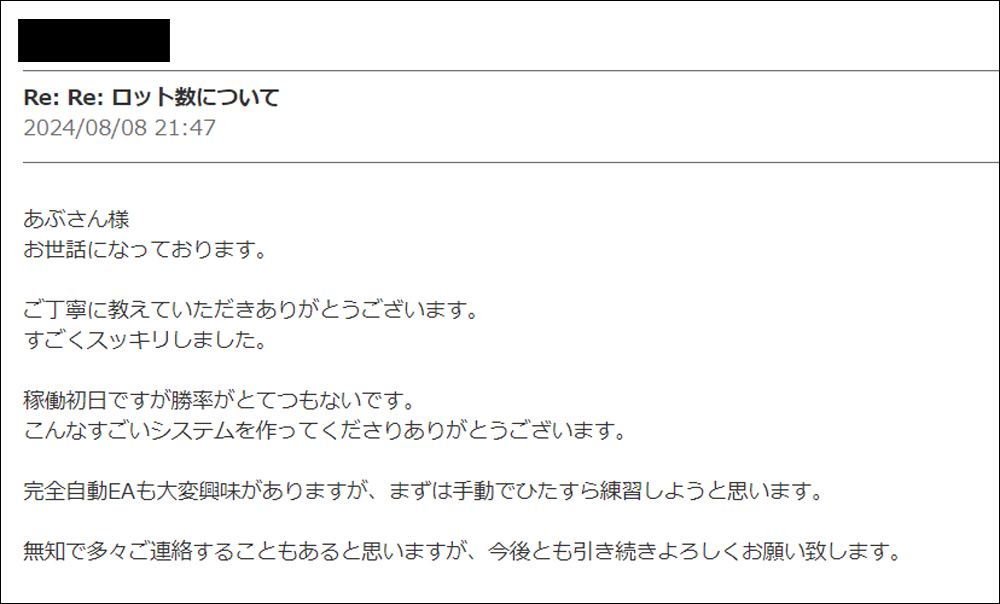
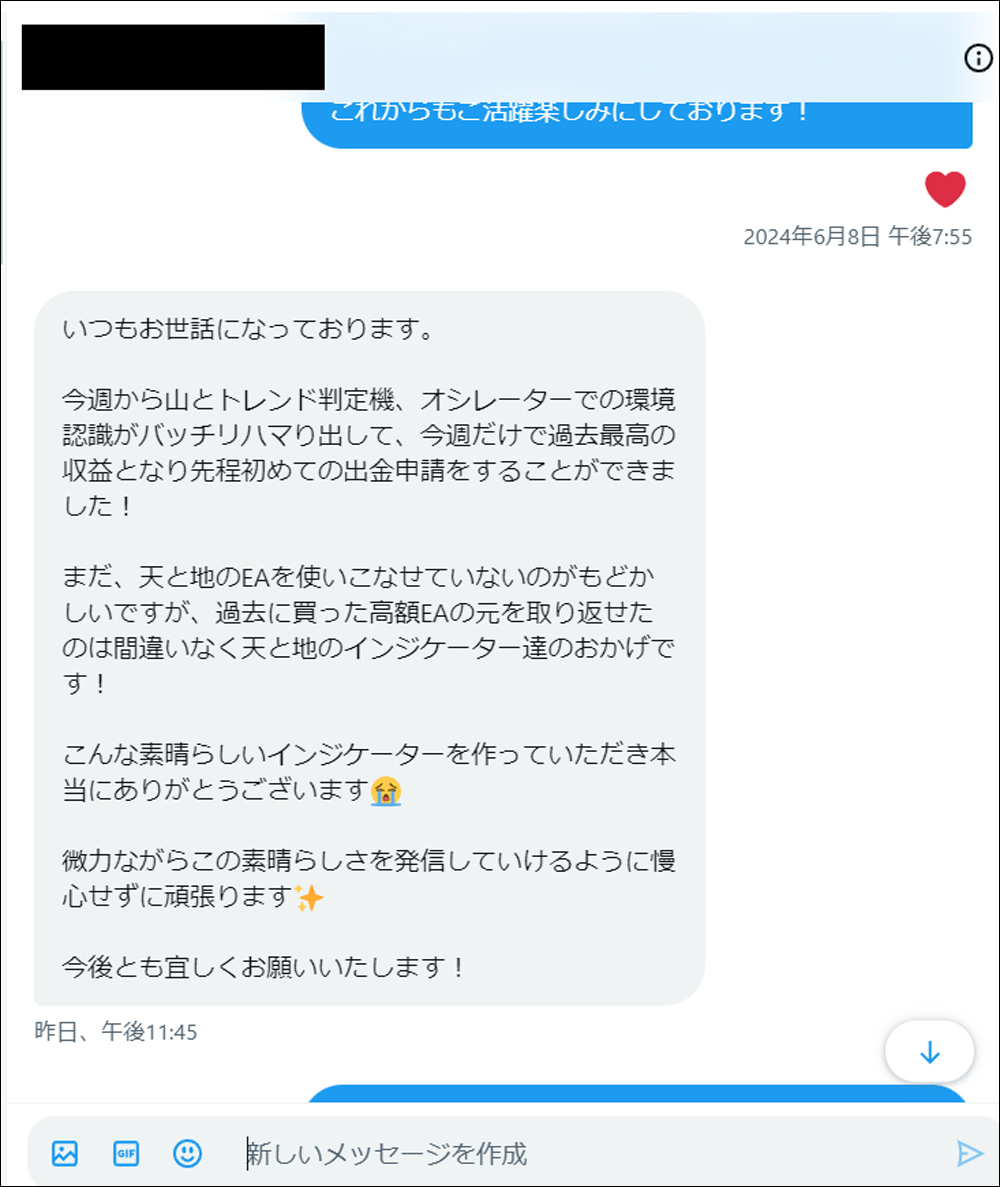
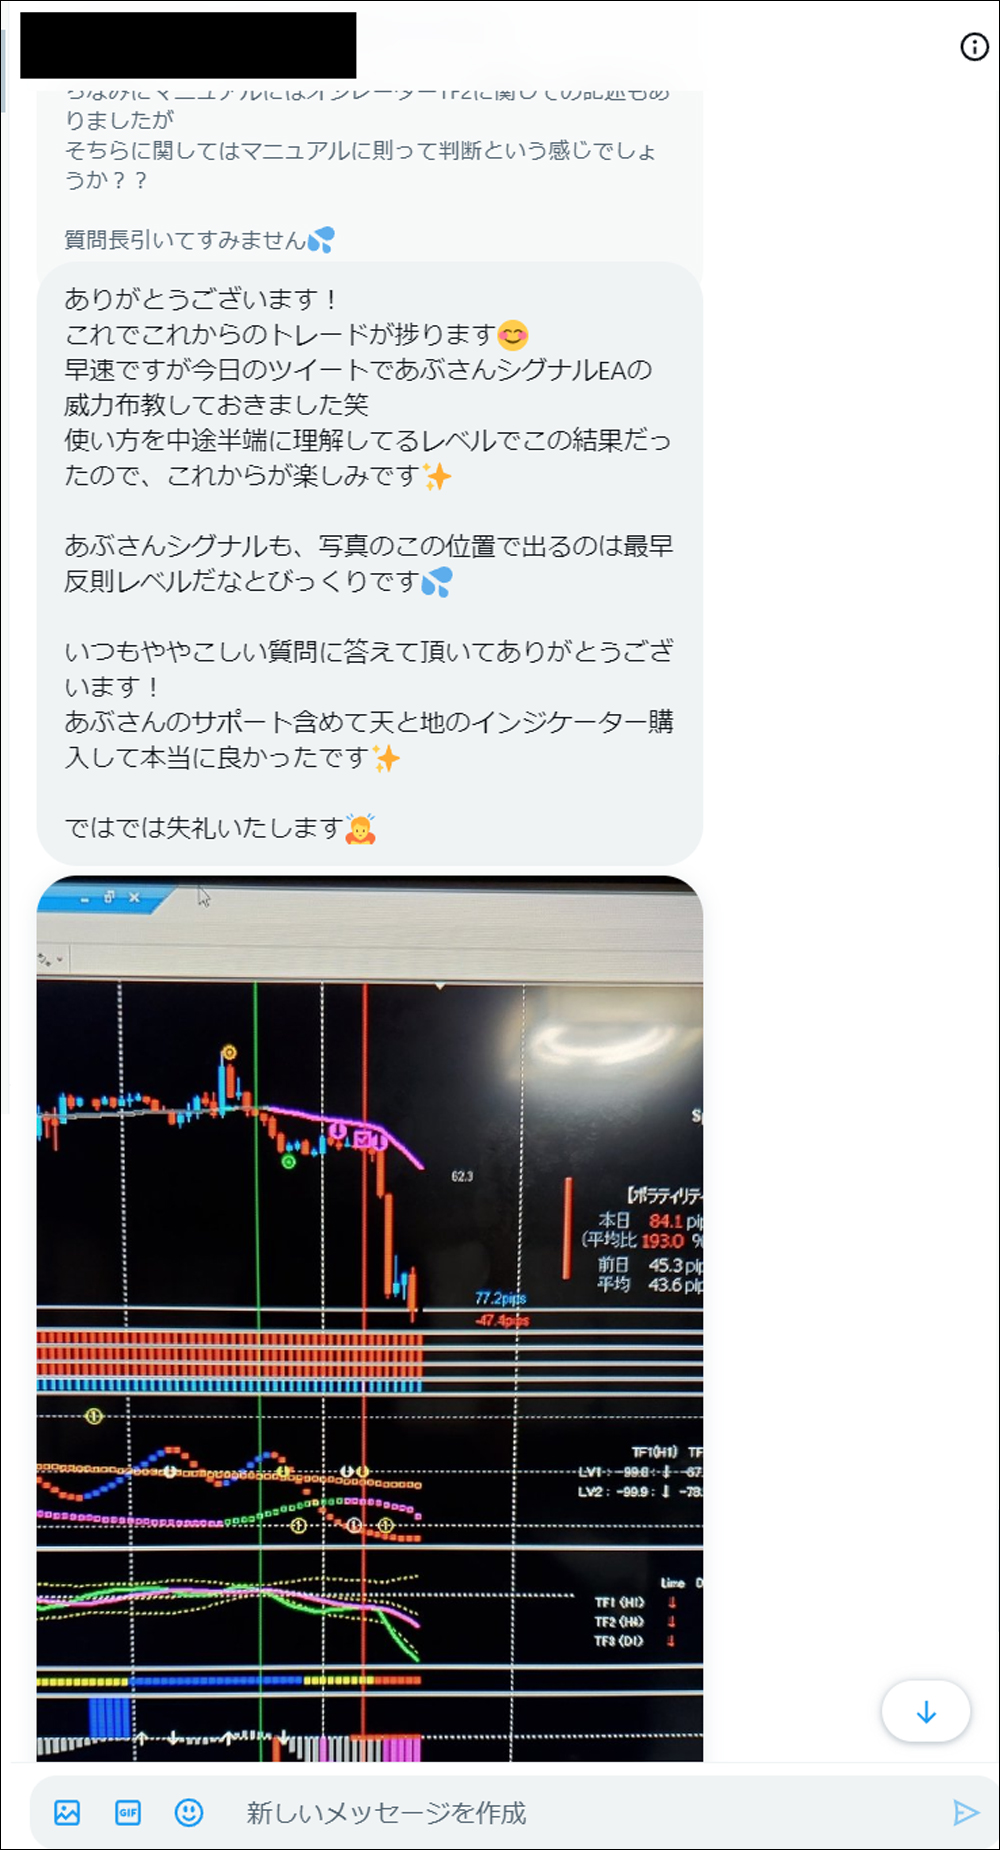
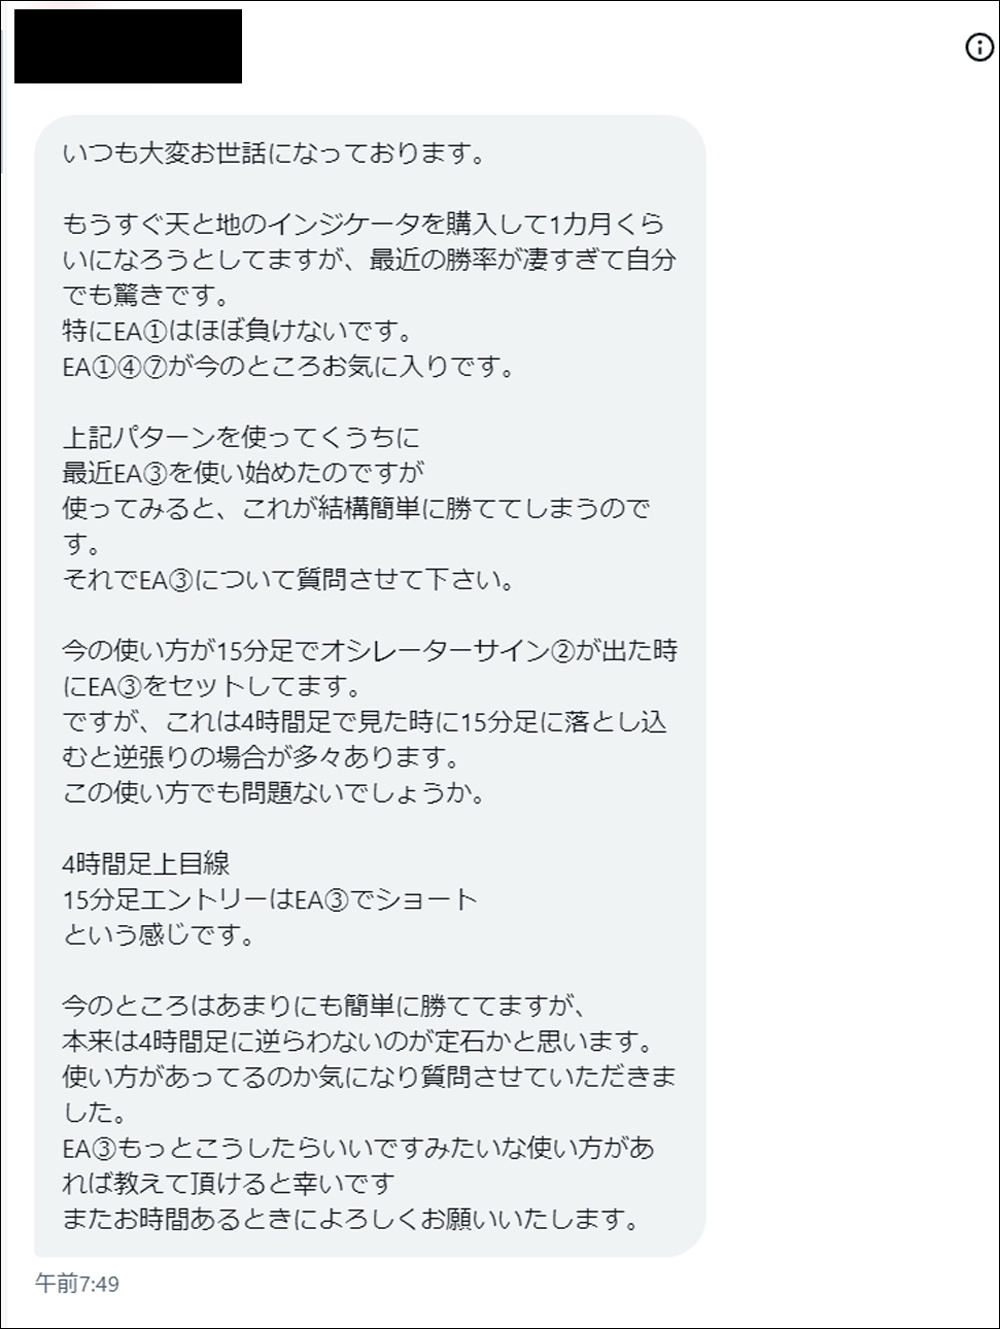
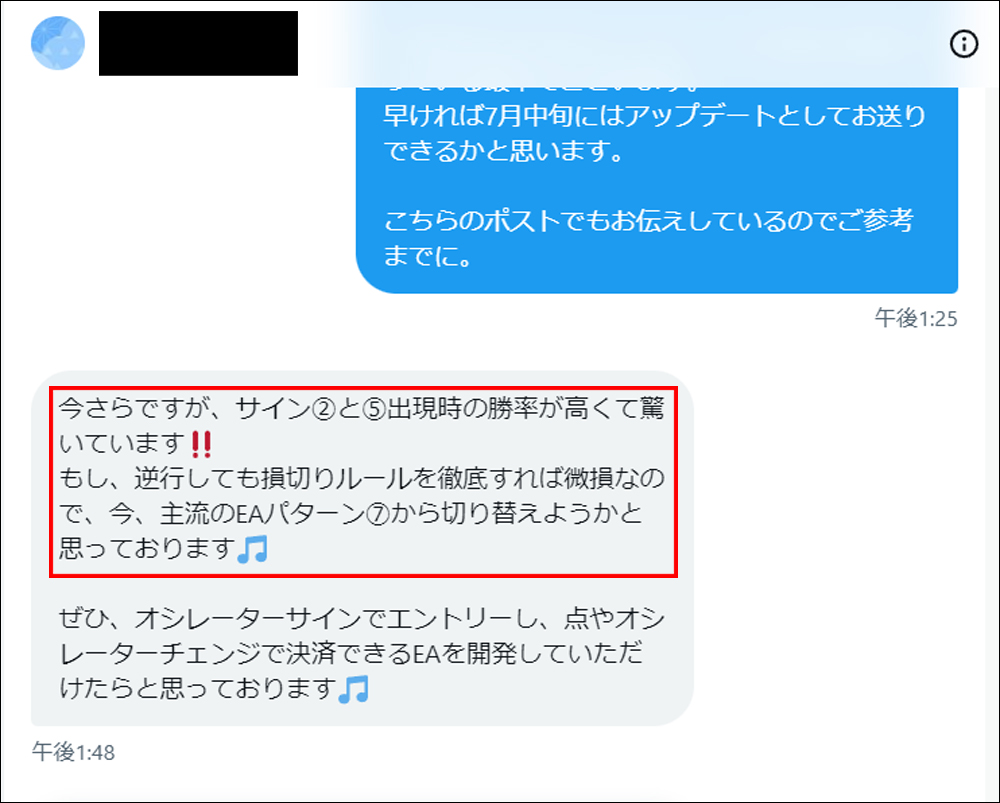
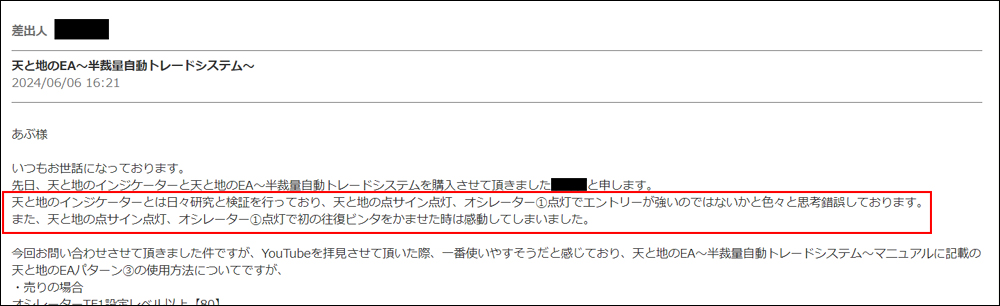
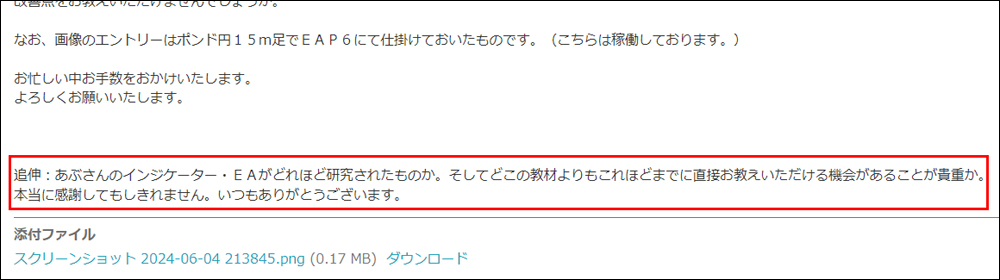
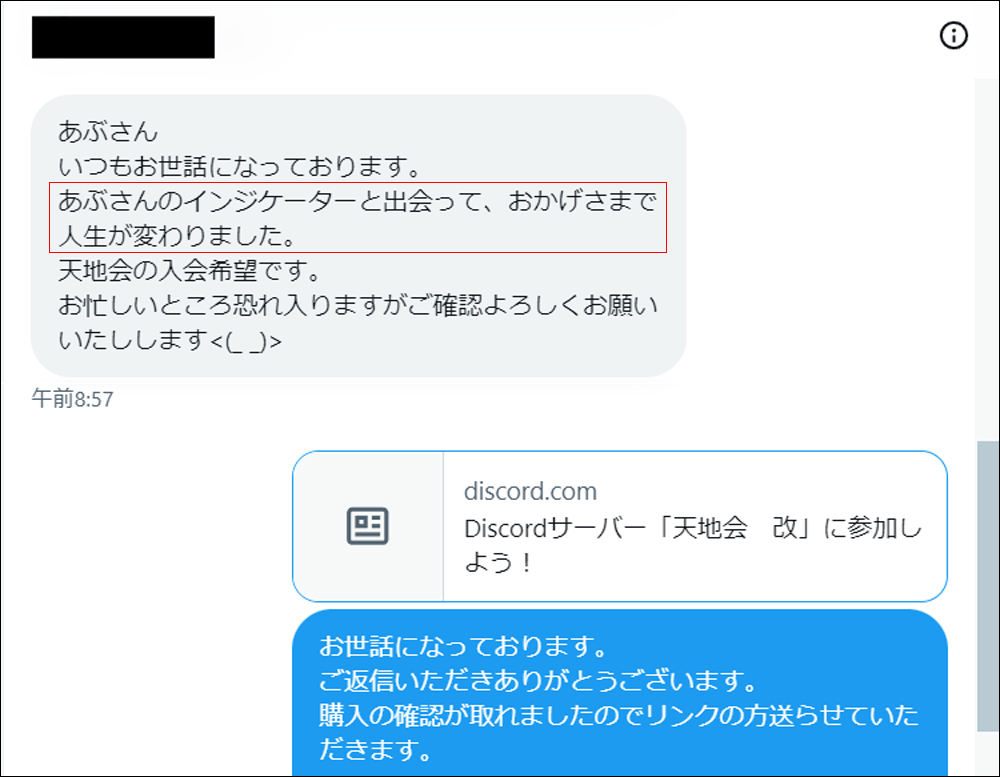
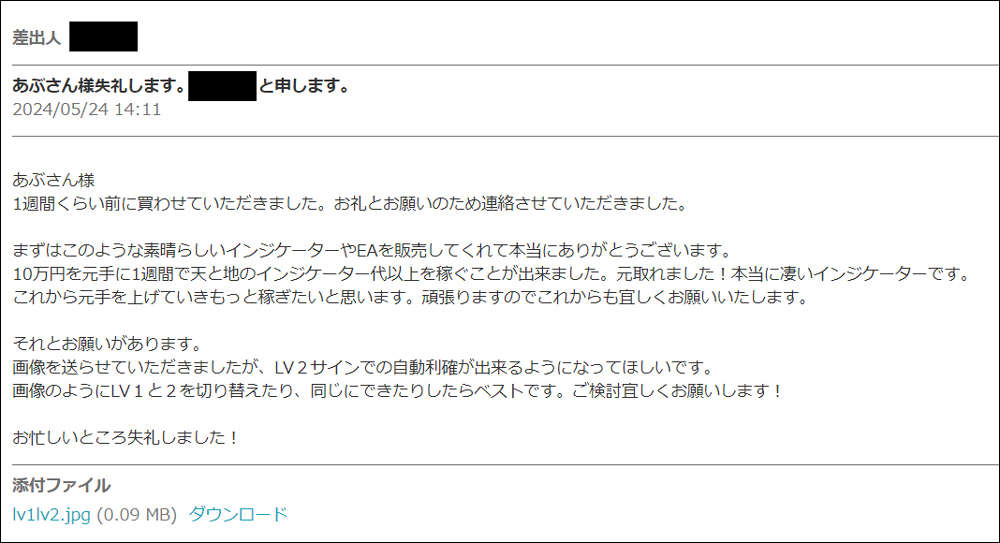
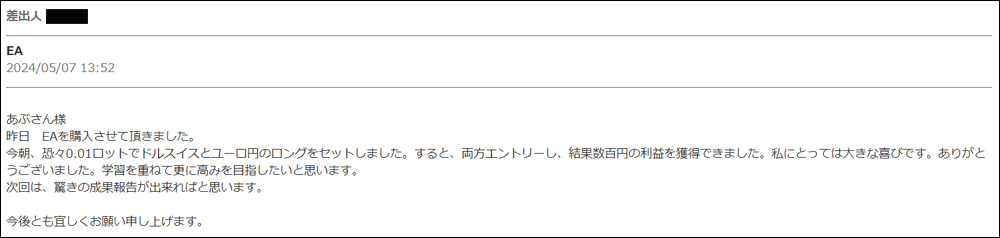
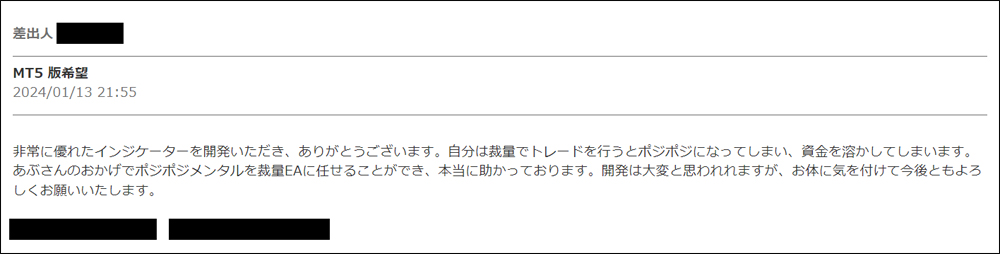
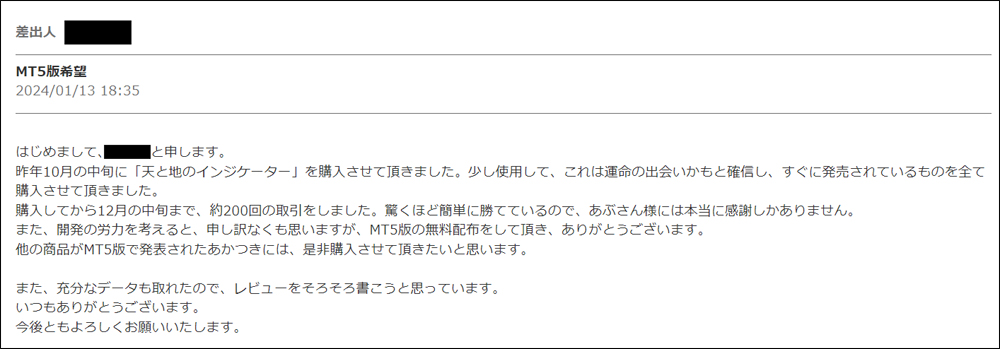
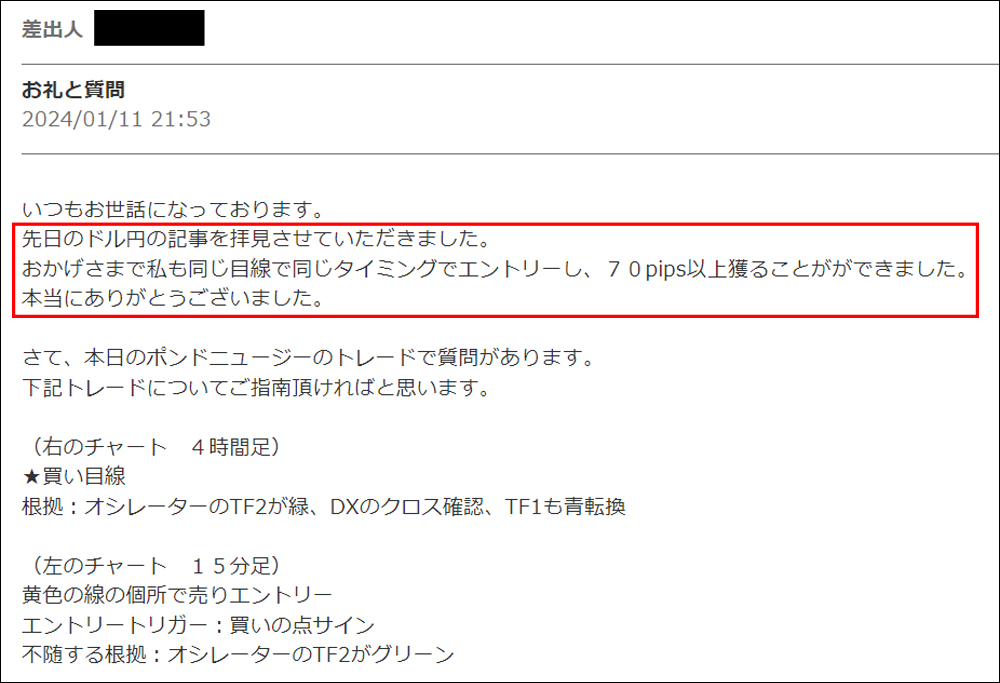
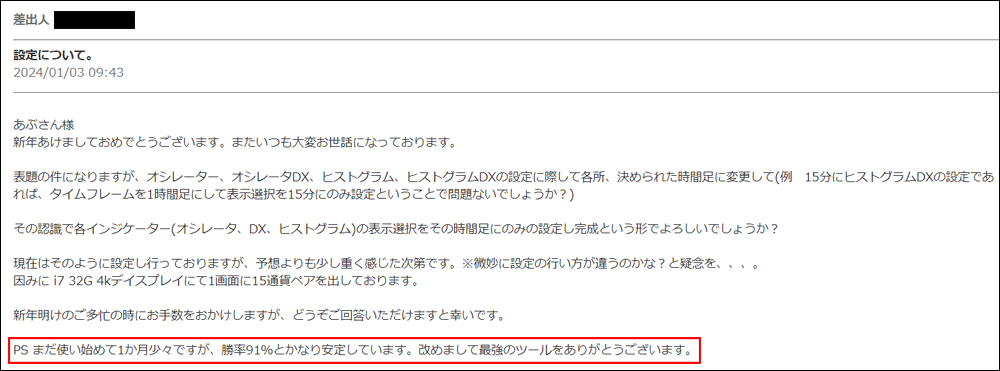
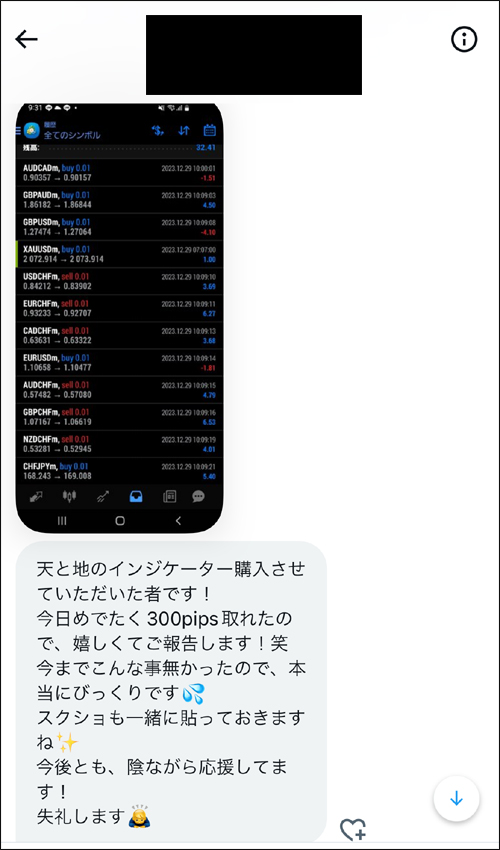
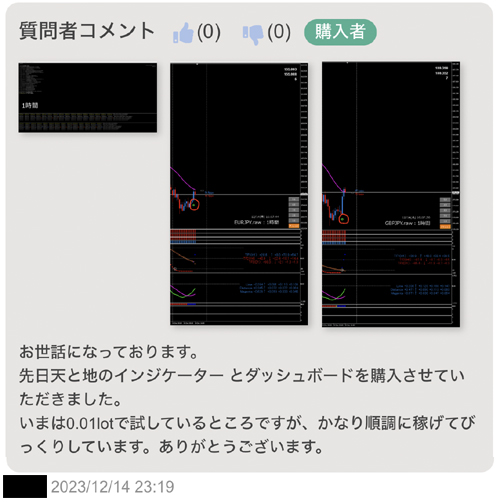
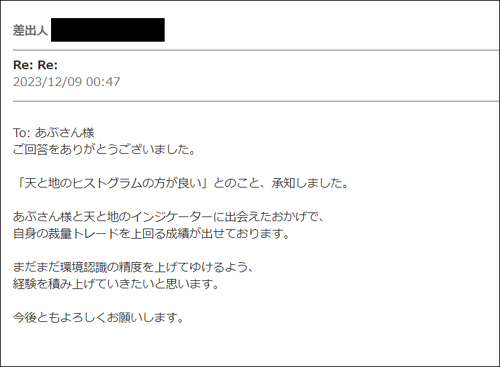
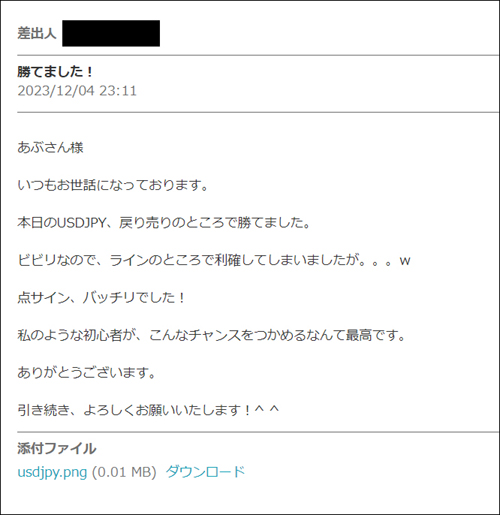
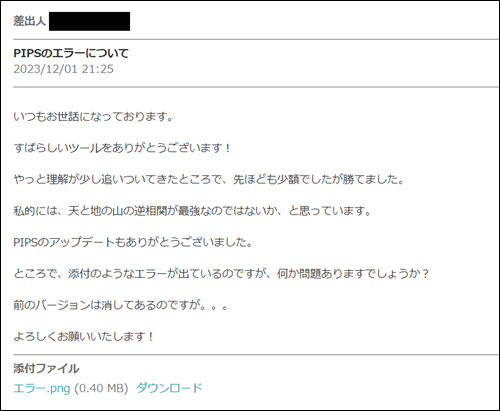
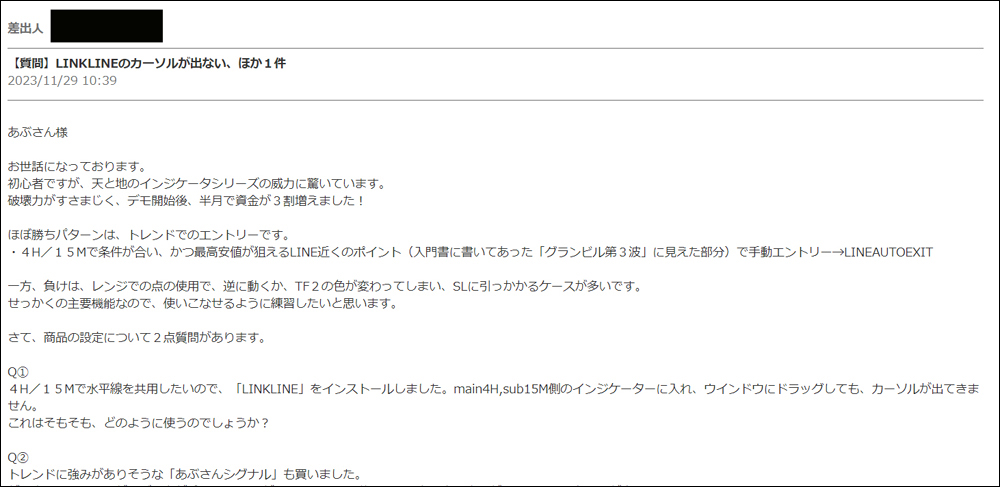
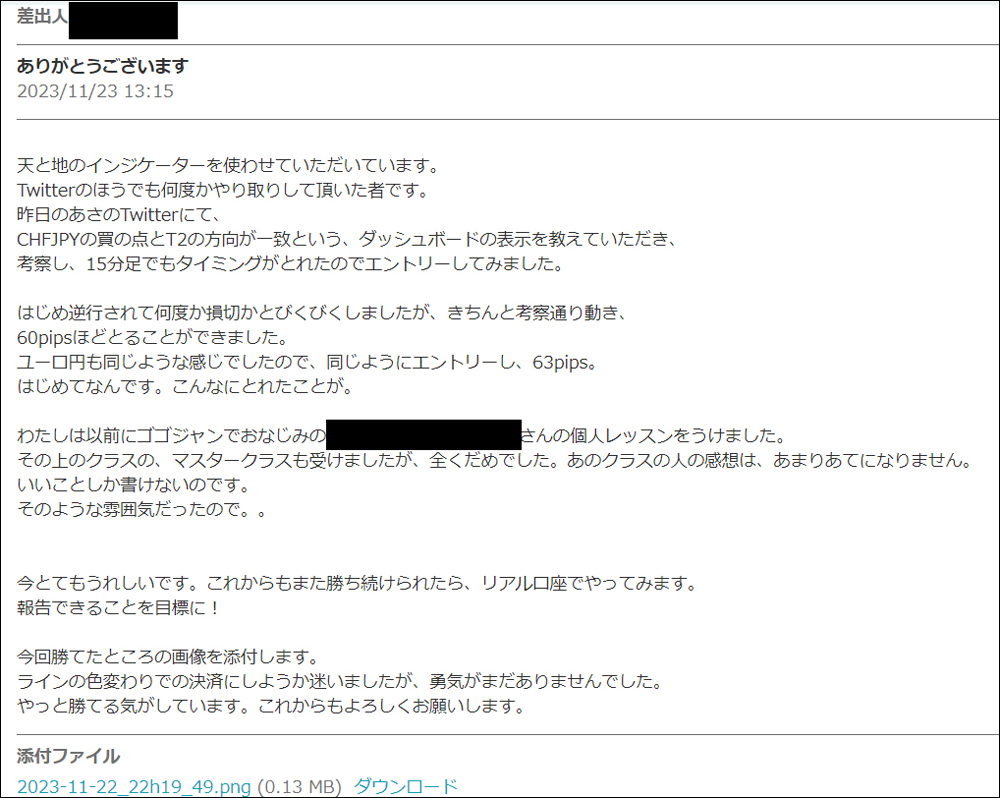
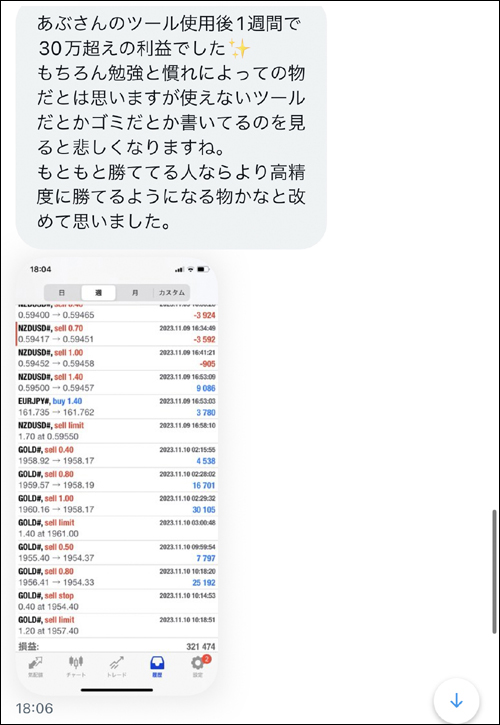
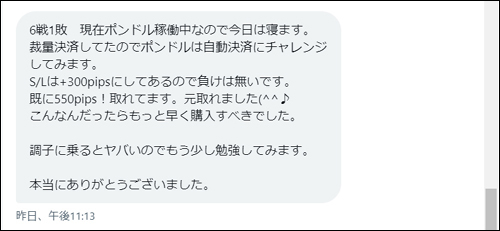
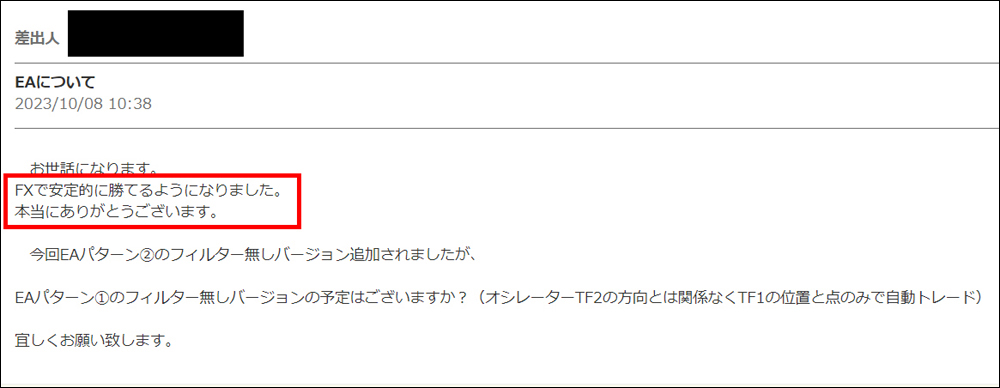
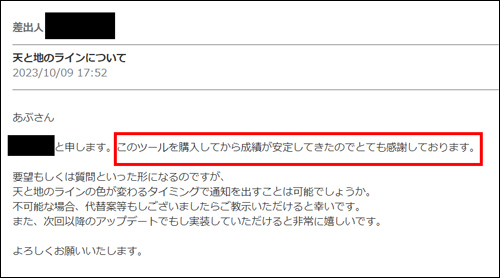
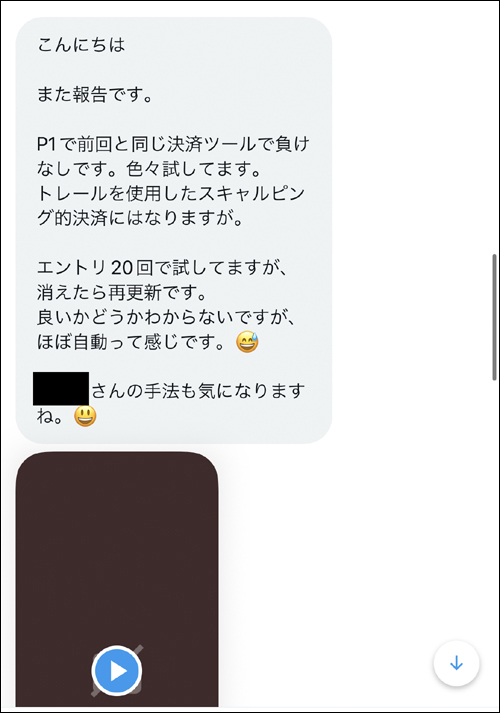
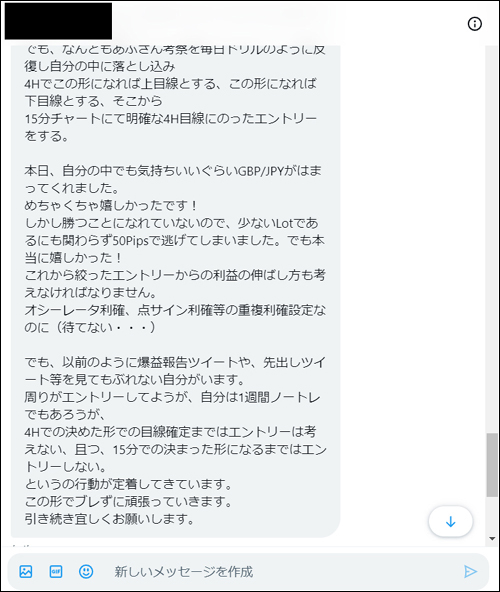
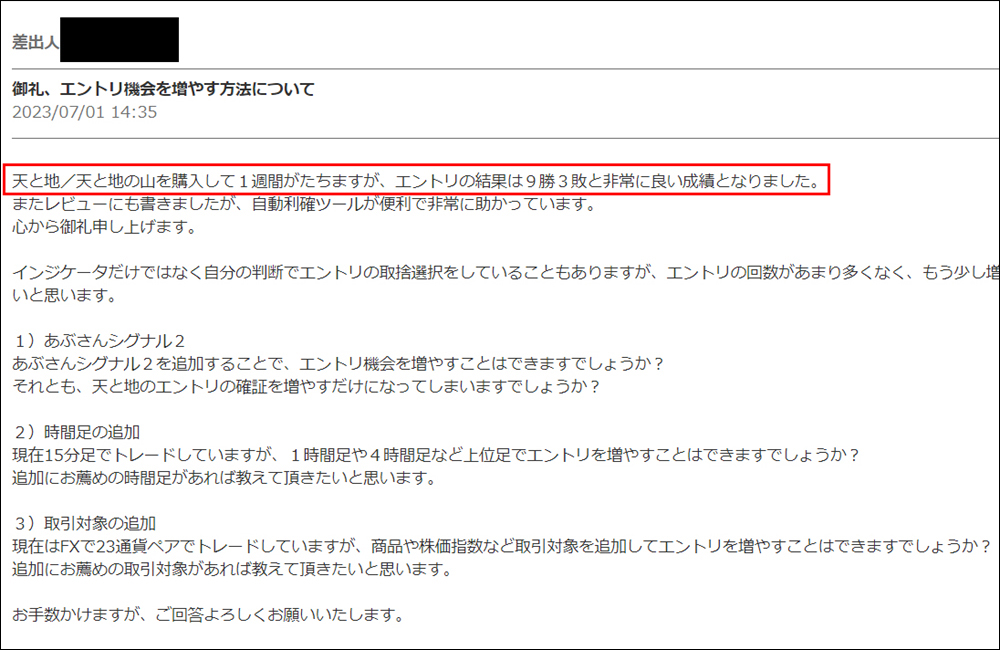
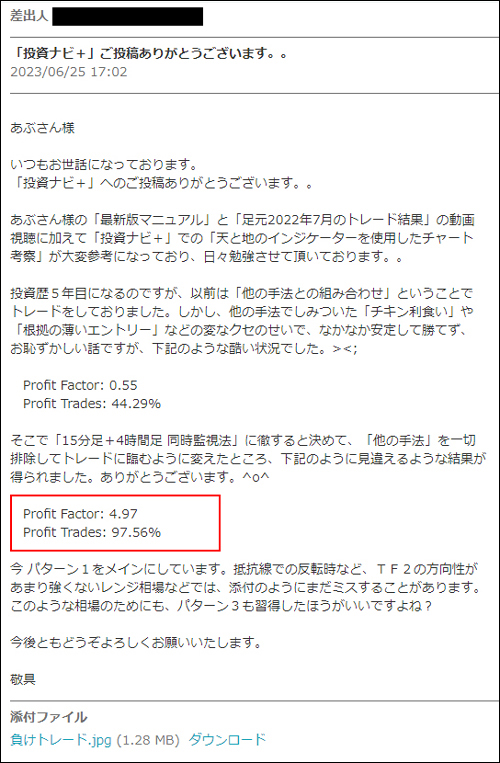
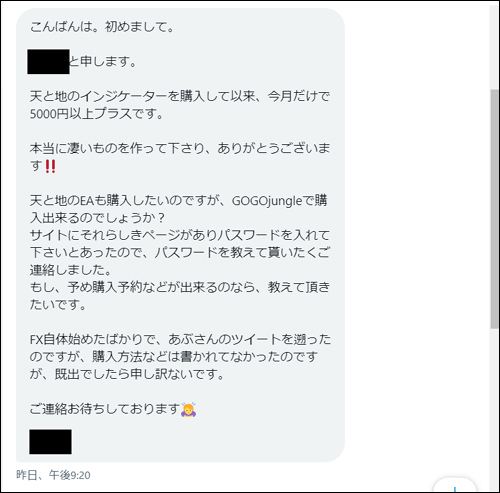
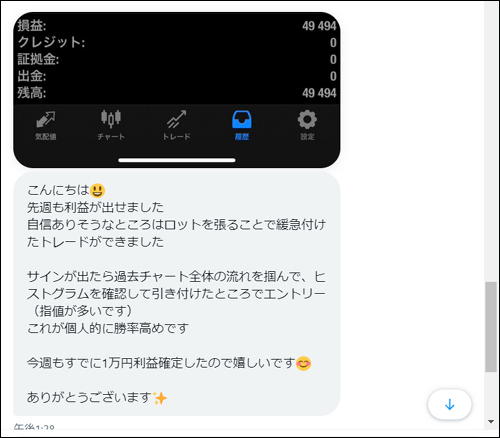
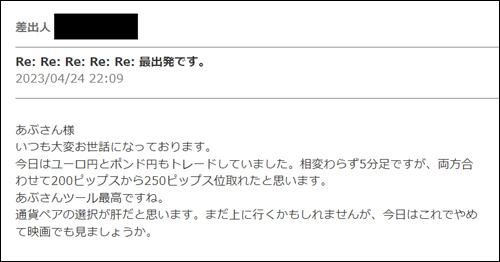
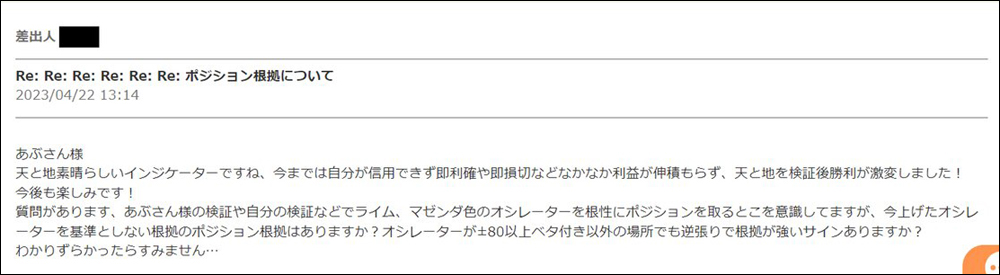
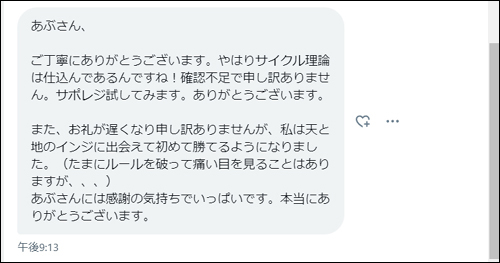
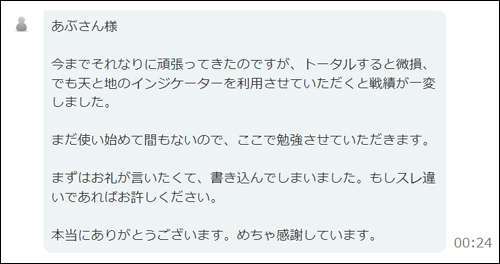
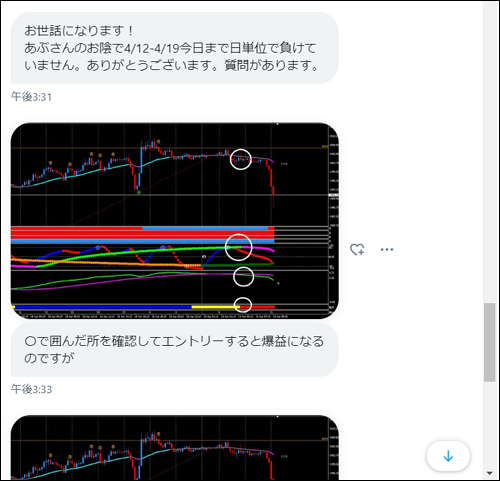
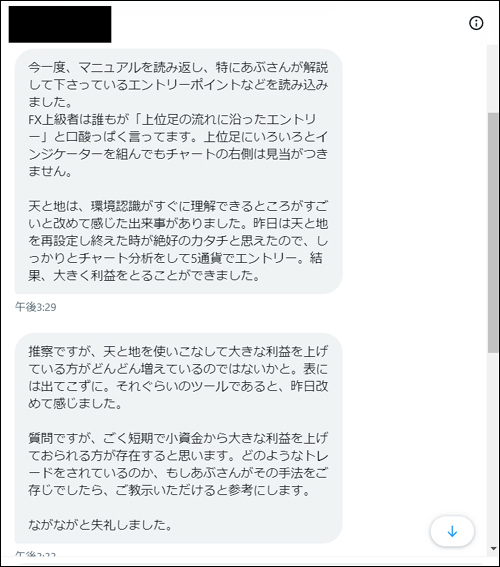
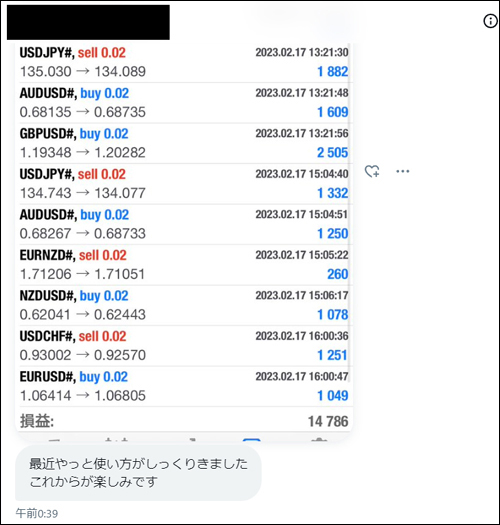
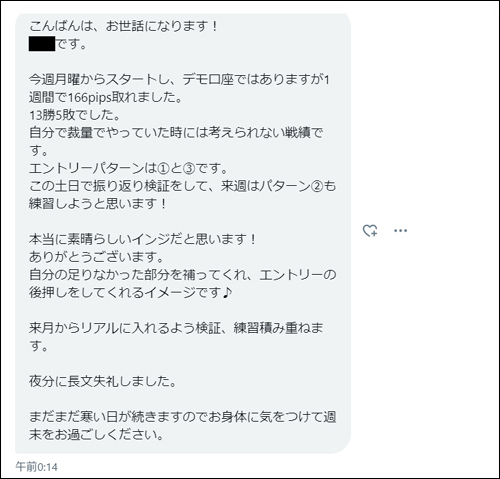
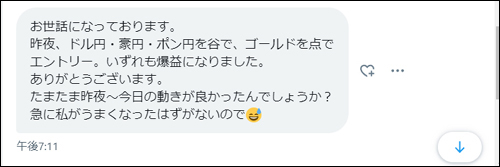
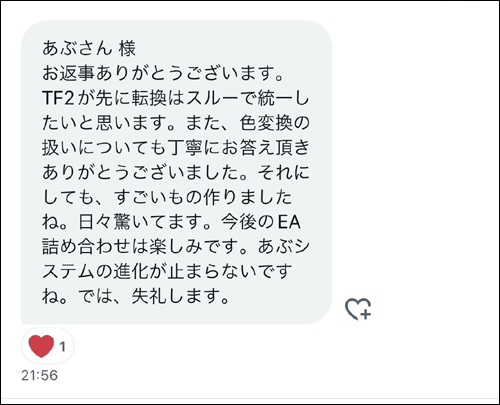
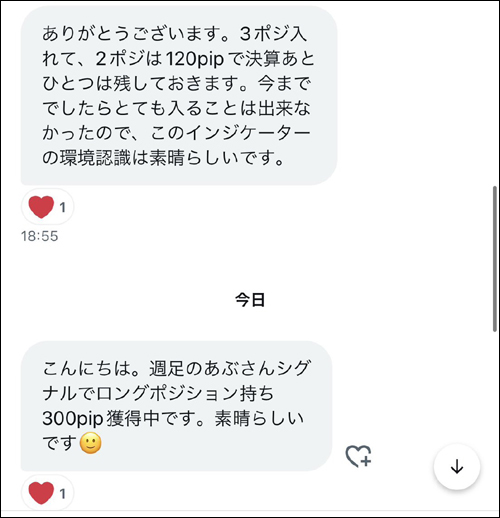
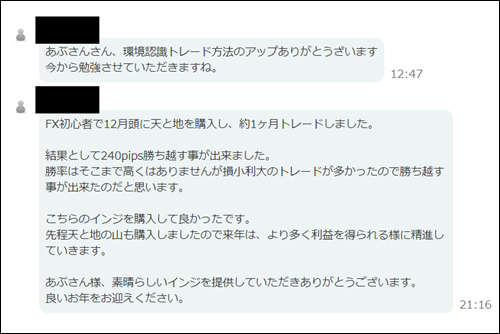
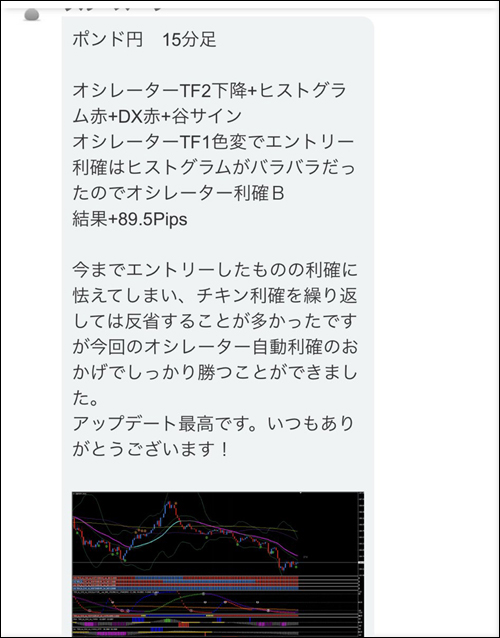
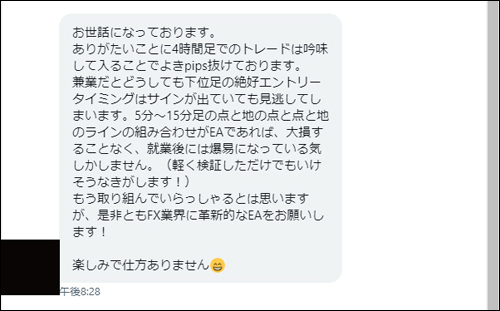
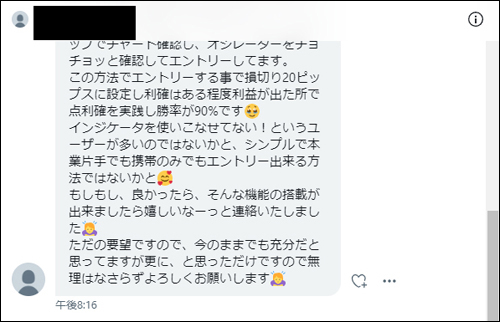
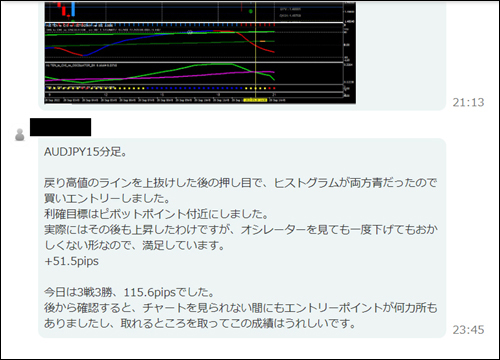
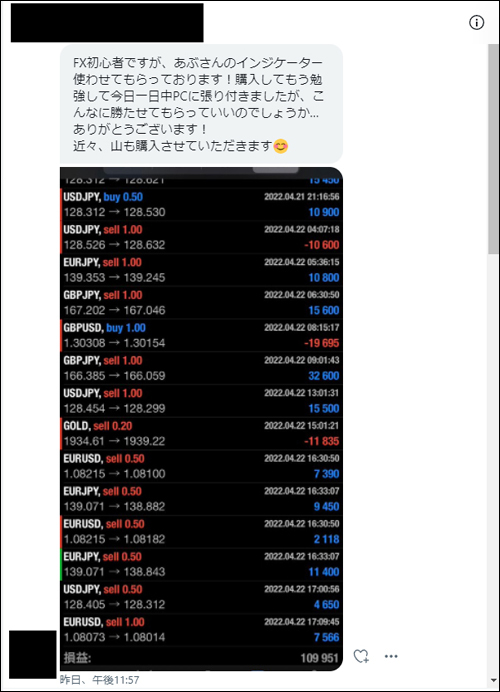
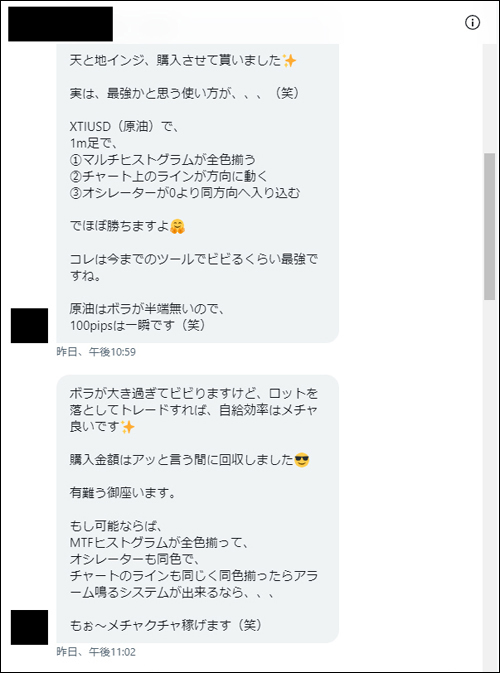
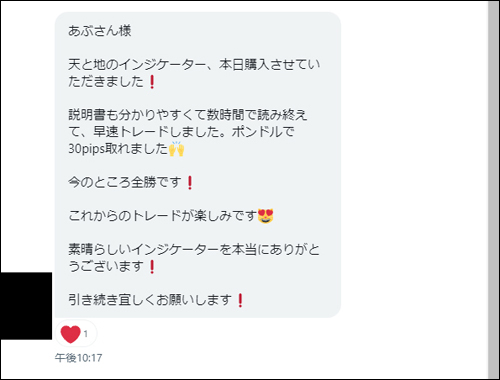
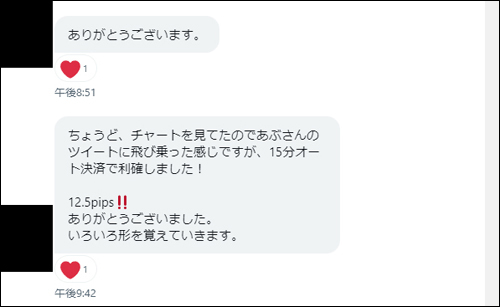
・User impressions (review version) from those who actually used the Heaven and Earth indicators
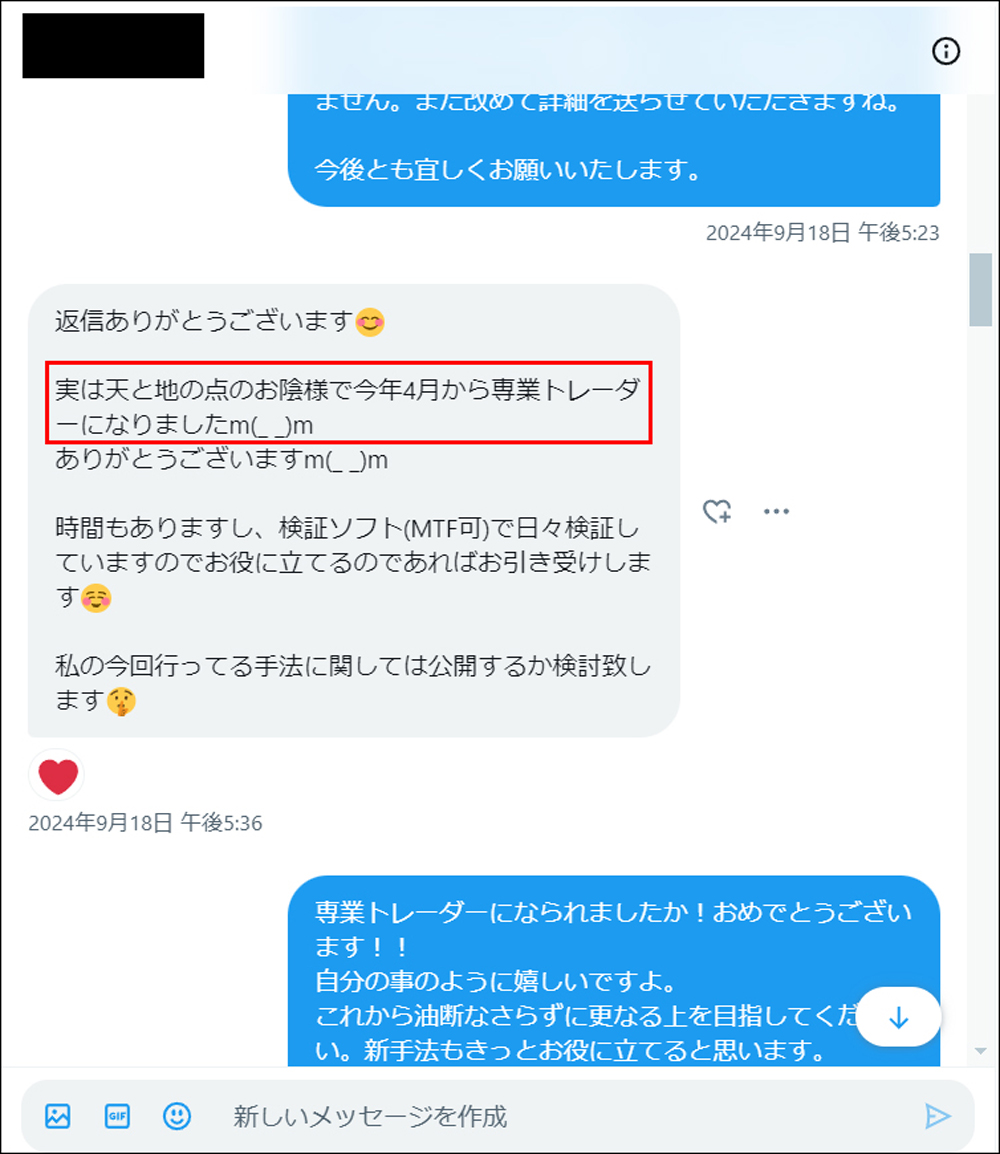
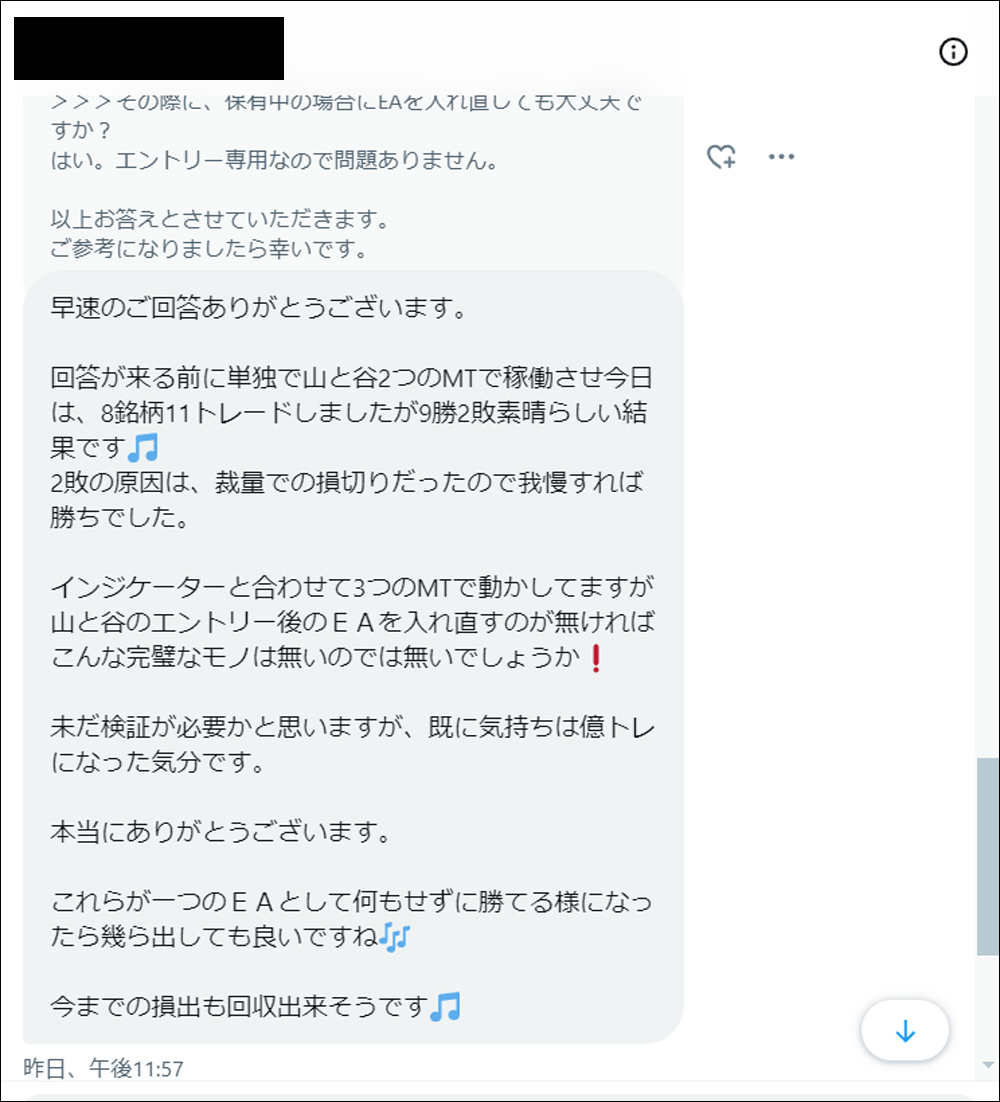
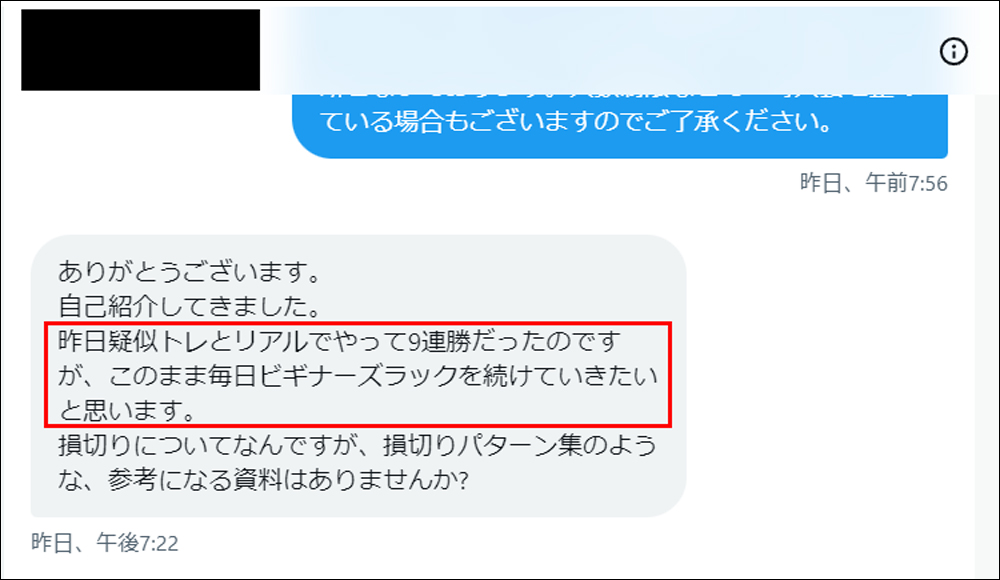
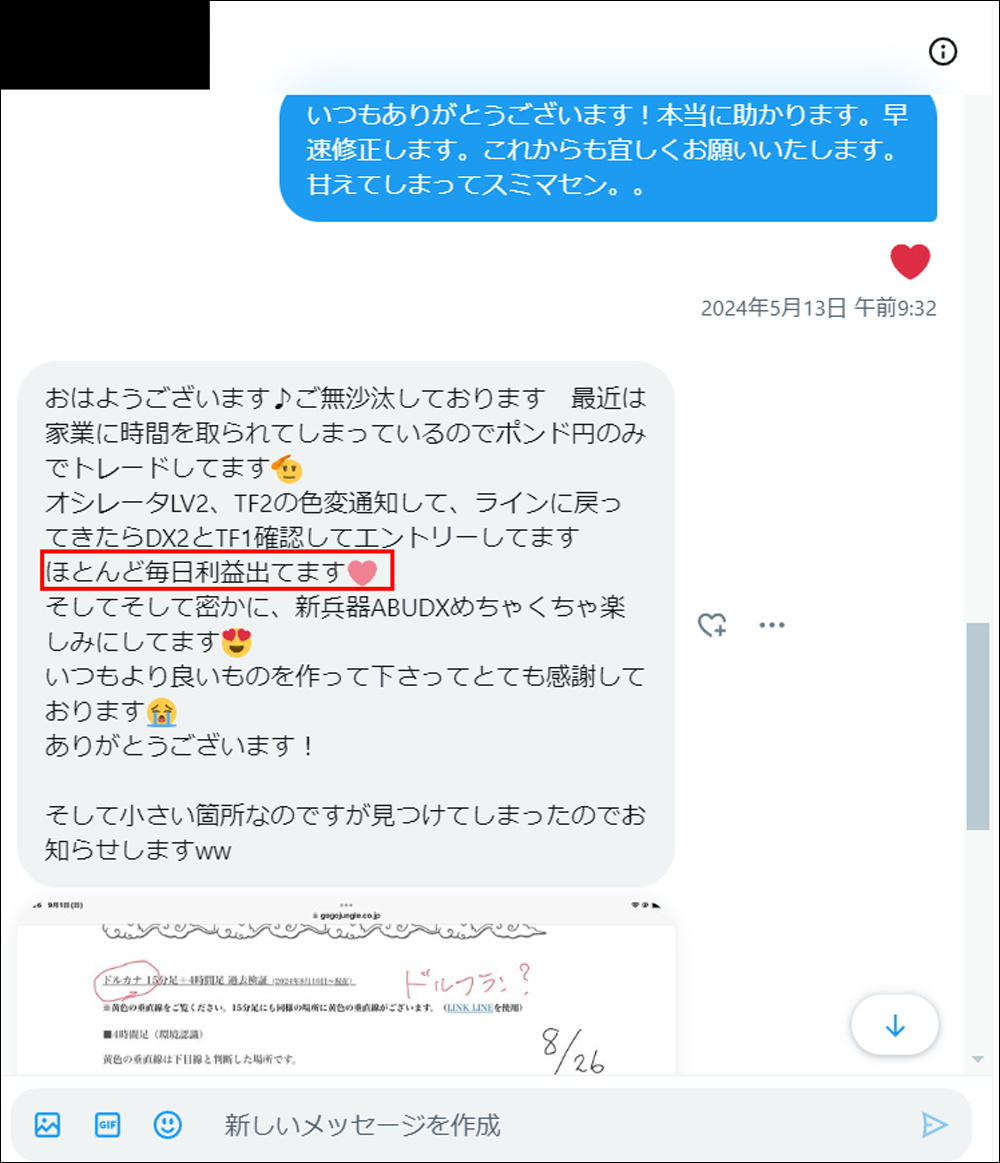
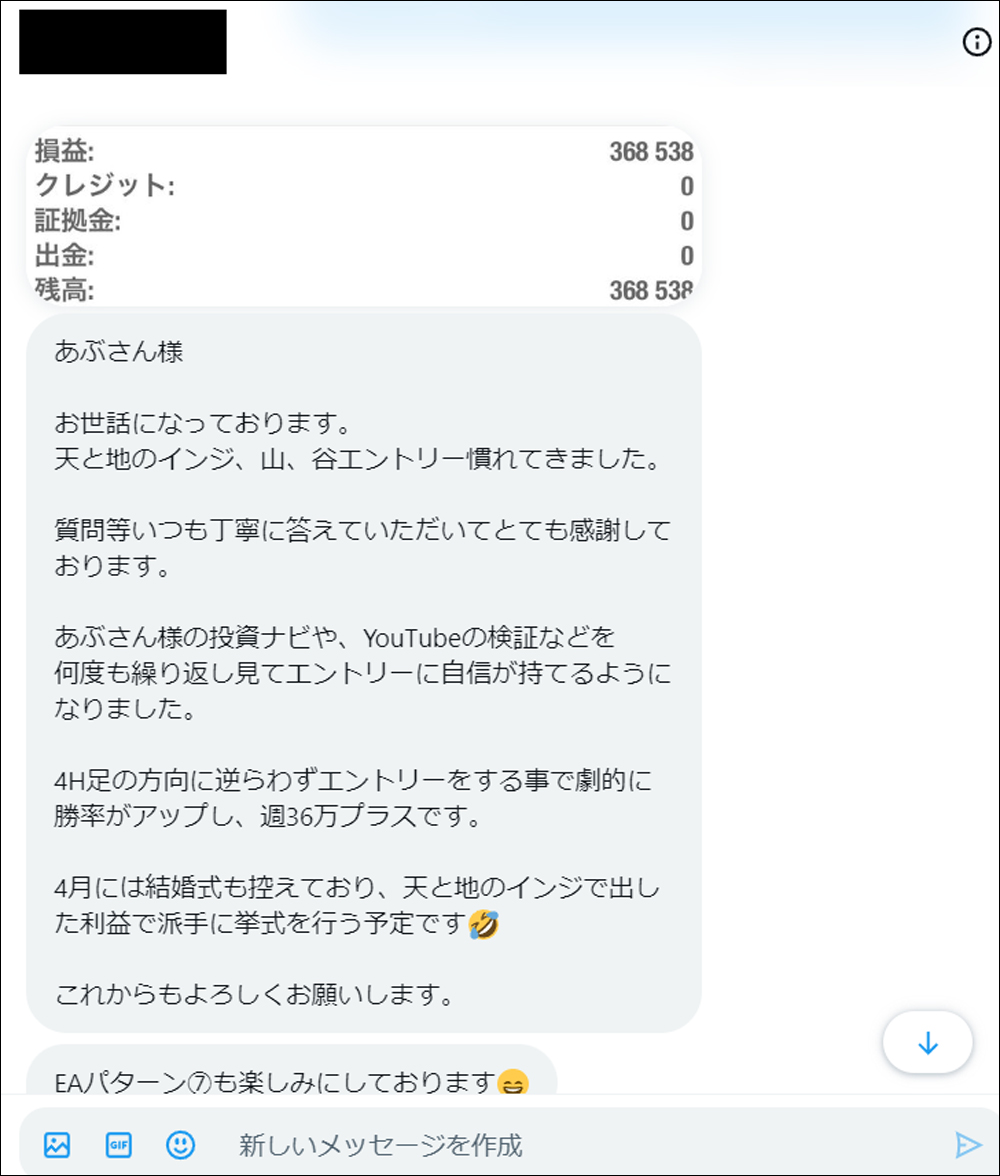
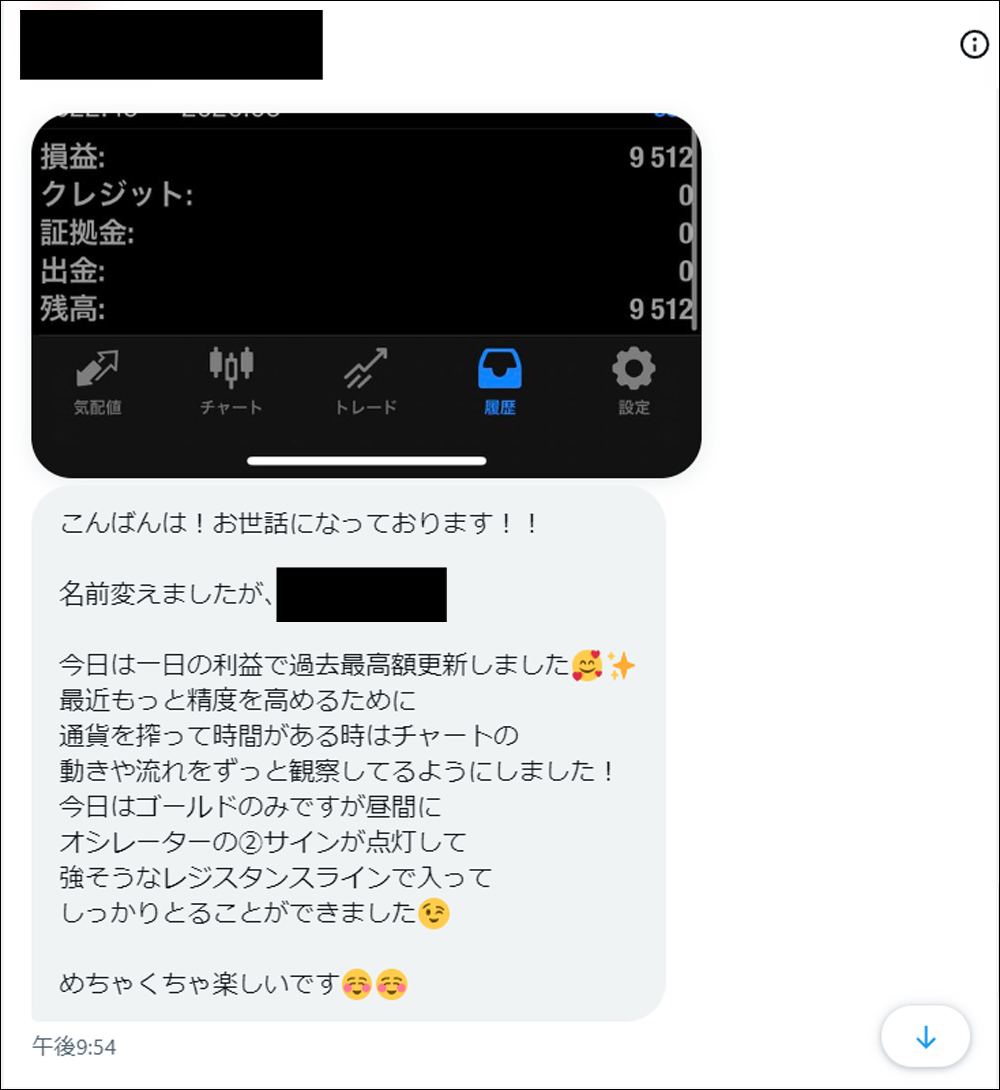
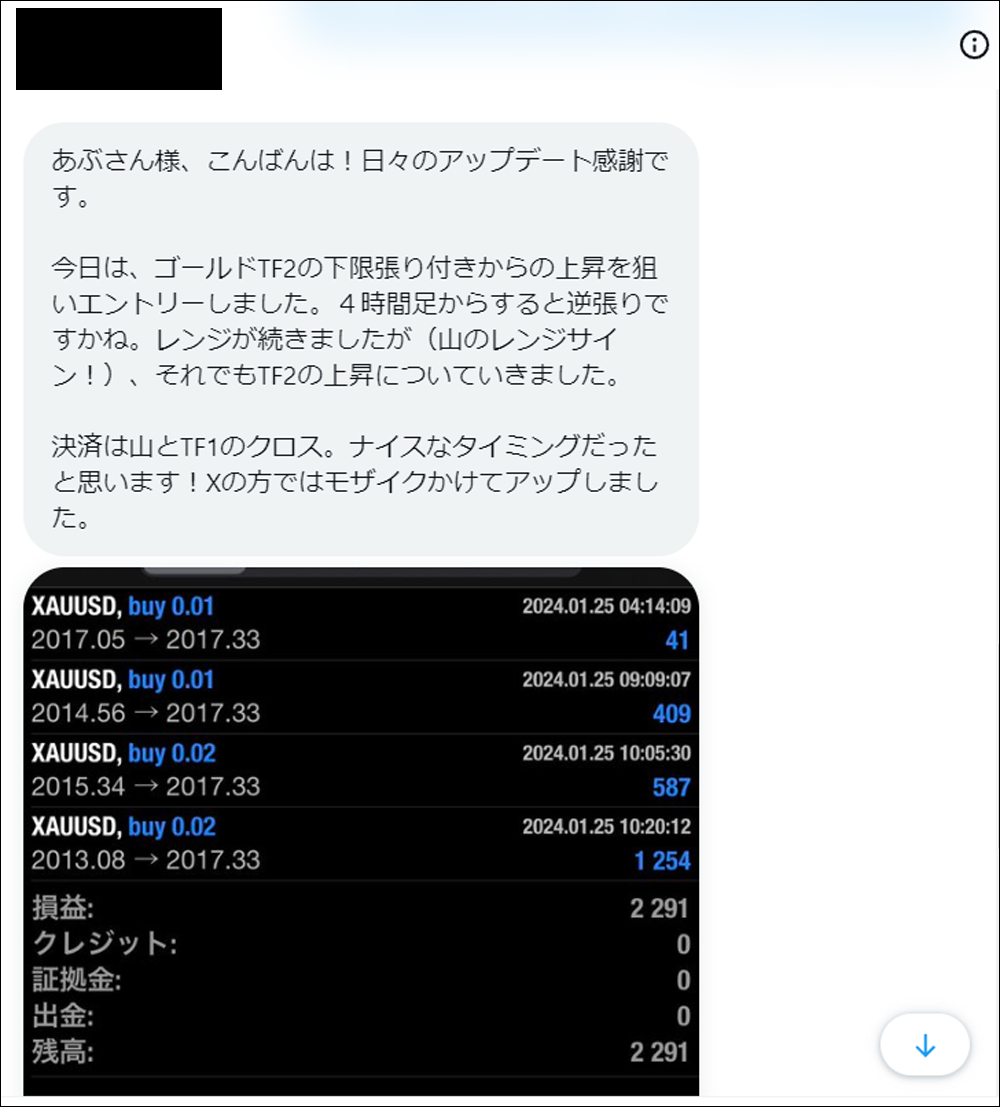
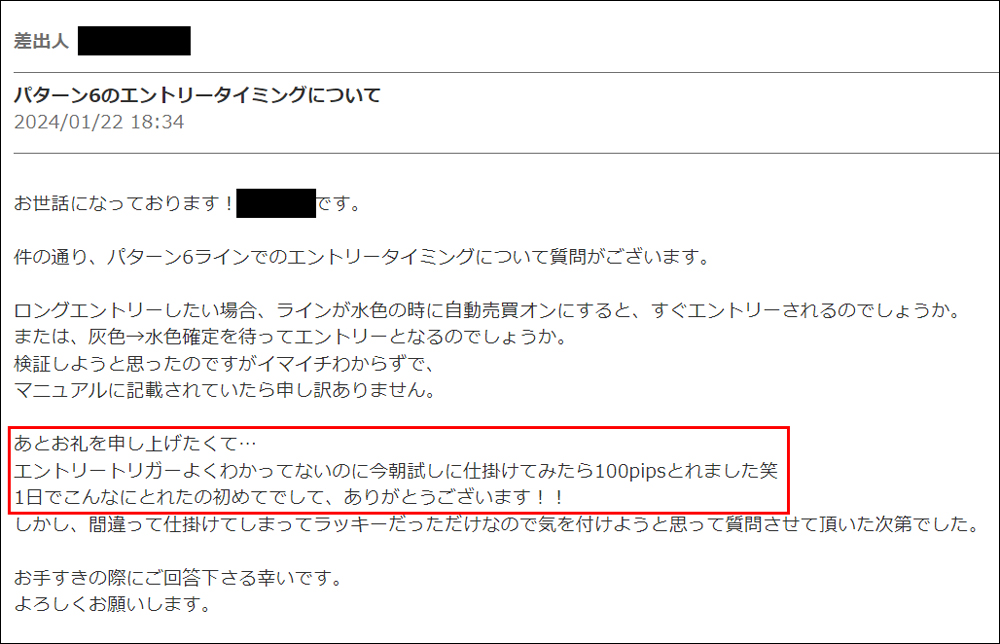
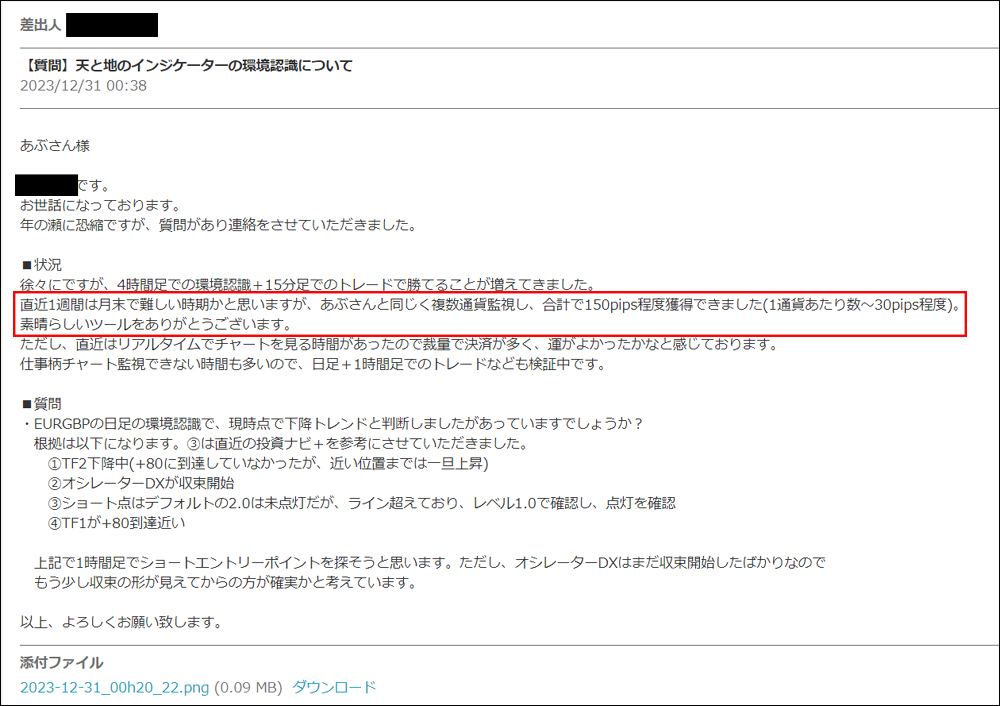
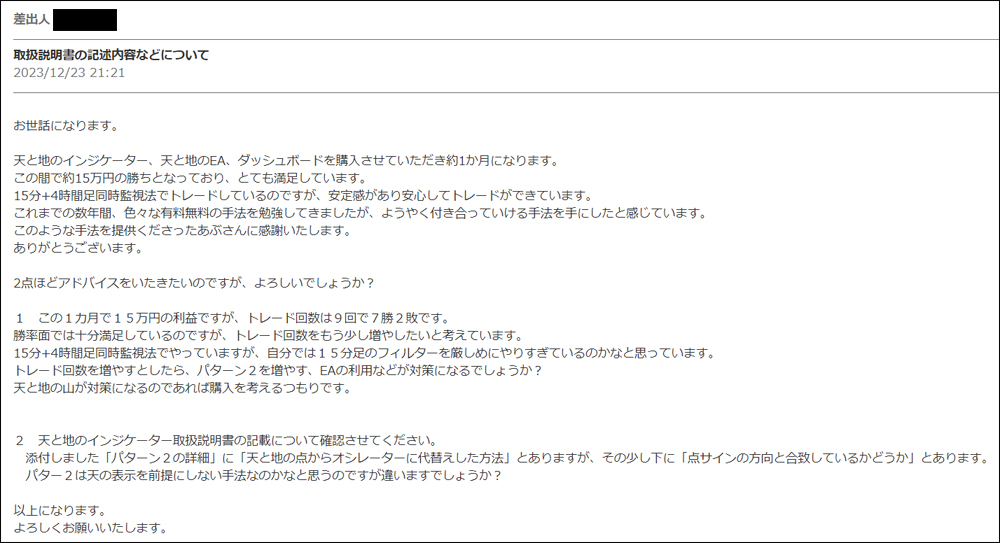
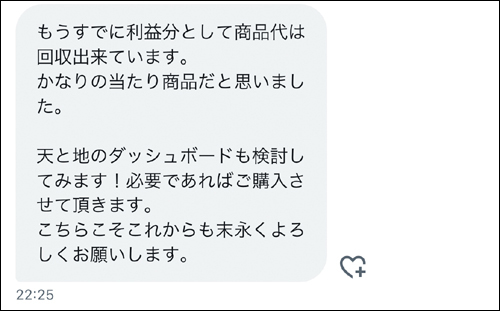
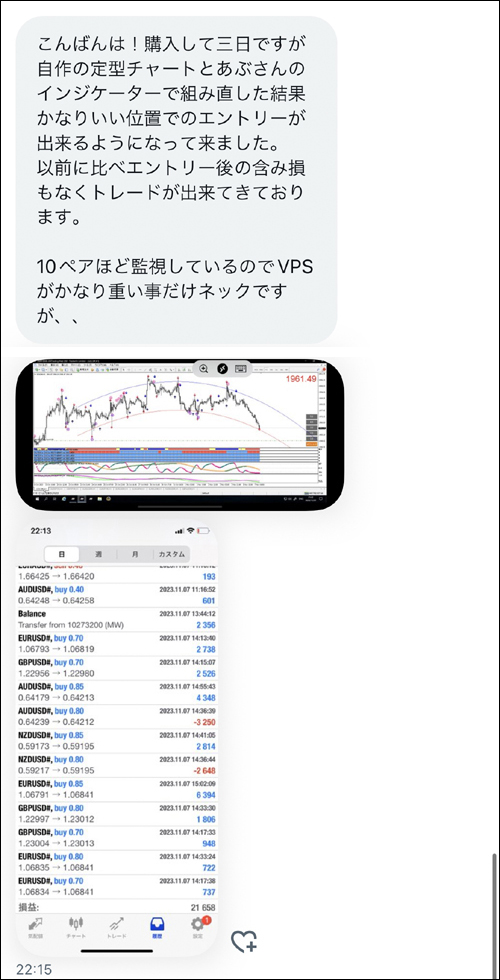
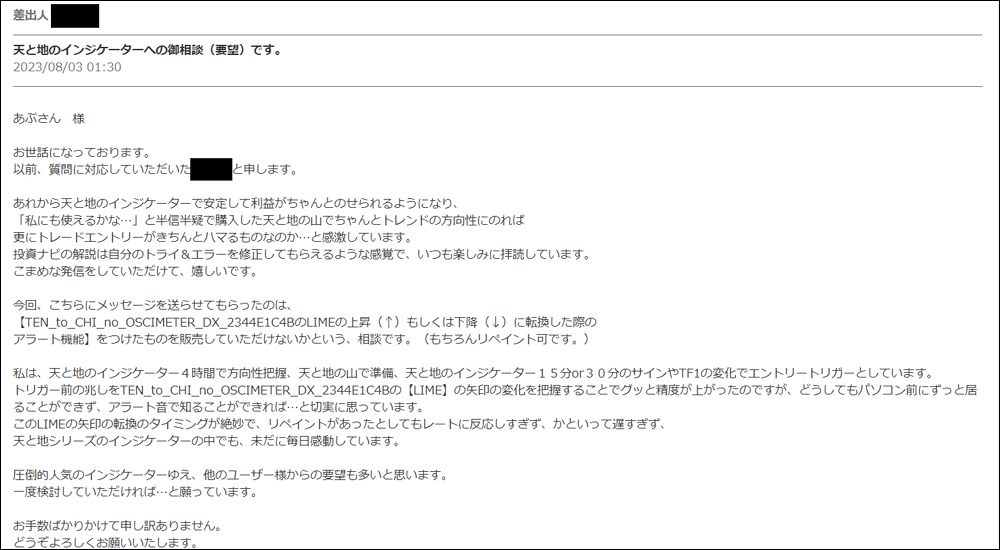
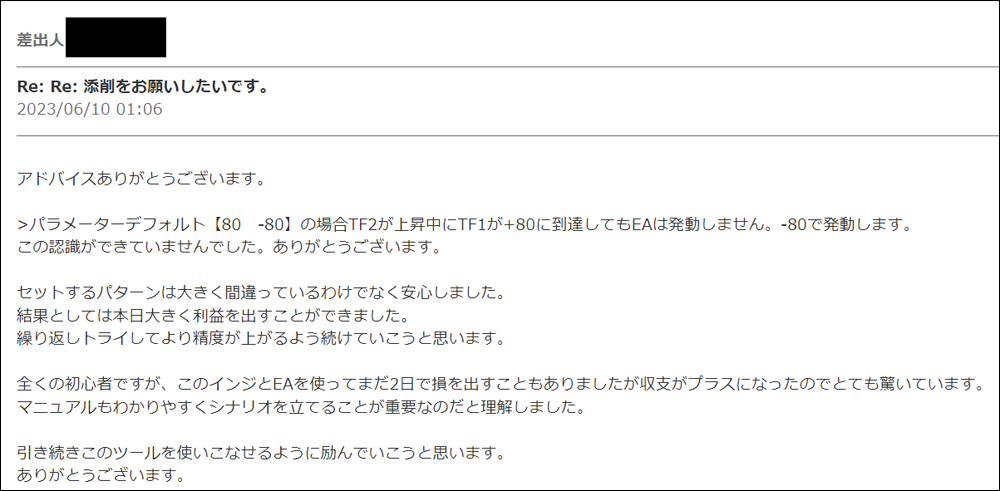
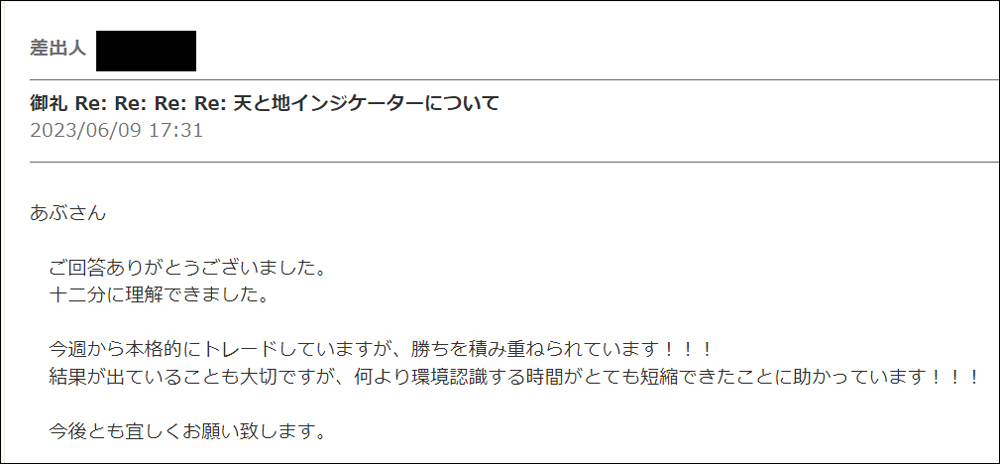
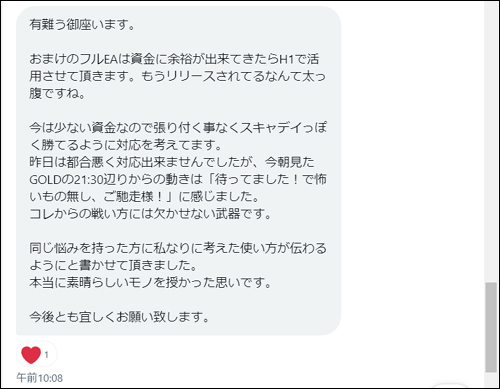
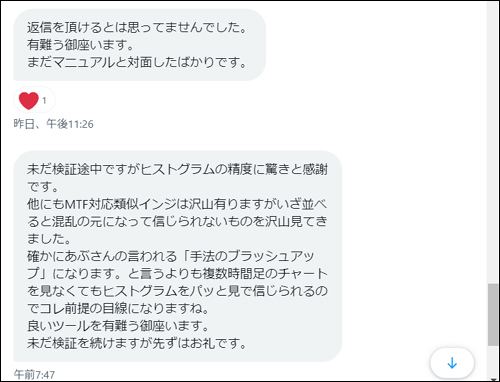
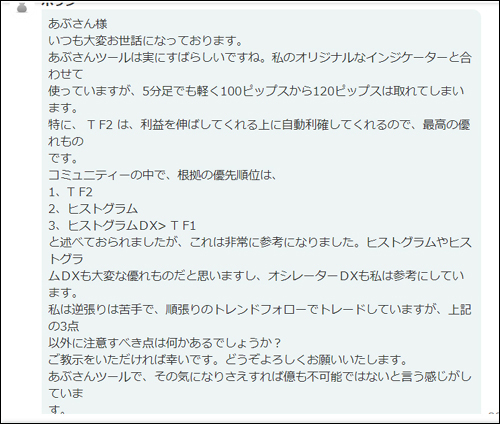
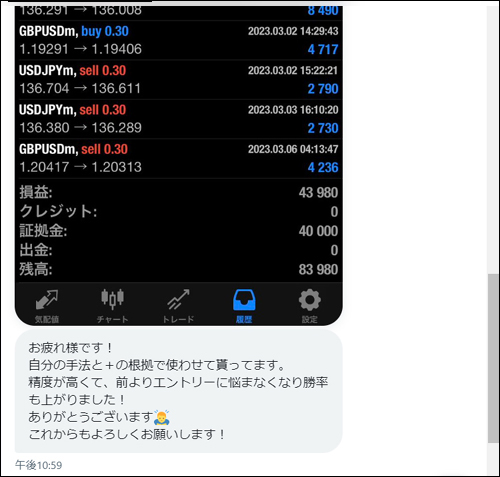
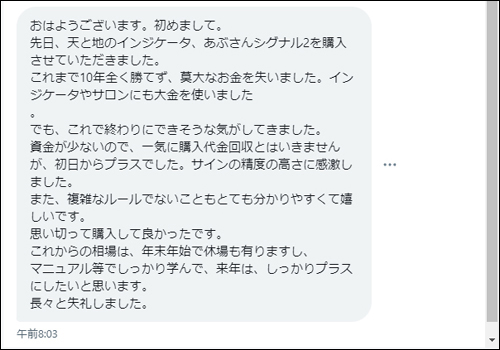
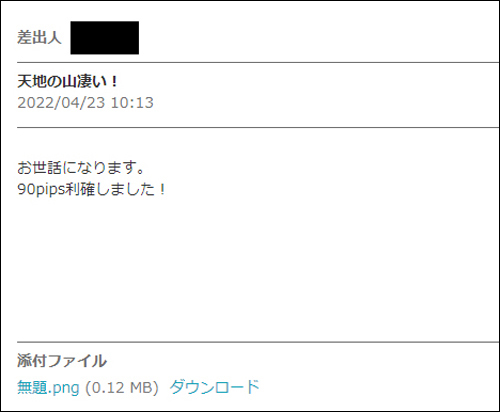
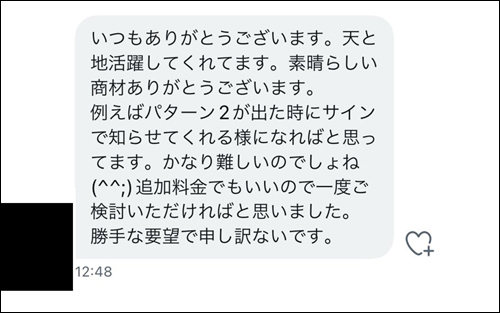
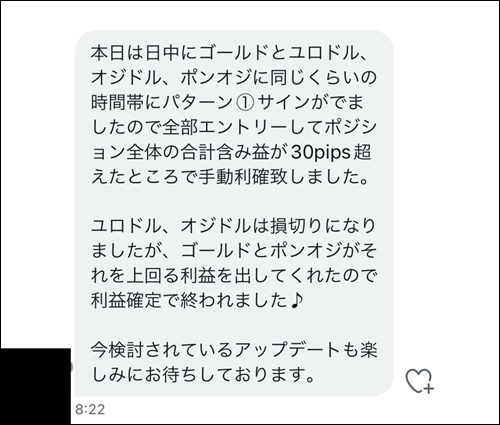
・User impressions (DM version) from those who actually used the Heaven and Earth indicators
・I searched for “#Heaven and Earth Indicators”

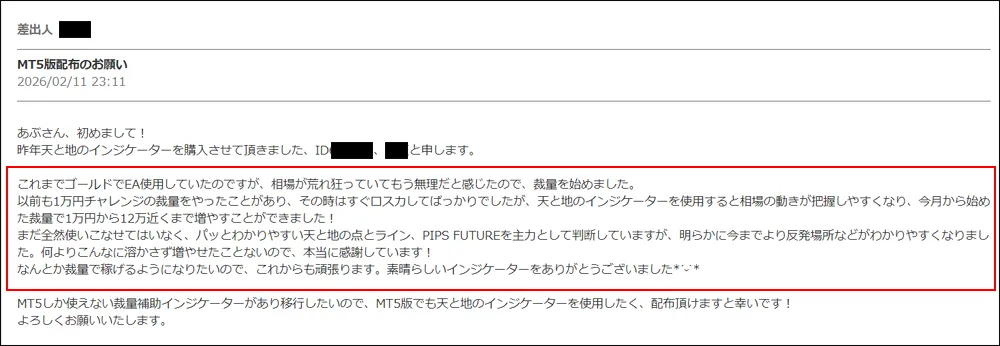
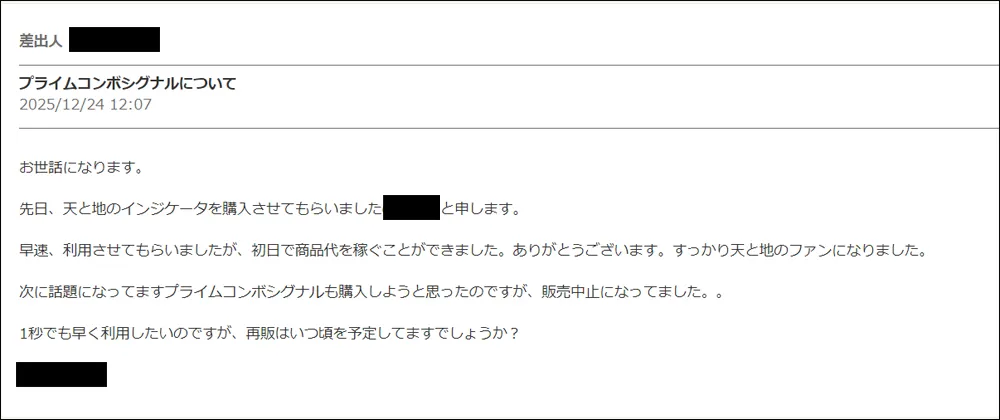
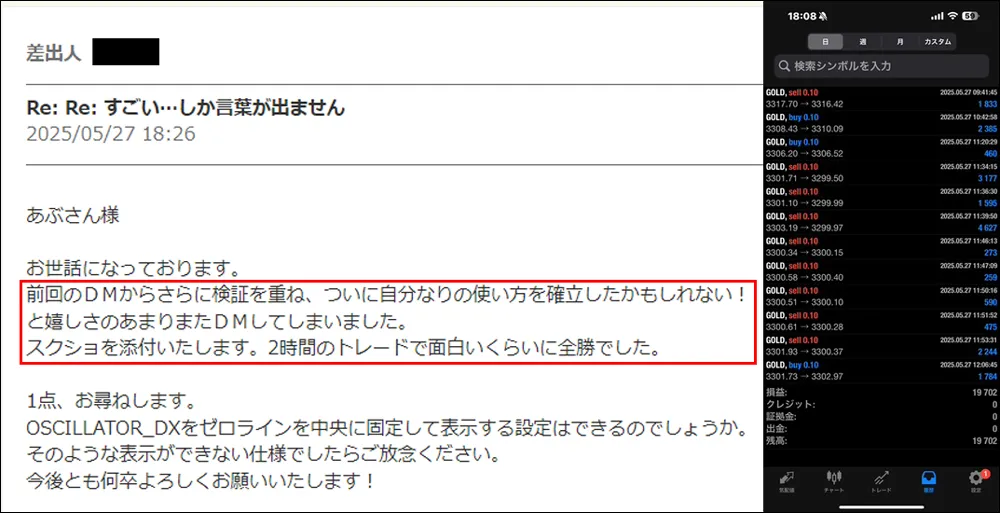
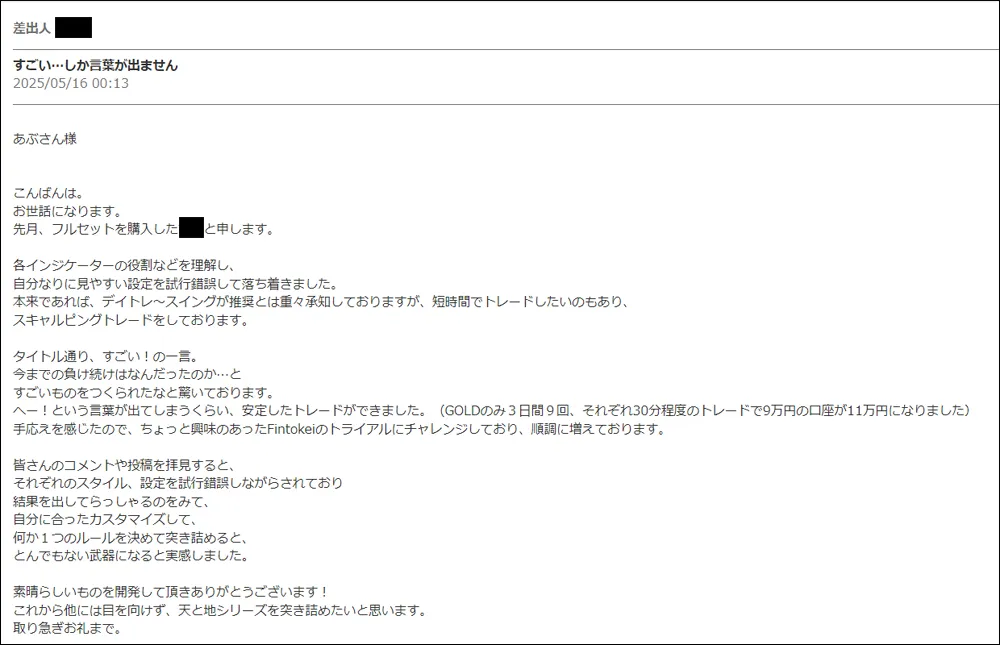
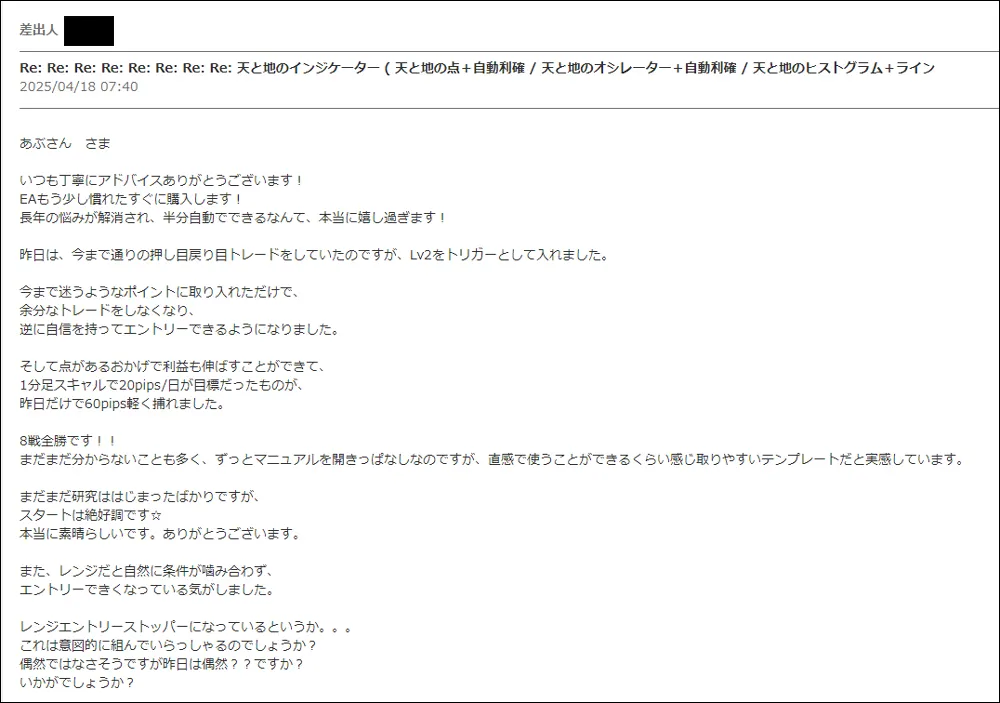
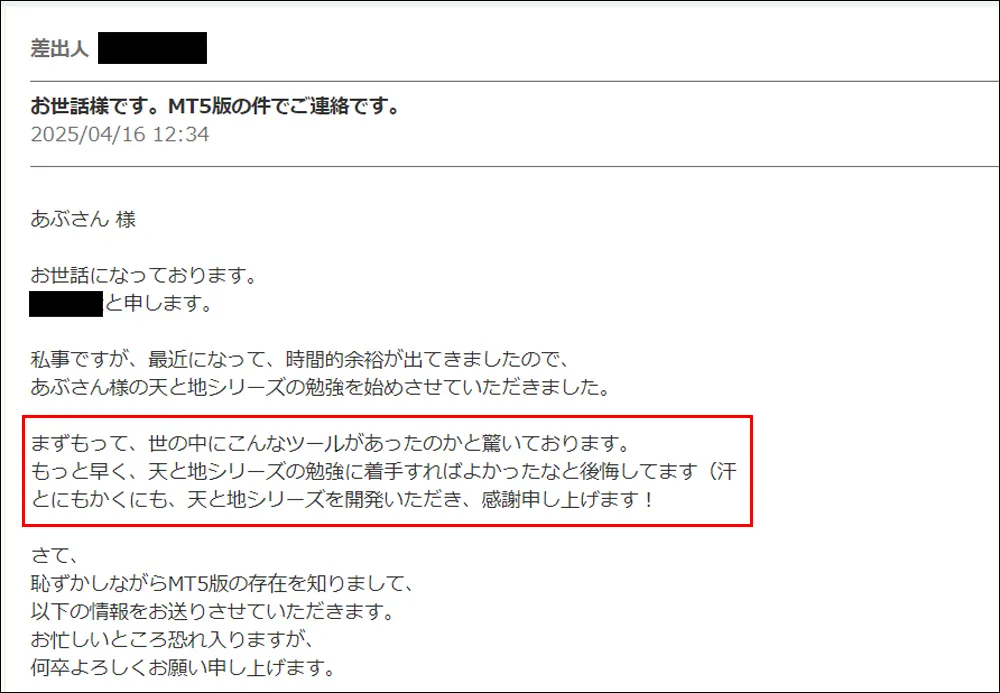
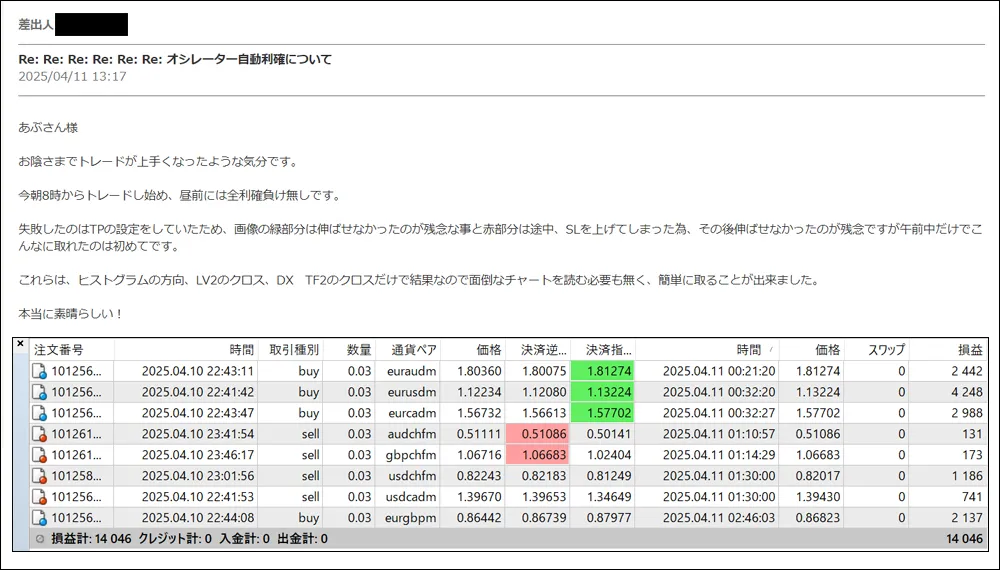
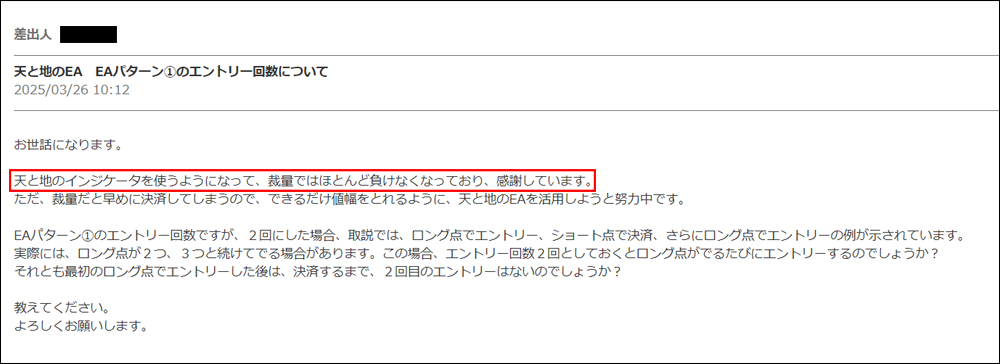
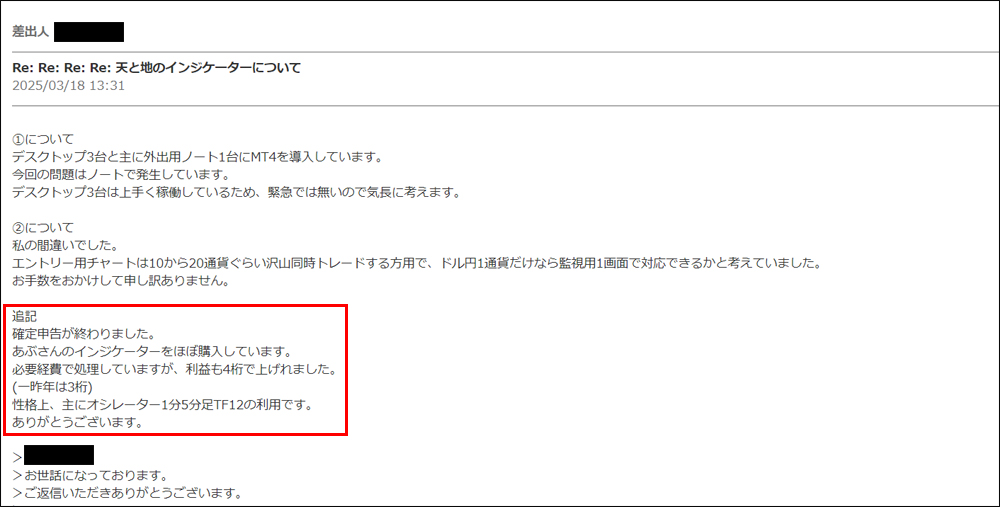
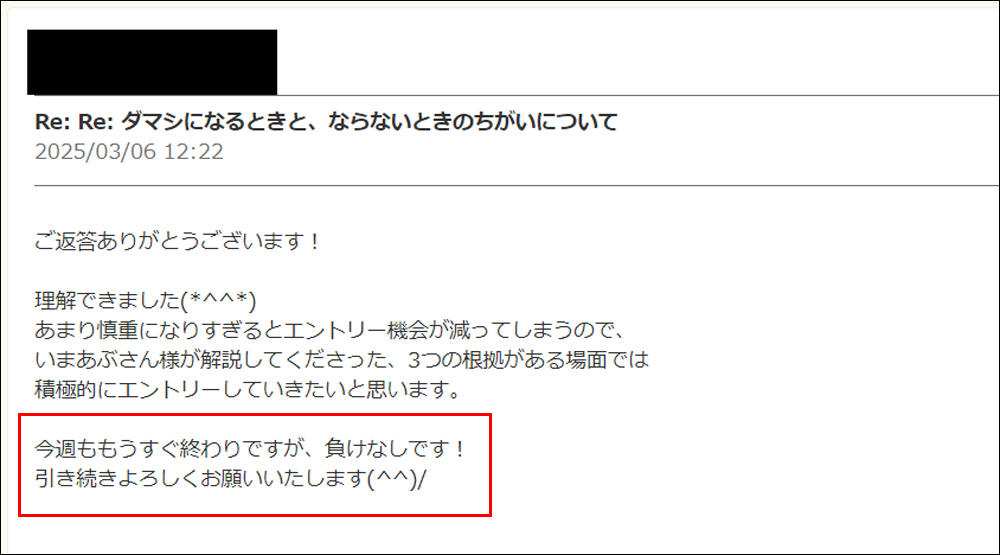
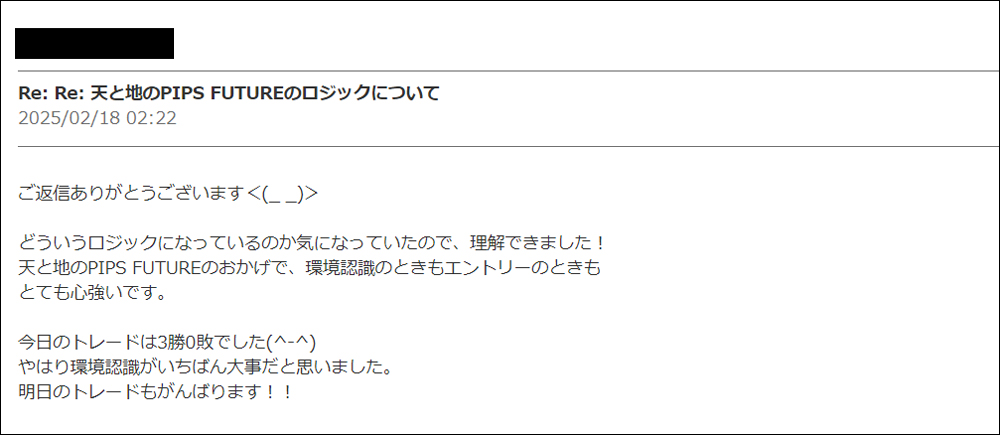
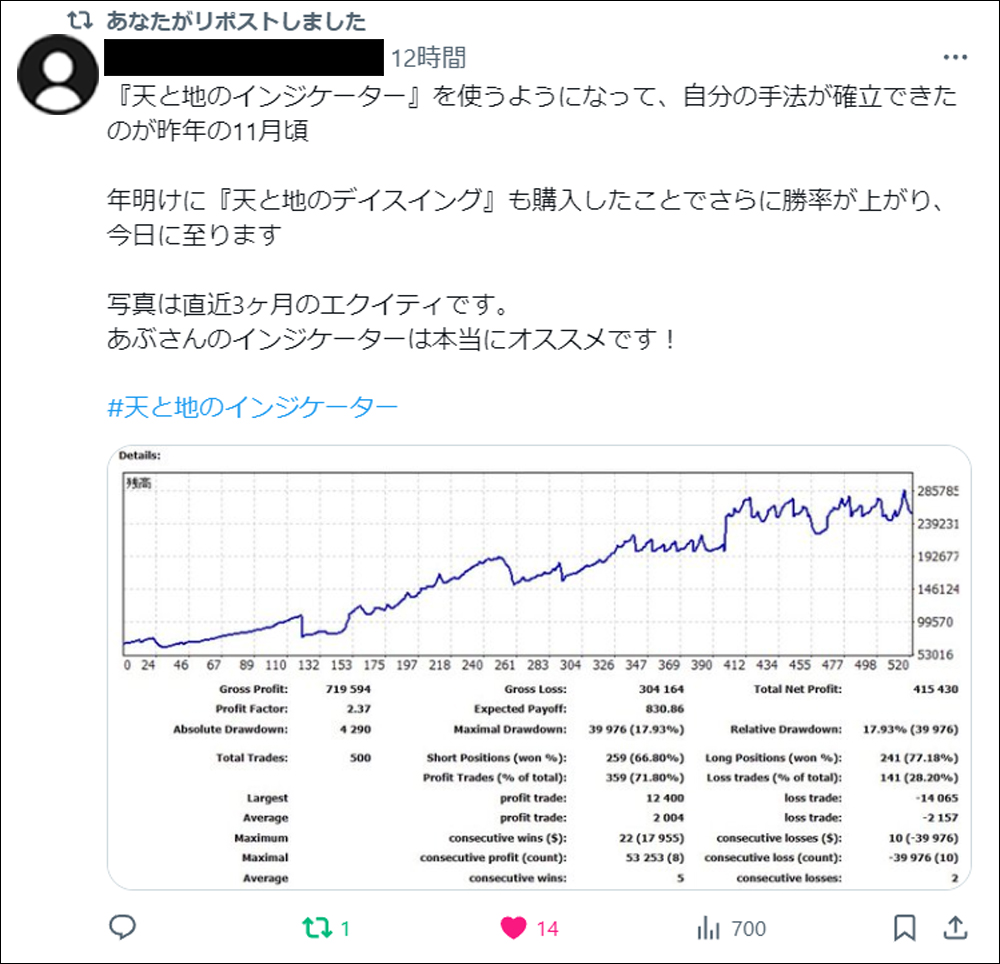


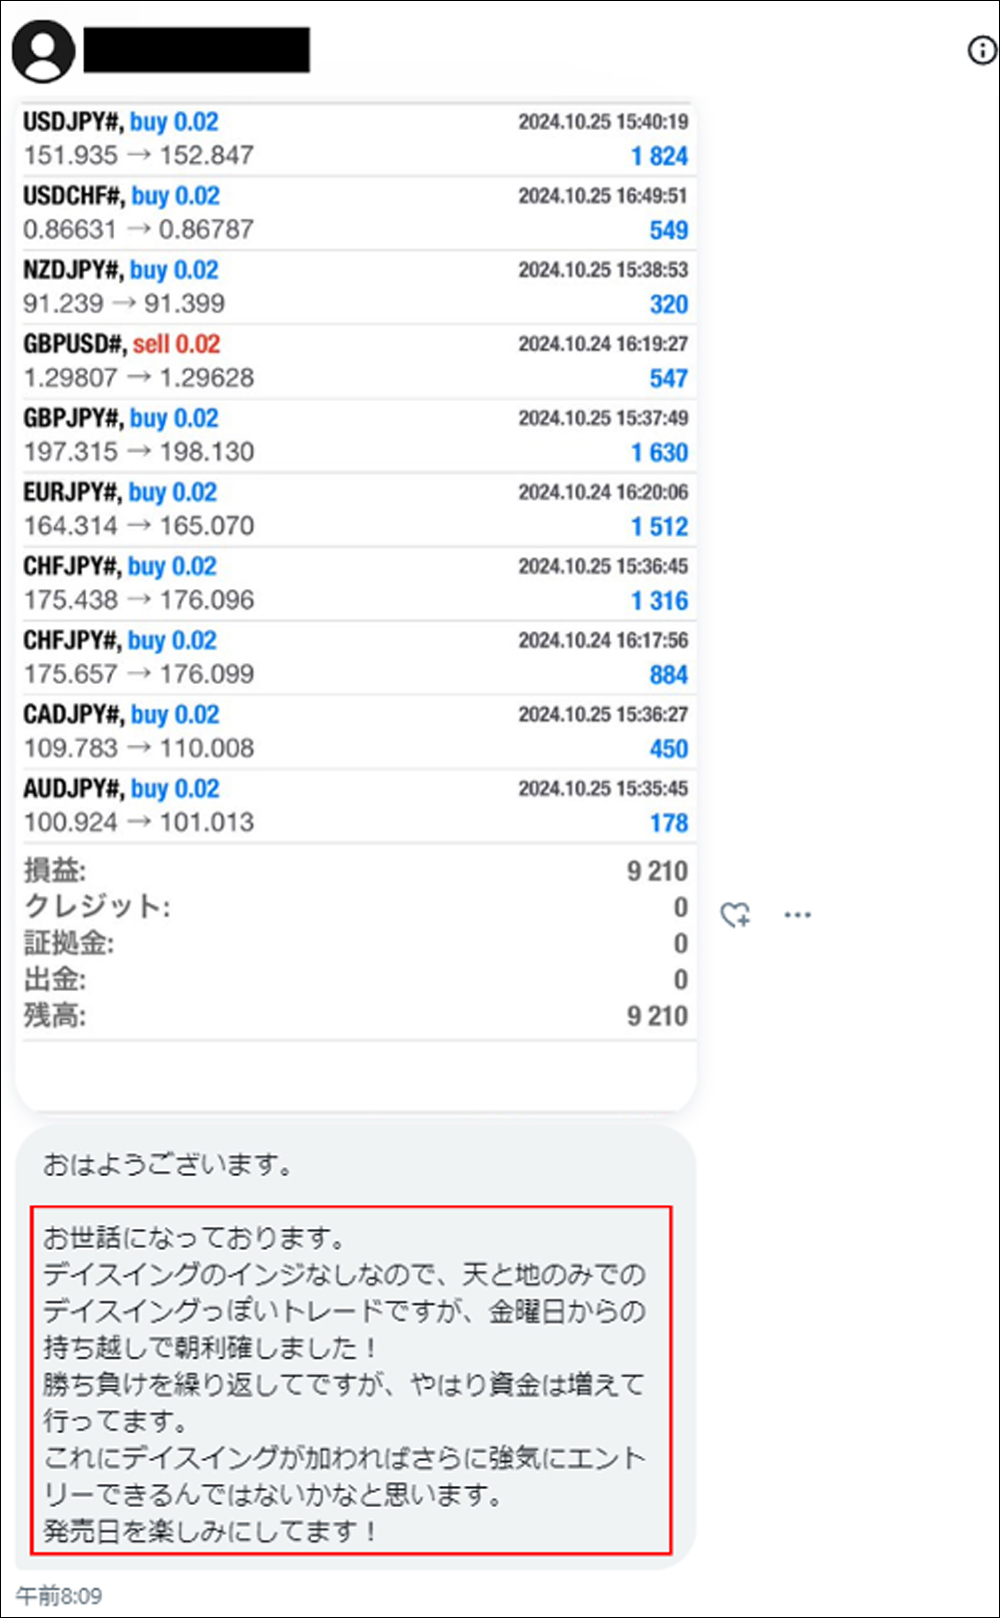
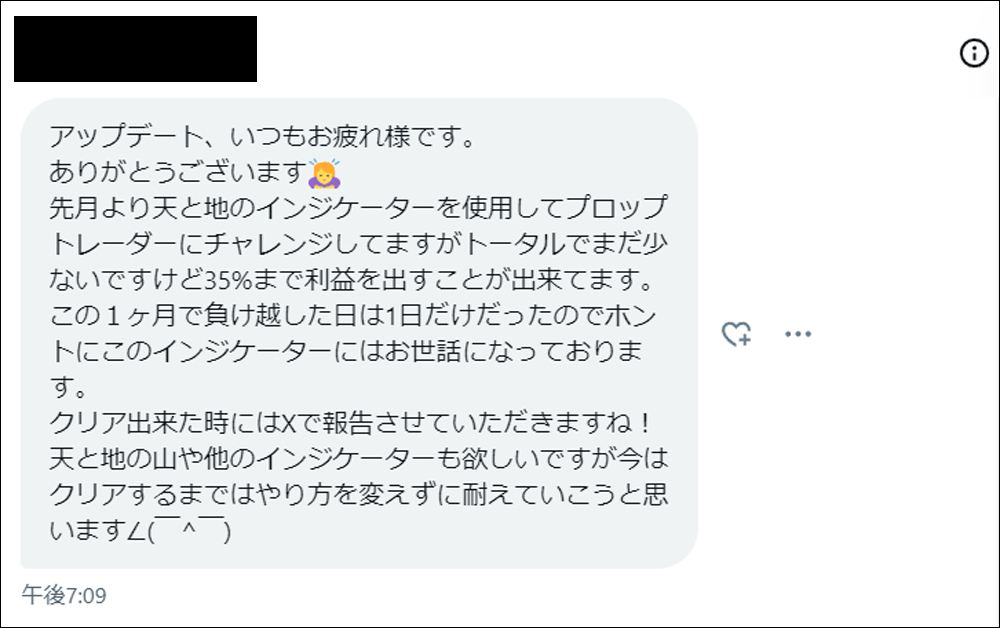
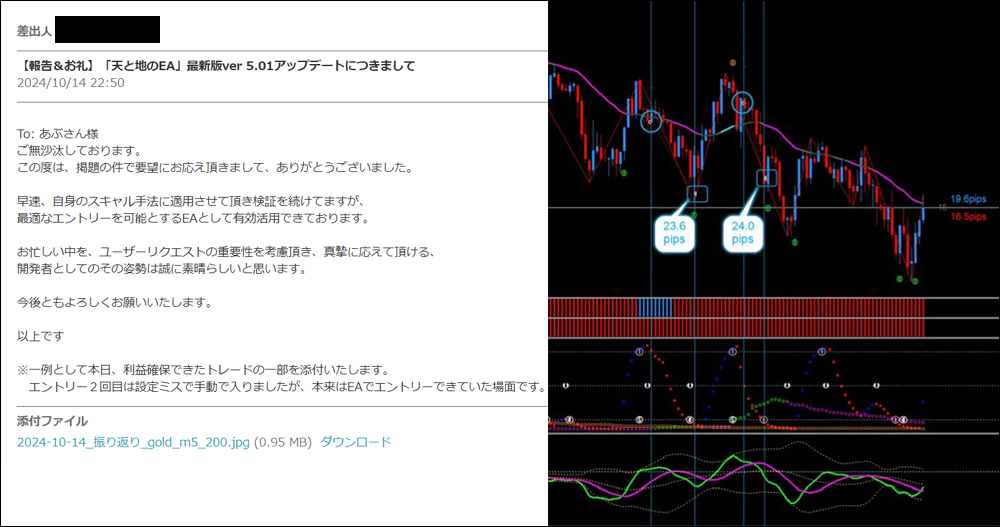
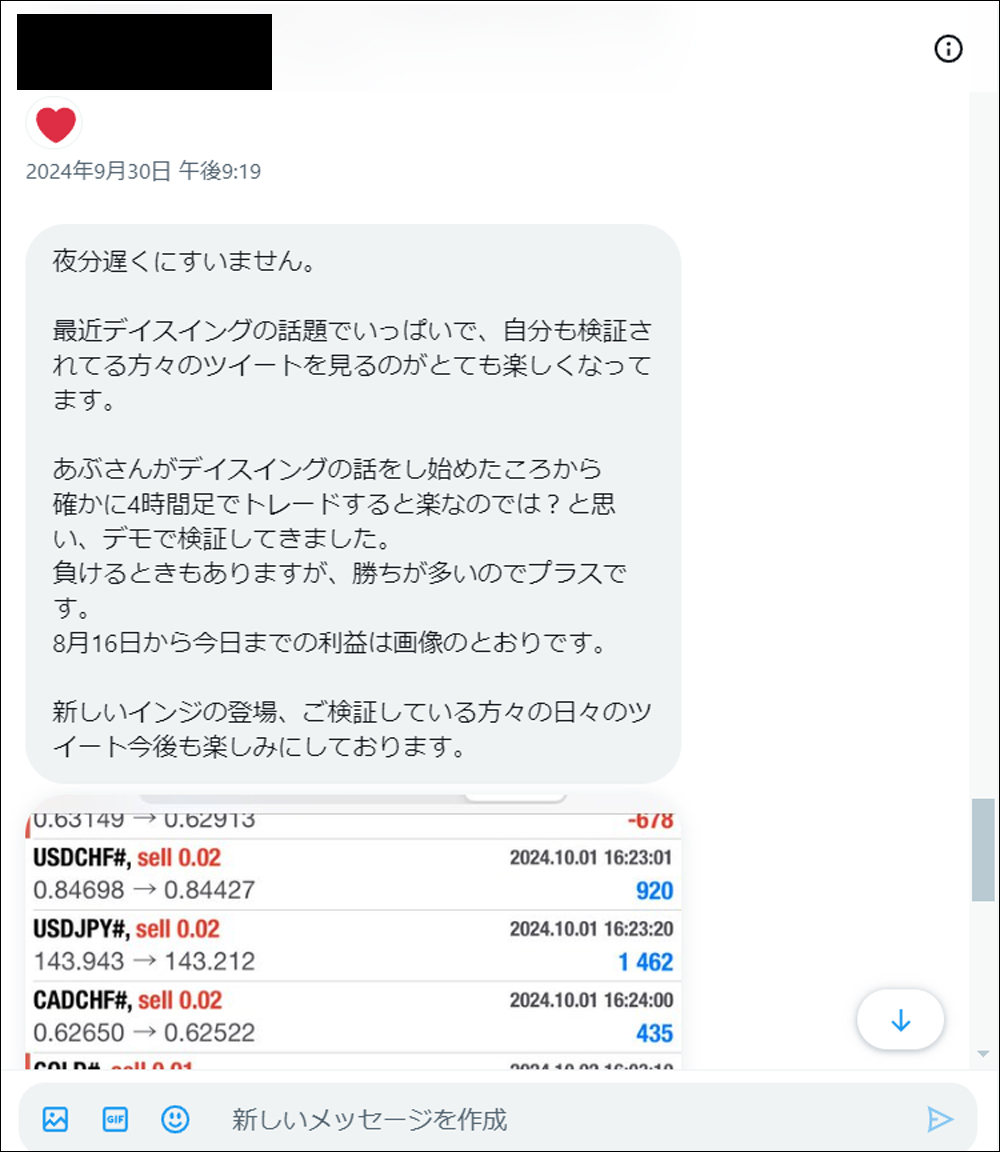




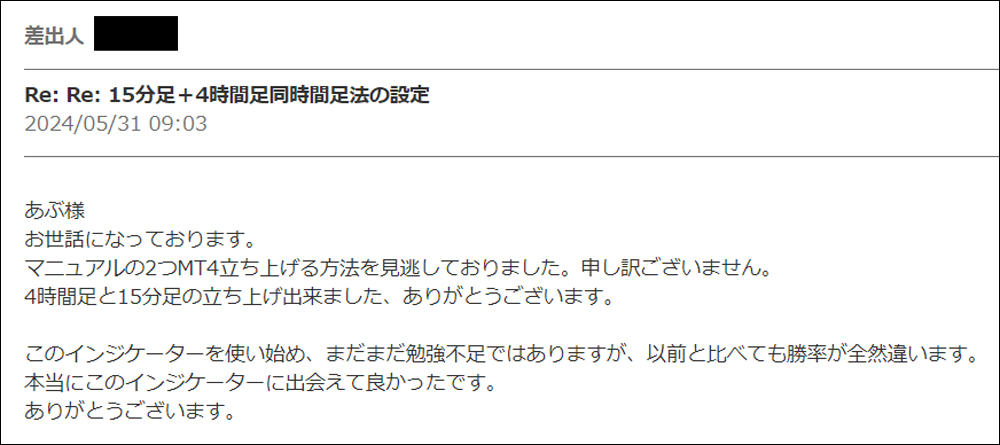
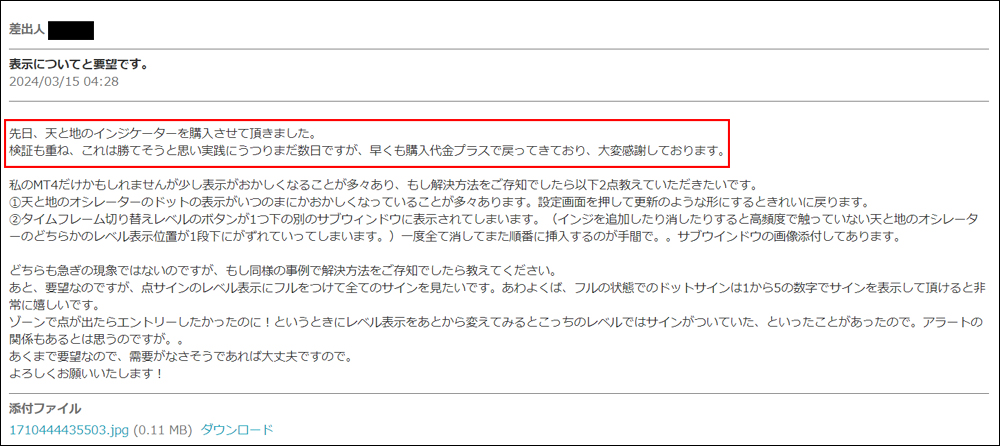
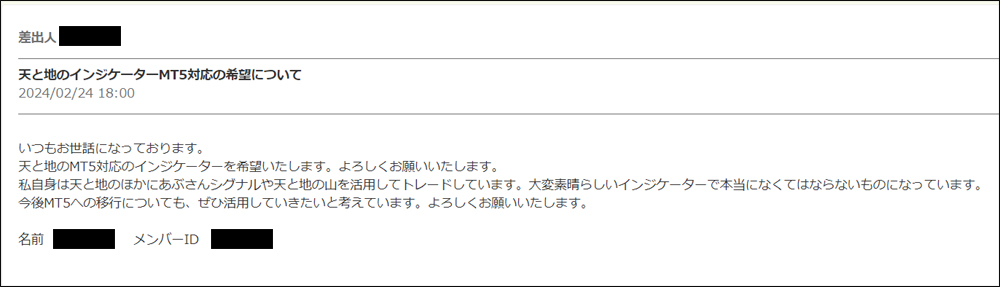
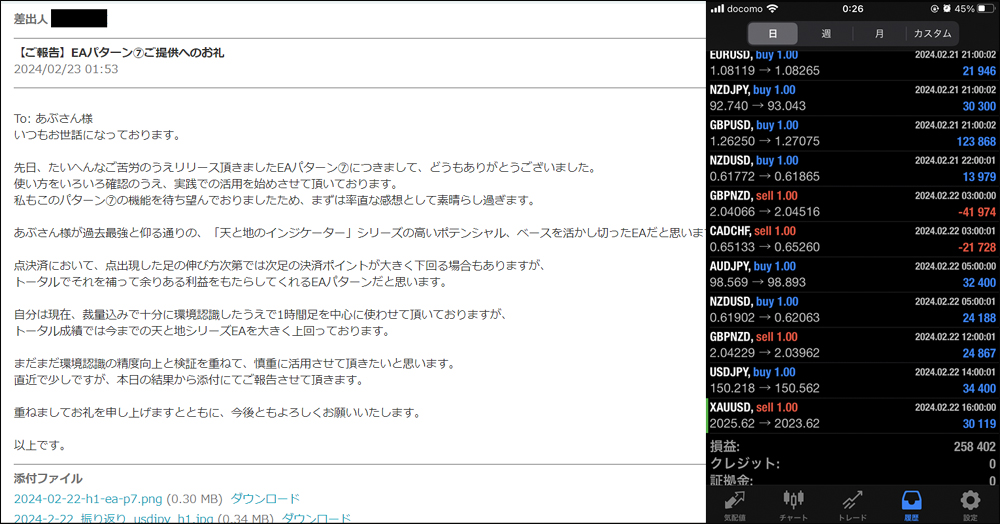
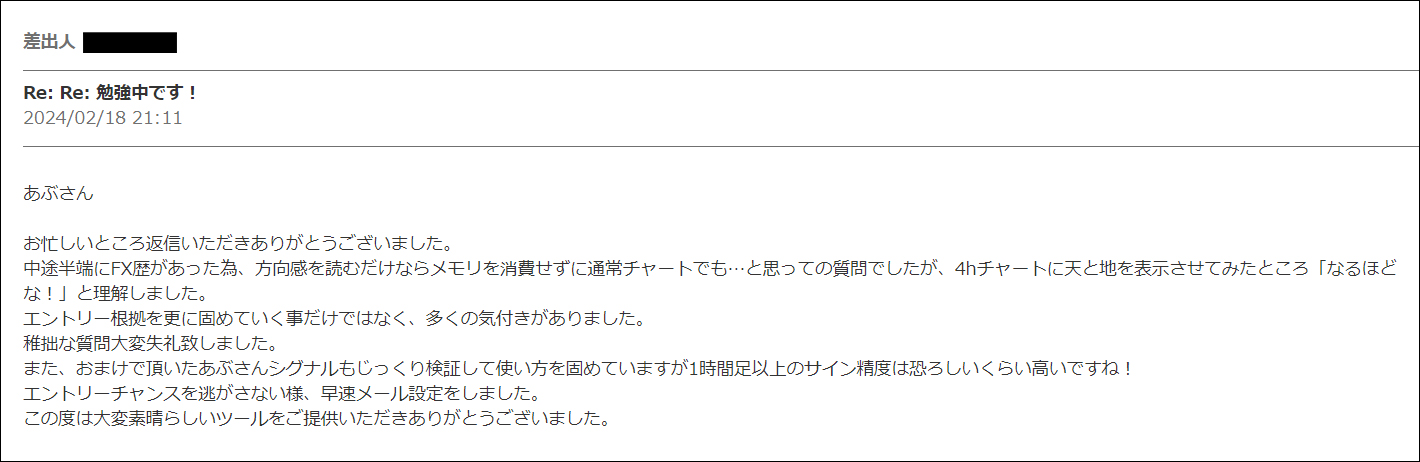






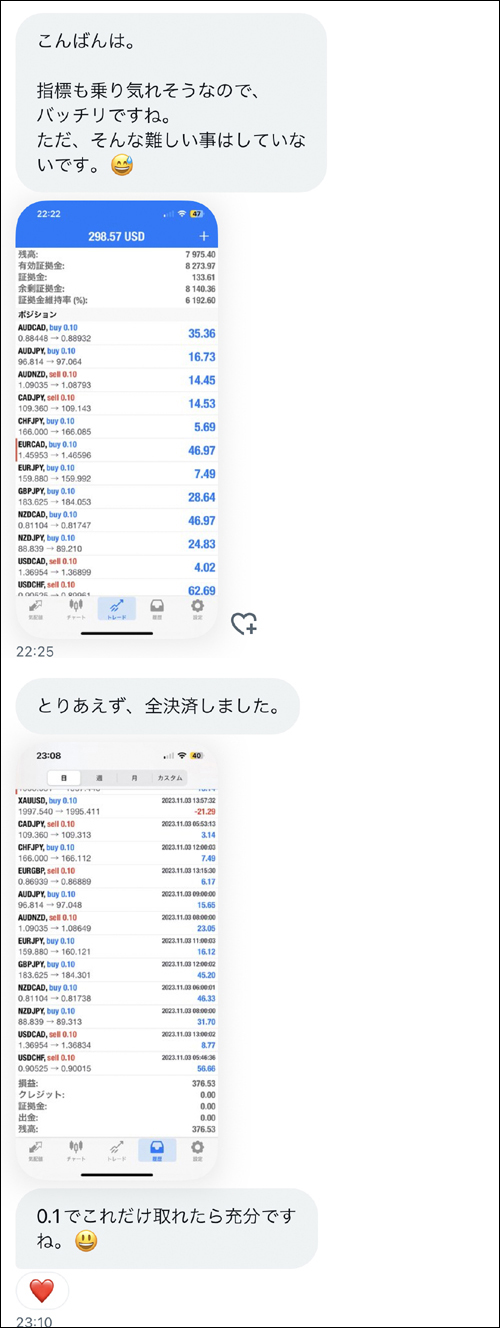
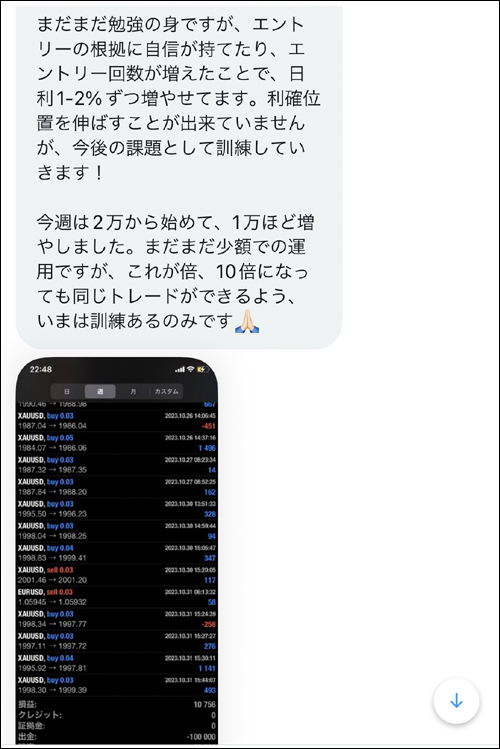
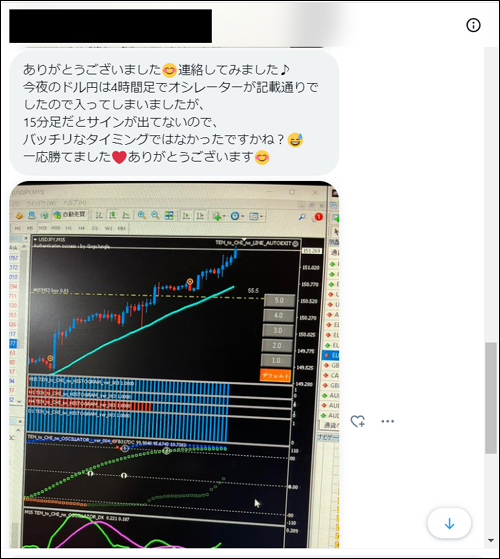
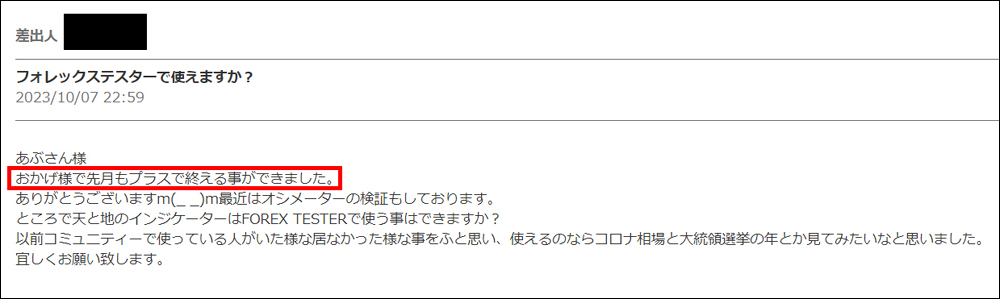
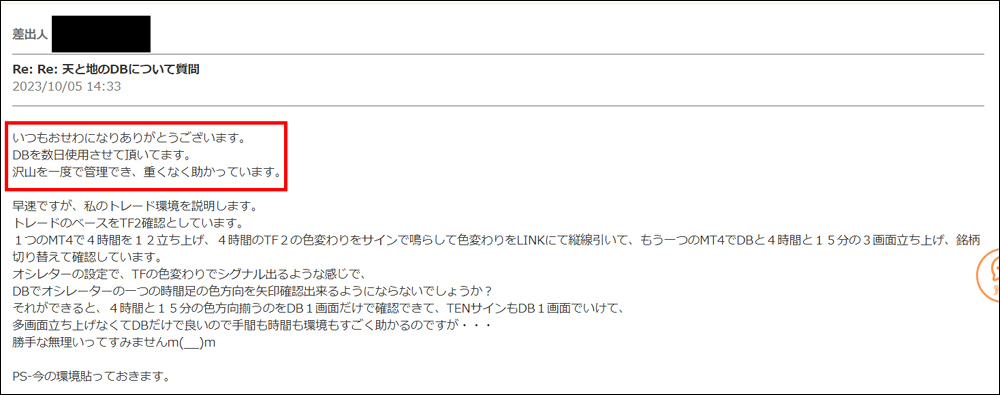
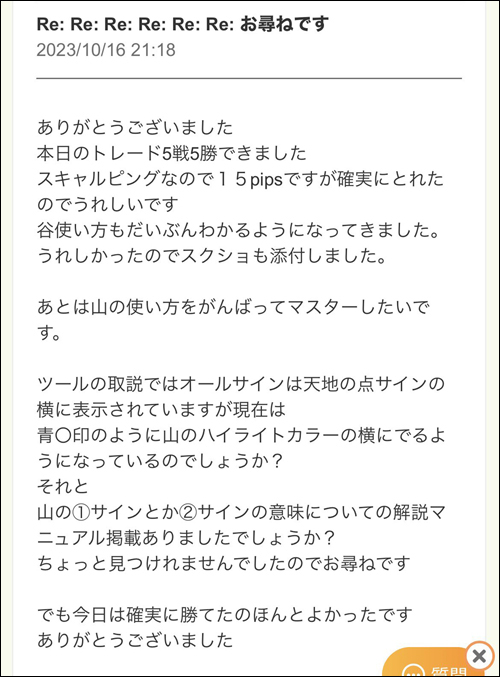
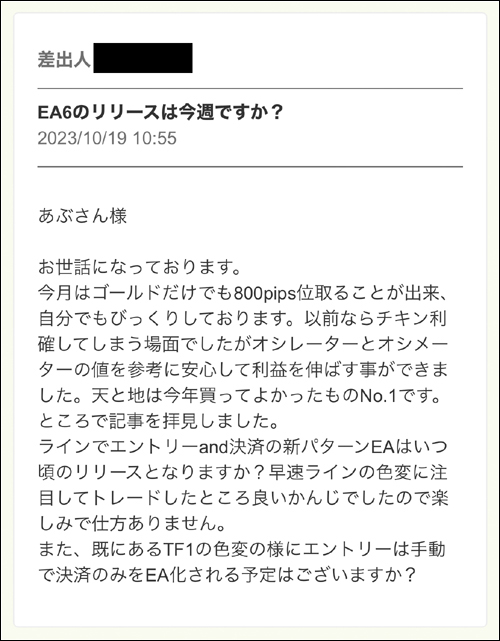
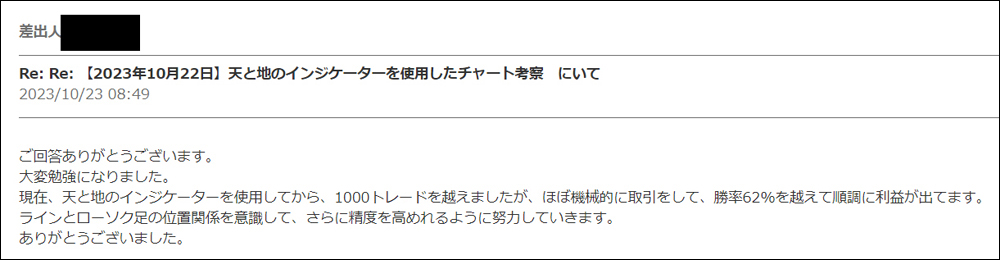

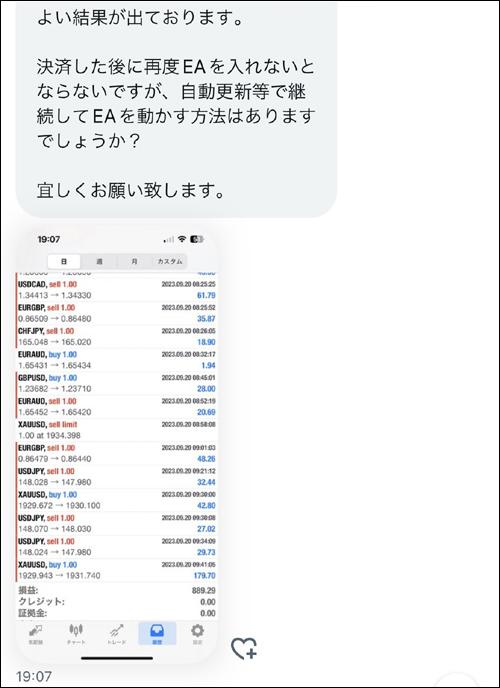
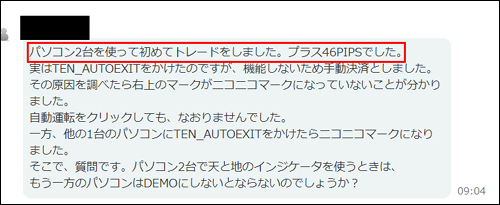
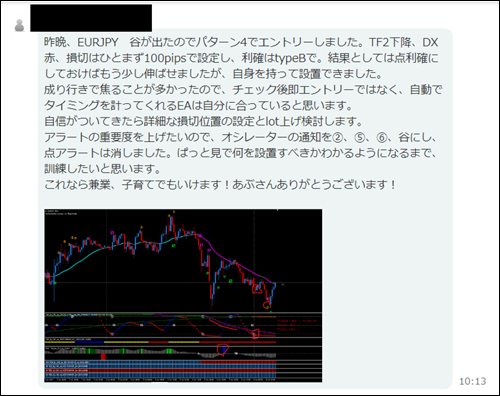
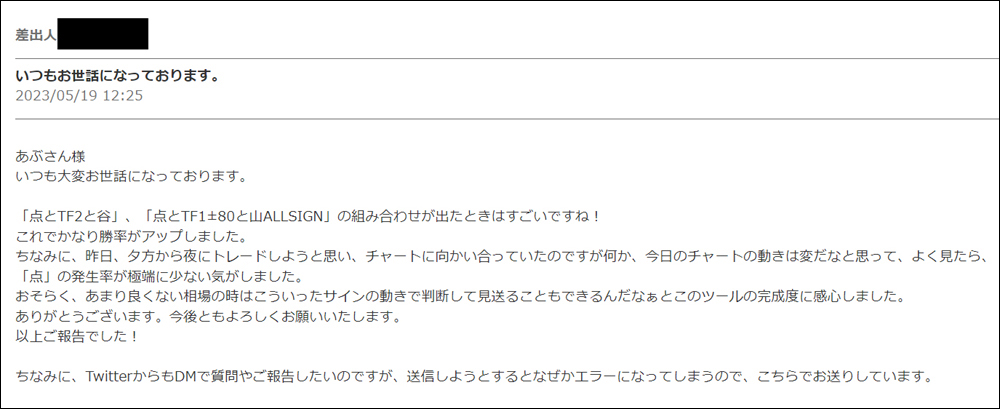
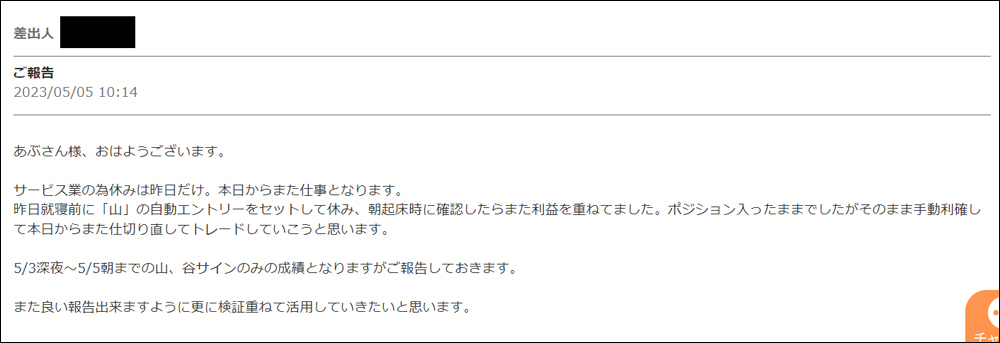
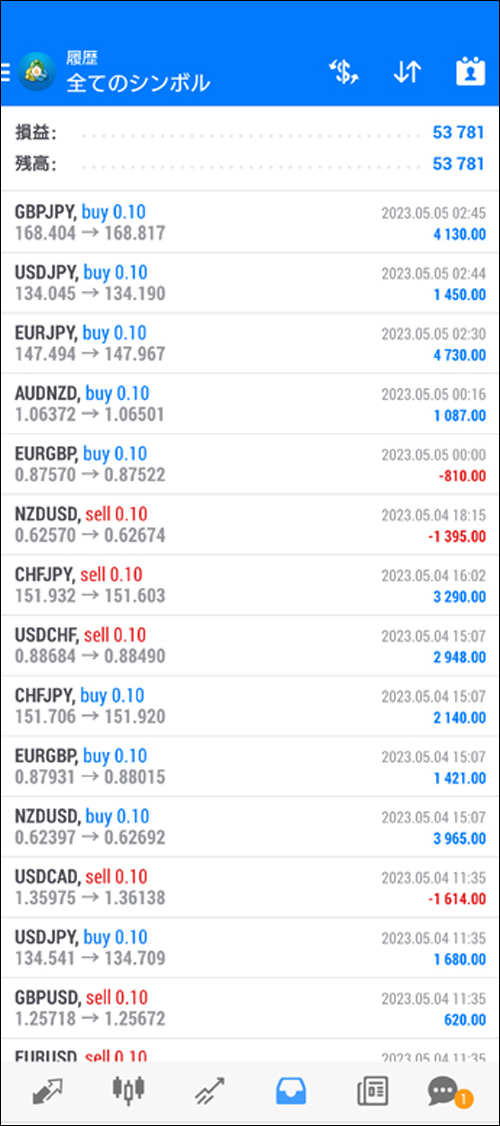


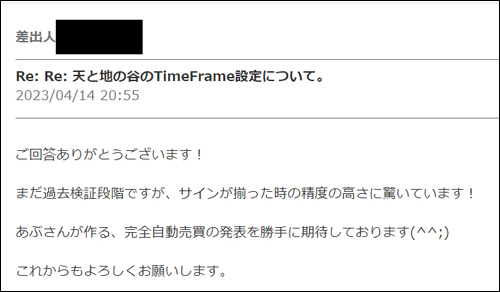
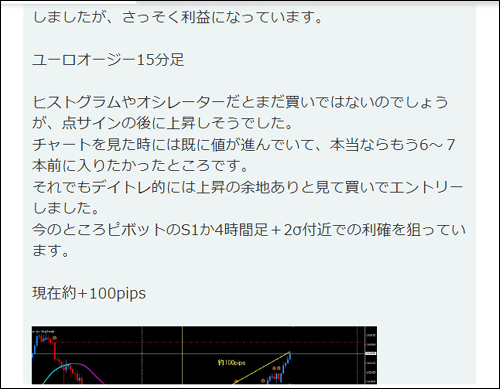
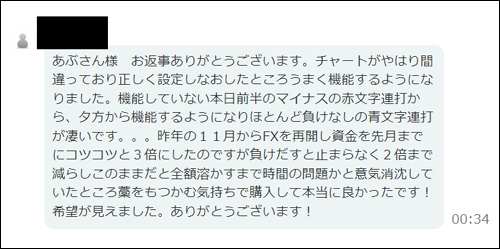
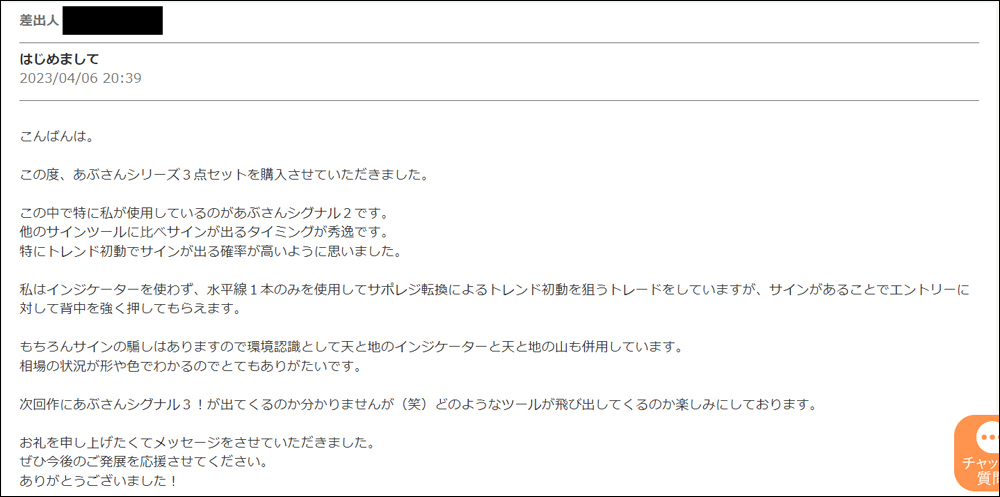














・Introducing posts from monitor users who actually used Heaven and Earth Day Swing
・Feedback and impressions from users who actually used Heaven and Earth Day Swing
・I searched for “#Heaven and Earth Day Swing”
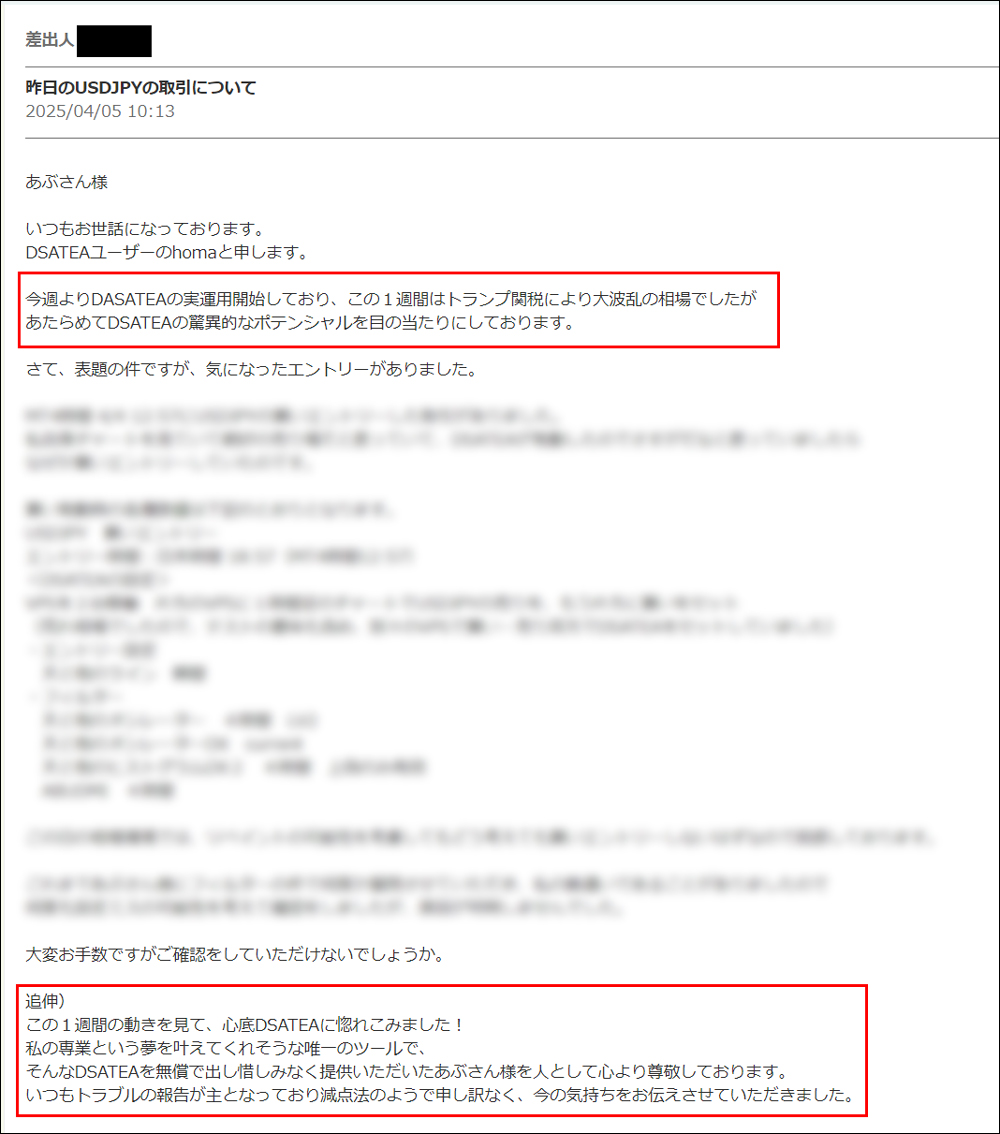
・Feedback from users who tried DSATEA

・Heaven and Earth indicators are an original indicator I developed, used in a trading method released in February 2022 by me, Abusan. Thanks to everyone's support「GogoJungle Award 2022, 2023, 2024, 2025」, I have won four years in a row.
・In this article「Heaven and Earth Indicator」 is used to validate and discuss the method of 「Heaven and Earth Day Swing」. Furthermore, the application method of “Prime Combo Signal” is also explained.
For basic trading methods of Heaven and Earth Indicator, please refer to articles published before August 2024.



This is the full set that includes the two systems I actually operate: “Heaven and Earth Day Swing” and “Prime Combo Signal.” It is a complete set with no compromise, not just a collection of separate indicators. It is a single, finished trading strategy. This is all there is to my trading.

【Abusan / Special Video Vol.1】 Users exceed 3,200 and counting! Are you still trading FX without Heaven and Earth? Why not relax while earning?

【Abusan / Special Video Vol.2】 Skill gap? No, equipment gap. Those who don’t use this will be vastly behind.


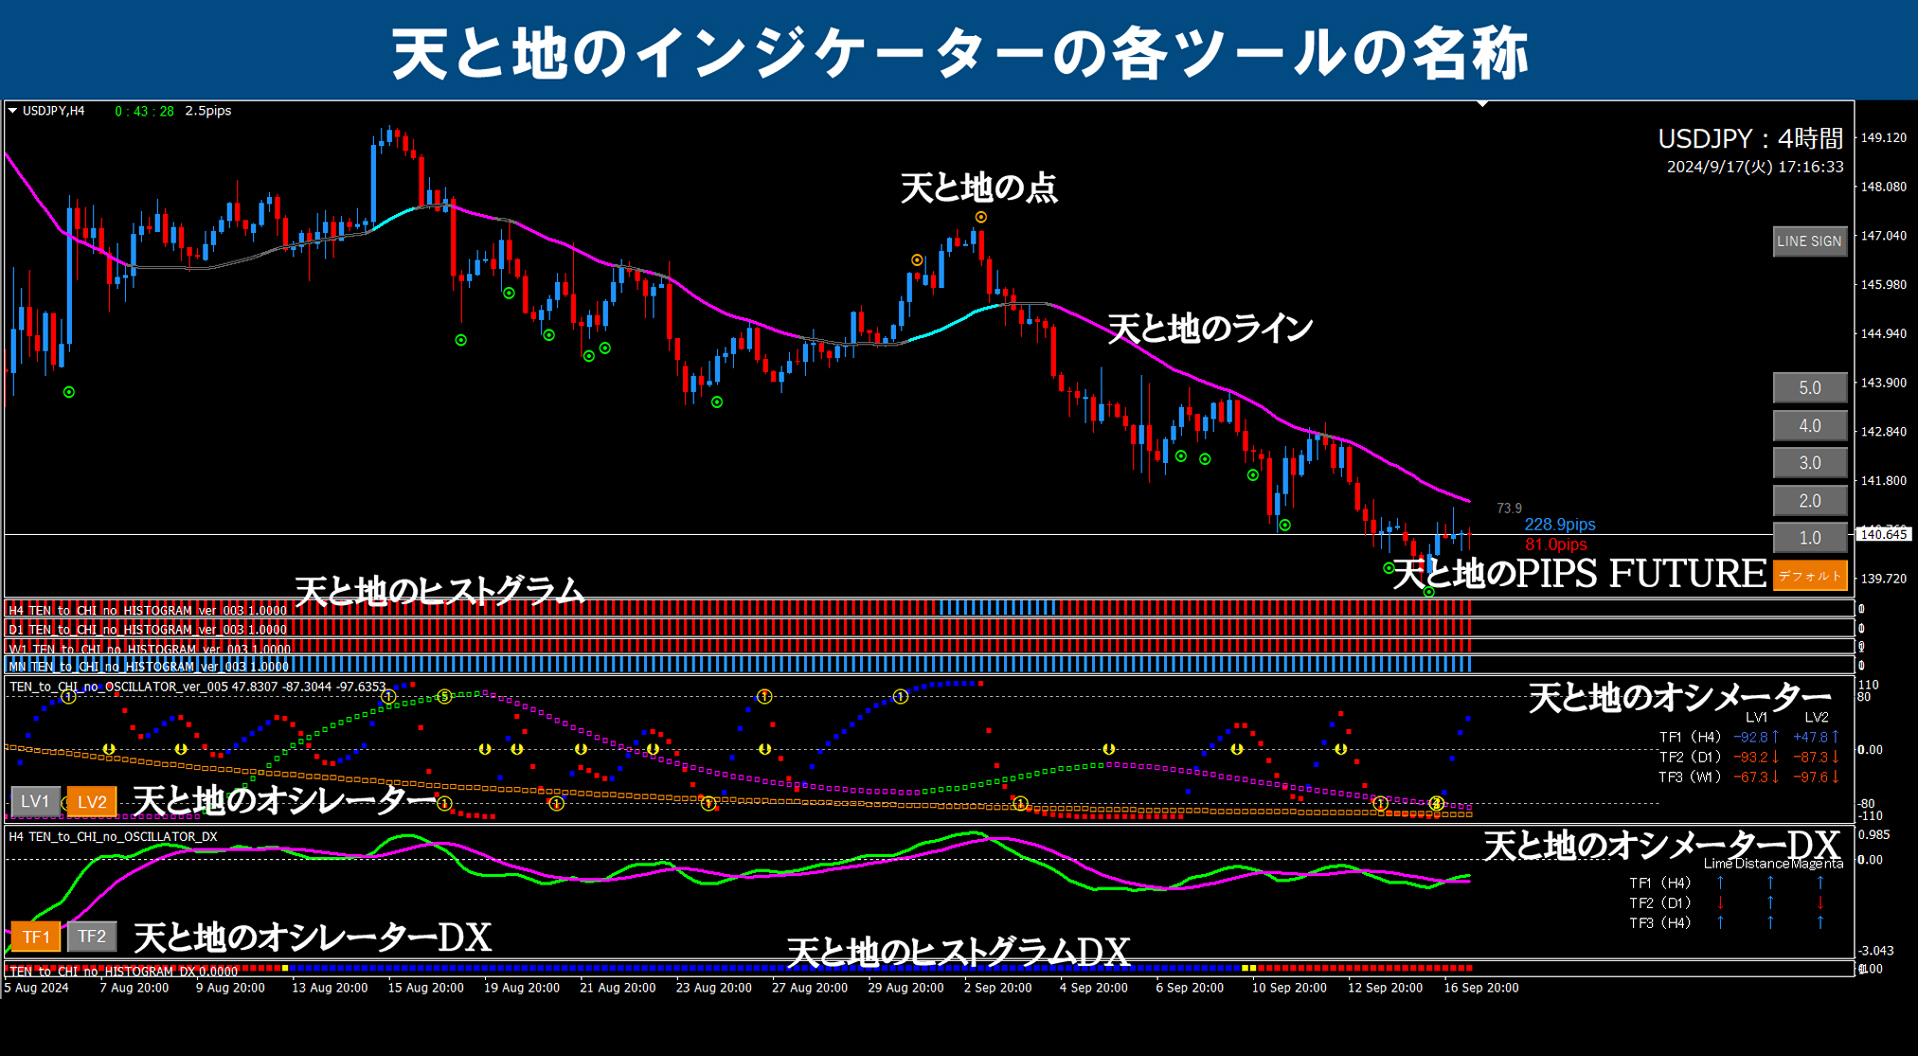
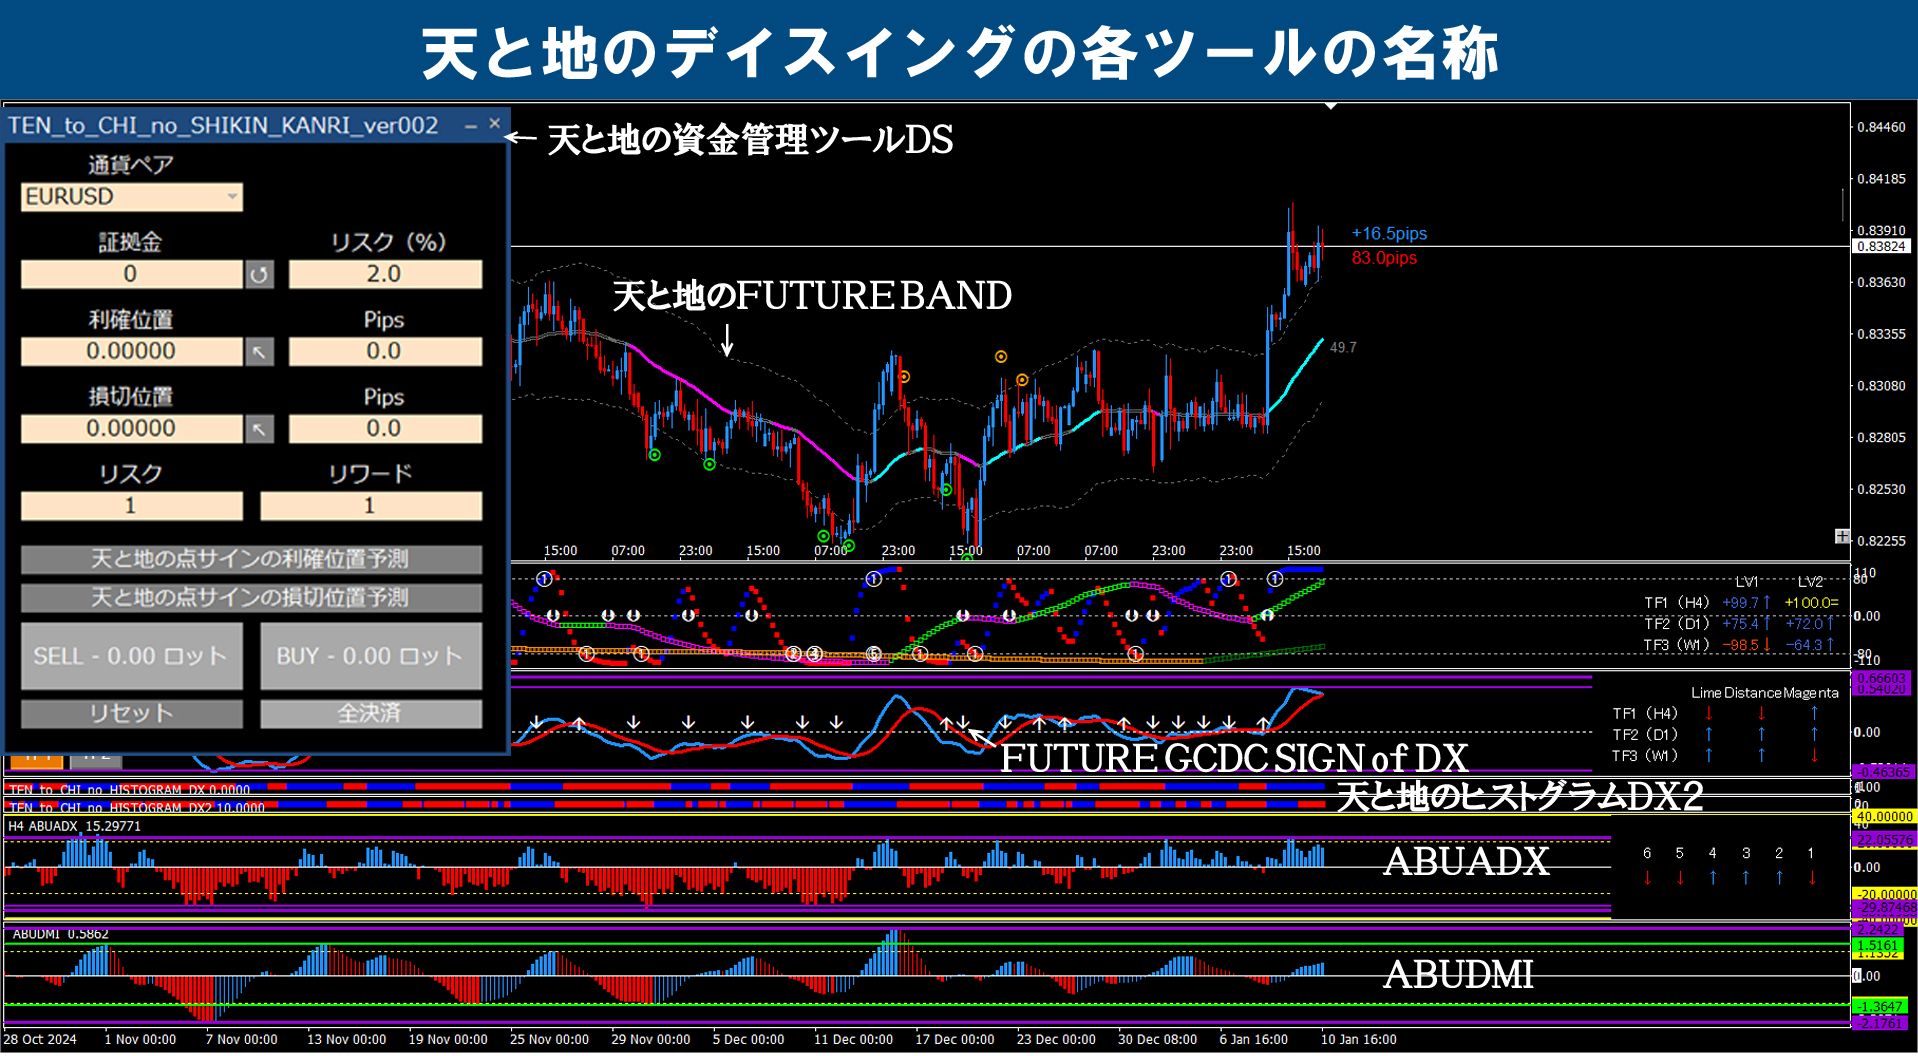
※ For the specialized terms used on this blog, please refer to the image below. (All images enlarge when clicked)





Gold (GOLD) / 15-minute chart + 4-hour chart + daily chart backtesting
※ The yellow dotted line is drawn across all timeframes at the same location.
※ The yellow circles mark important points.
※ Clicking the chart will enlarge it.
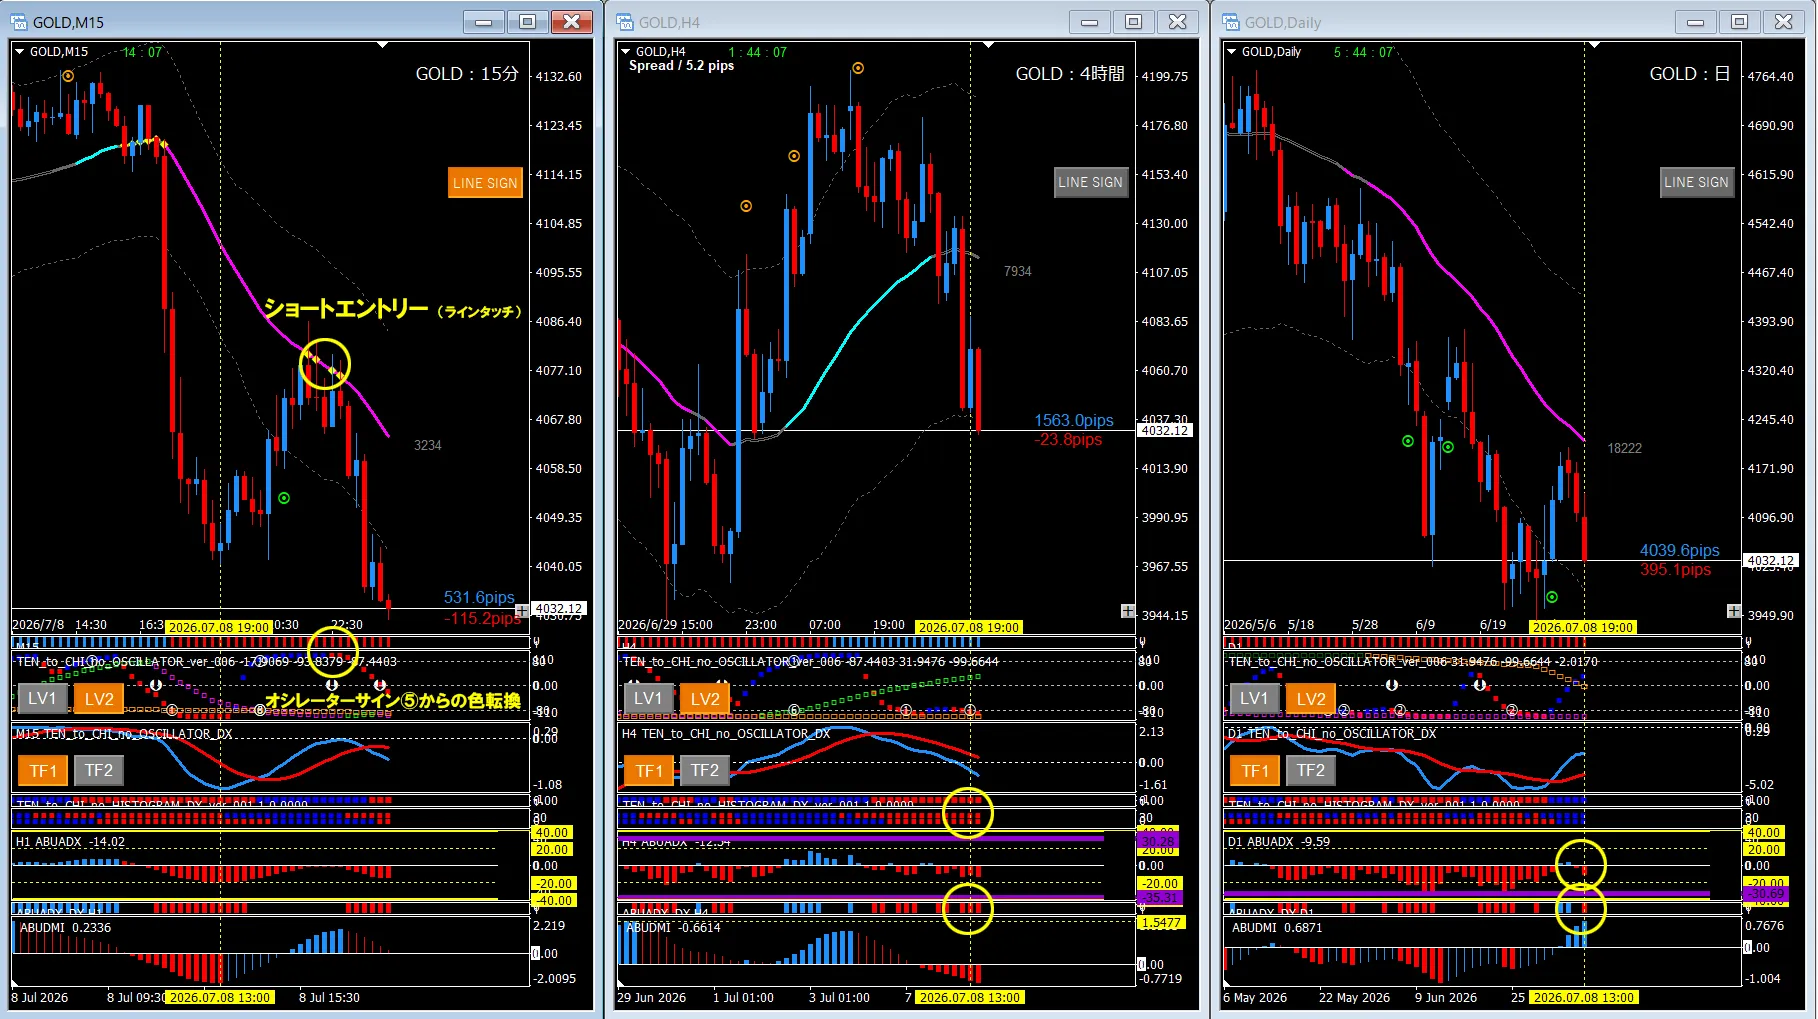
■ 15-minute chart (Left: Entry chart)
・ Line touch
■ 4-hour chart (Center: Market awareness chart)
・ Histogram DX, DX2 (all red)
・ ABUADX_DX (lit up)
■ Daily chart (Right: Market awareness chart)
・ ABUADX (zero line cross)
・ ABUADX_DX (before activation)
■ Summary
On the 4-hour chart, ADX_DX lights up and confirms, and on the daily chart ADX_DX is not yet confirmed, but the daily oscillator shows a good shape for a selling bias, so I will look for short entry points on the 15-minute chart.
■ If you use DSATEA
Since I determined a downward bias with the yellow dotted line, I will set DSATEA to short-only on the 15-minute chart at this point.
■ If you use Prime Combo Signal
For example, in a short-only setting, set the filter to the 4-hour ADX_DX, and entry to line touch, dot signal, oscillator, and ABUDMI. If you are using Pricon to solidify environmental recognition, you can still achieve results with this broad setup. Tighter, more refined settings will yield even better results.

We hope this is helpful for everyone, even a little.
If you could press the GOOD mark, it would be a boost for our future vigor. We appreciate your cooperation for further motivation.
