[Method Logic Details③] [Two EMA] Clear by looking at the chart! The colors indicate the trade points
[Method Logic Detail ③] [Two EMAs] Clear by looking at the chart! Trading points indicated by color
This article focuses on the logic of the [Two EMAs]. For other indicators, please see other articles
===== What kind of method? =====
■ 1-minute time-frame scalping trading method
Aim for +10 pips in one day
Enter at positions with high expectancy and high up (or down) probability, and take a few pips
Although it’s called scalping,
it follows the medium-term trend (direction of the higher timeframe) to add safety to trend-following
We combine multiple excellent logics that can stand alone for trading
↓↓↓ We will explain each in detail in separate articles
Articles [Method Logic Details I–V] [○○] indicates an indicator
【Method Logic Detail ①】 [Bollinger Bands]
【Method Logic Detail ②】 [MACD (short-term)]
【Method Logic Detail ③】 [Two EMAs]
【Method Logic Detail ④】 [MACD (mid-term)]
【Method Logic Detail ⑤】 How to take entry and exit points
【Method Logic Detail ⑥】 Presence or absence of volatility
Below, we will discuss the main topic of this article
=====【Method Logic Detail ③】 [Two EMAs] =====
The biggest point of this logic is the “width”
This [Two EMAs] is
【Method Logic Detail③】 [Two EMAs] in sync with
EMAs are visually read as the color “width”
A proper value is judged by the numbers of [MACD (short-term)]
Width of the EMA that aligns with the [MACD (short-term)] values
Simply by looking at it, the side with more “width” is more advantageous, very simple
At this point, it’s already spoilers
Where the [MACD (short-term)] meets the logic values,
the [Two EMAs] will have width
This is the idea
First, display the EMA bands on the indicator
Show them
Do not show them
Compare the charts
“In the first place, indicators aren’t needed. They just get in the way of trading.”
This is often said in FX trading.
There are various reasons, but they’re not the focus here, so omitted.
However, is that really true?
Please look at the following images
On the same chart, the indicator with the EMA bands
that is not displayed, and
that which is displayed
are shown in the images
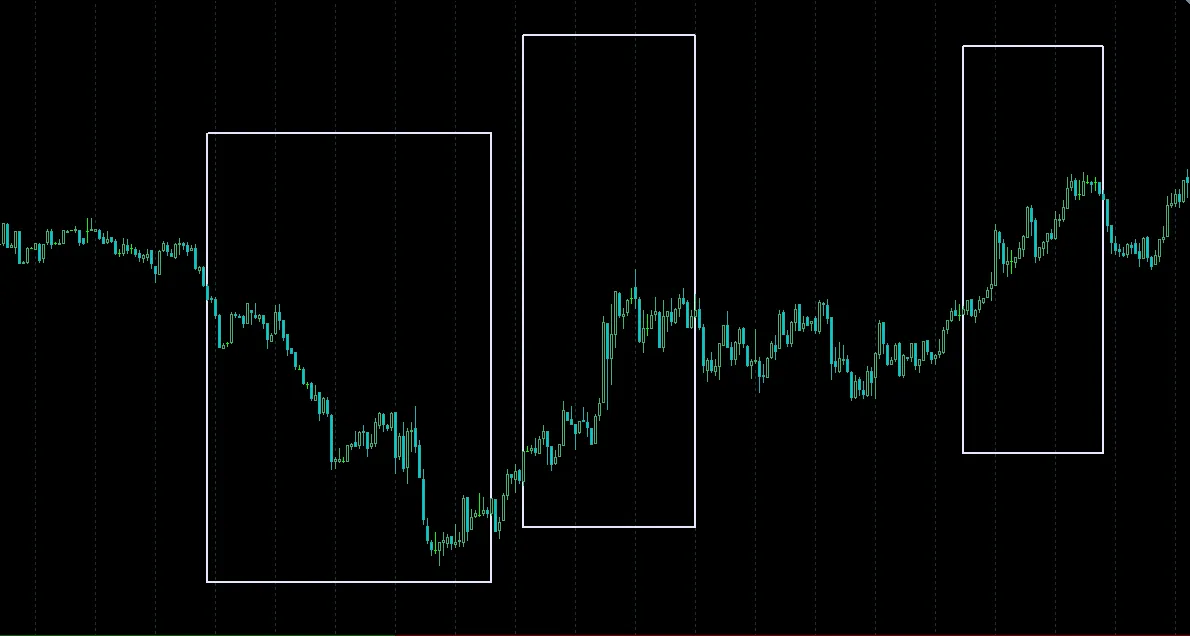
First, the chart where it is not displayed
I think you can see that the area not boxed is like a range
In the boxed area, from the start of the chart the angle of the chart begins to show
However, just looking at the chart, it’s hard to tell where the angle starts
It feels like you understand only after looking at the chart later
Where does the trade start?
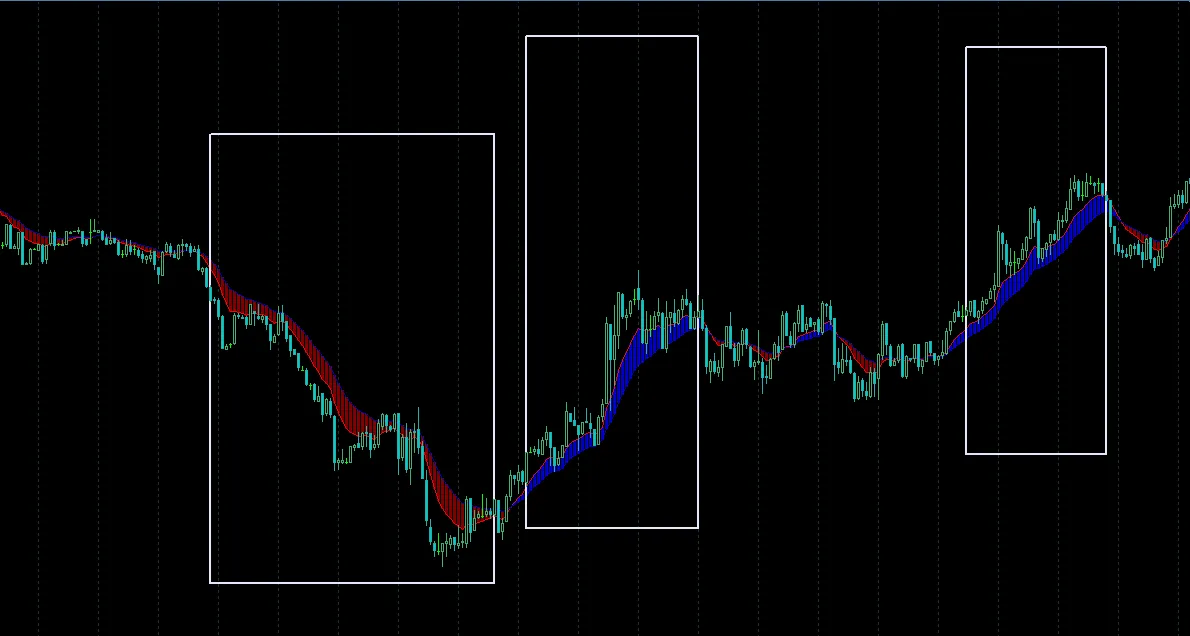
Now the chart where it is displayed
In the boxed area, the EMA width is clearly wider, which you can see at a glance
It might be easier to see the status of the EMA band in the unboxed area
In real-time, by looking at the indicator status, you can visually distinguish trends and ranges
Having the indicator helps determine when to start trading
On the smartphone MT4, the bands cannot be displayed, so please look at whether the EMA2 width is present or not
an indicator effective for knowing the position of the value at that moment
By looking at the slope, you determine the momentum in that direction
In scalping, the most important, about the short-term trend
In other words, the “momentum”
Will the momentum continue? Has the momentum not faded?
Is this direction good or bad?
To see the big picture, you must filter with another logic, but
In actual trading, what you finally look at is
The EMA and the candlesticks
It’s not an overstatement to say
Like in soccer, the feet at the moment of shooting
The foot you kick with when aiming to shoot, that foot
The foot you use to pass in the direction you want to go
The foot that traps the ball when the pass comes
If that “foot” isn’t proper,
no matter how much you want to pass there or shoot there
that wish will not come true
However, with just one EMA,
for example, something like being caught in a soccer “feint” can happen
Using two EMAs serves as a filter
helps prevent being feinted by two people
Used as a filtering role, with two
Even using these two EMAs alone can make trading more advantageous,
but by adding other equally advantageous logics,
you filter out situations where you go against the higher-timeframe trend and get faked out
and reduce losses, making the method viable
■ It is also used to determine entry points
In addition to the above logic, it is used to take entry points
That is,
【Method Logic Detail⑤】 How to take entry points and exit points
is described
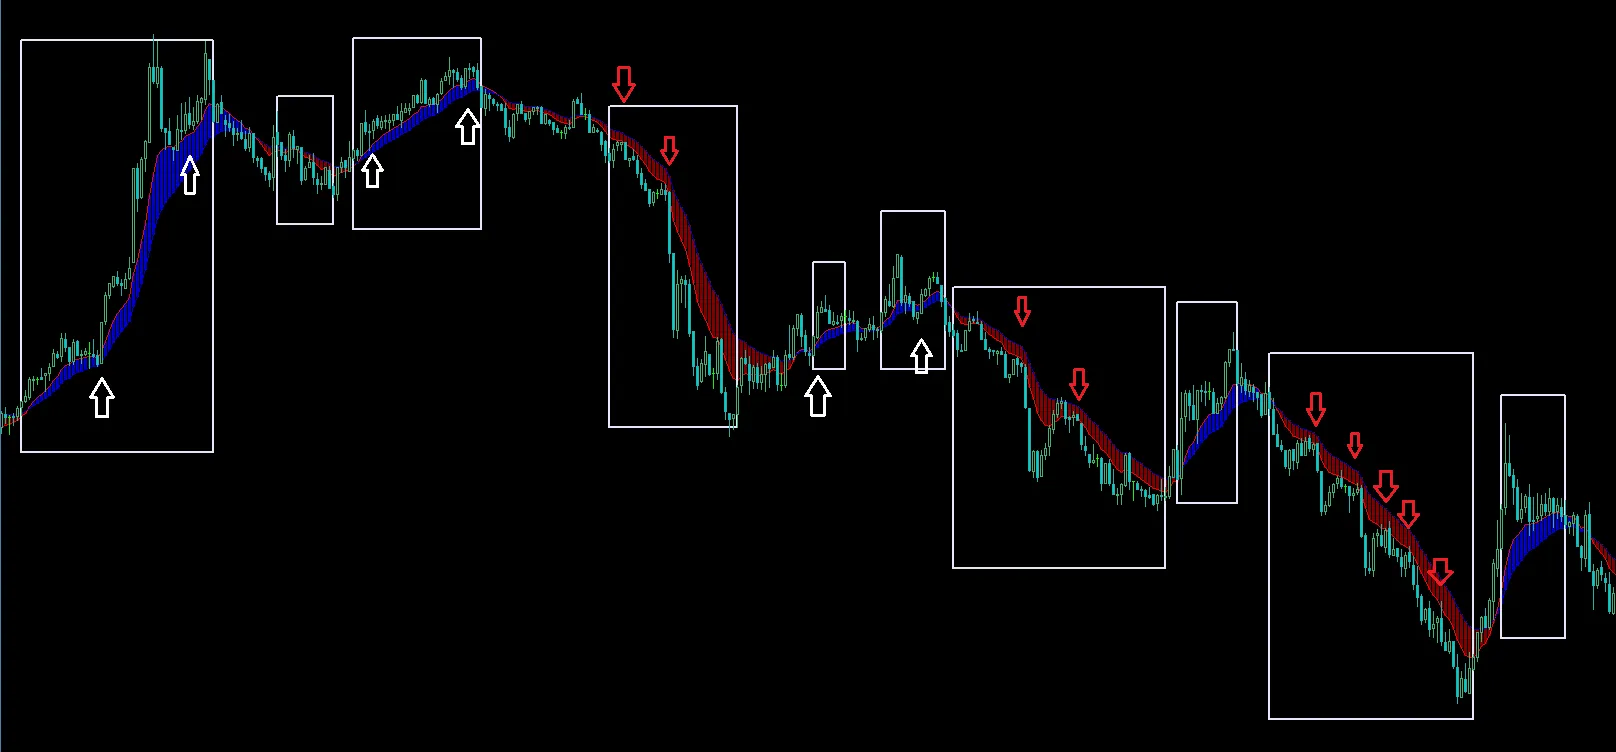
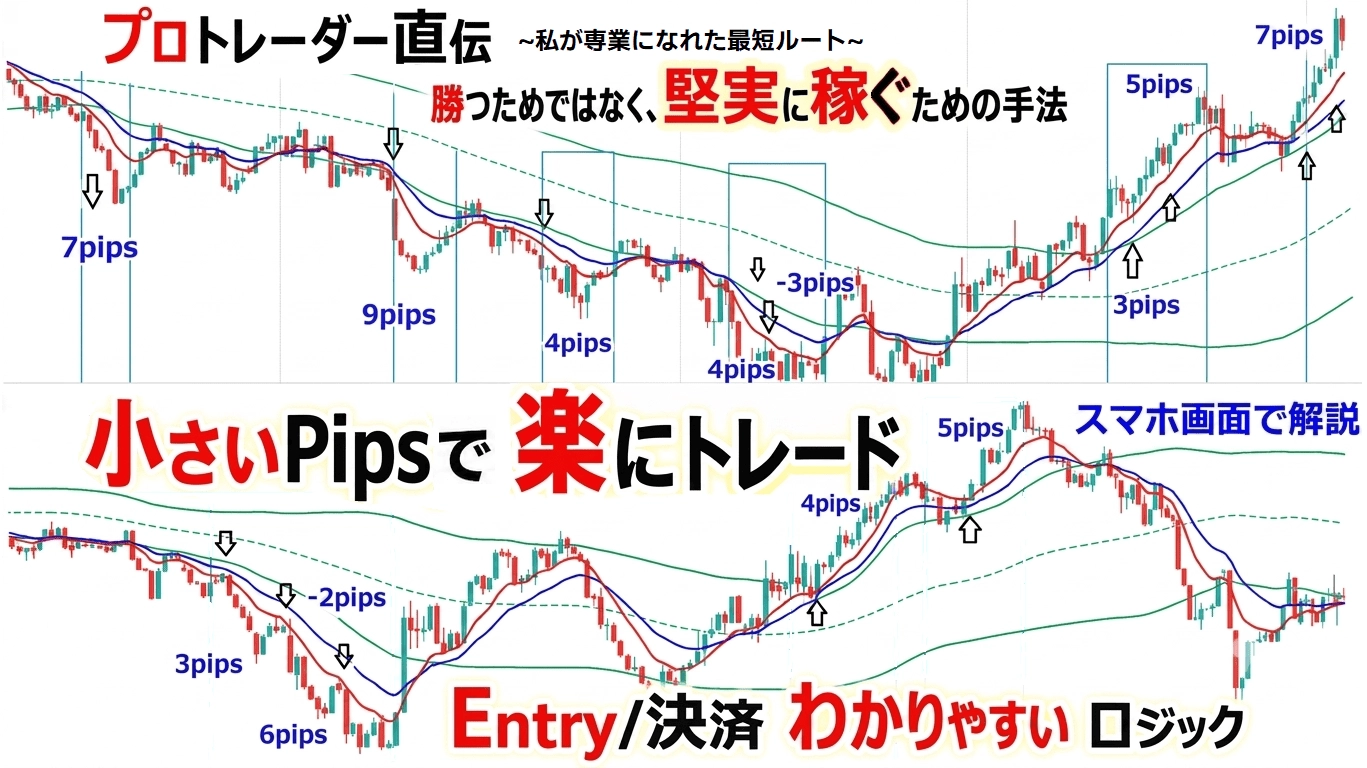
Also, this box indicates where this logic is satisfied; these arrows are the entry points determined by the logic
The method I am currently practicing is here
【Steadily +10 pips per day】
A 1-minute FX method I learned from a professional trader that helped me escape the losing group (about 2–5 hours a day)
Explained with smartphone chart images
【Entry Point】【Exit Point】 being easy to understand with this logic
■ Thinking of overseas pro traders (legendary investors Buffett and Soros)
A trading method not to win, but to earn
Trade with expectancy only by “going long at high probability of going up” rather than focusing on win rate
↓
https://www.gogojungle.co.jp/tools/ebooks/76385
#USDJPY #EURUSD #FXMethod #FXBeginner #FXHolyGrail #FXWinning #RealTrade #Scalping #Indicator #ProTrader #FXTrade #DayTrade #DayTrader #DayTrade #TraderWantToBe
#Investment #SelfInvestment #InvestmentLife #WantToBeInvestor #Freelance #WantToBeFreelancer #FreeWork #WantFreedom #SecondCareer #StockActivity #JobHunting #RemoteWork
#AssetFormation #FundRaising #AssetManagement #IndependenceStart #SoleProprietor #WantToBeSoleOwner #Entrepreneur #EarnMoney #WaysToEarn #WantToStartABusiness #LeaveOfficeJob #SideBusiness #WantSideBusiness #HousewifeSideBusiness #EntrepreneurWoman #MomEntrepreneur