

Make objective the “buying moments” in stock investment with KENVO Stage Analysis Pro [for stocks]: the concept of trend-following investment
Many people in stock investing worry about the question,
「Which stock to buy」
is the issue.
Of course, stock selection is important.
However, the actual investment performance is not determined solely by the stock itself.
Rather,
when to buy that stock in which phase is extremely important.
It matters a lot.
Even a superb company can incur unrealized losses if bought during a downtrend.
On the other hand, if you can ride a stock that market players are already starting to value and that is forming an uptrend, you may be able to aim for a large price swing with relatively lower risk.
So, what becomes important is,
objectively judging the market phase
.
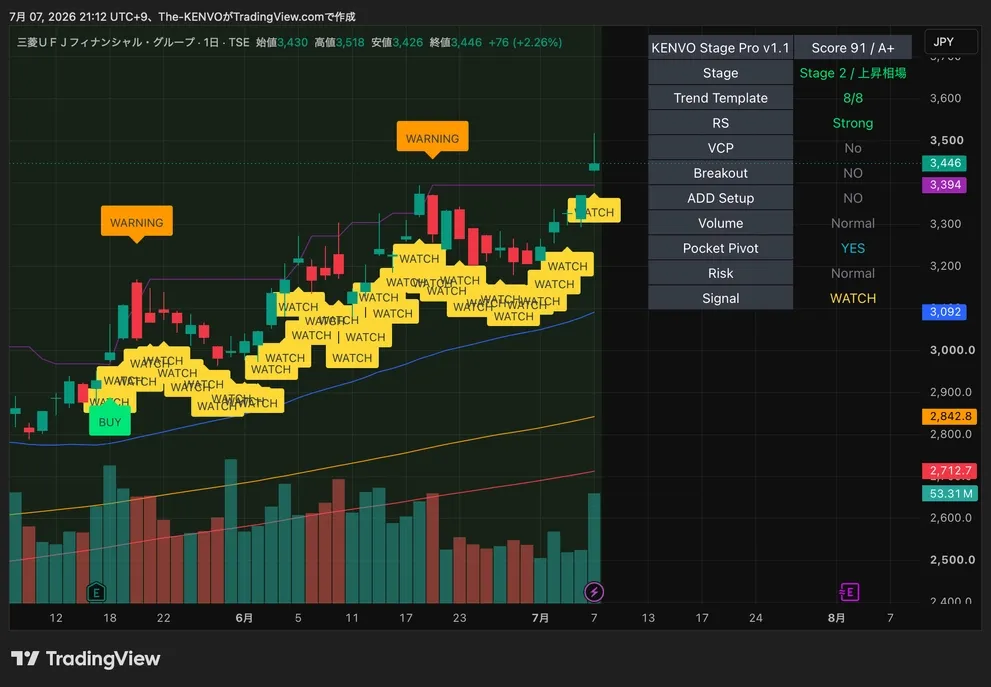
Why simply “buying cheap” doesn’t work
In stock investing, we tend to focus on stocks that have fallen in price.
“It has fallen this much, so it should rebound soon.”
“Because it’s a famous company, it will rebound someday.”
“Because the PER is low, it’s cheap.”
Many of us have bought with such thinking only to see further declines.
Of course, there are scenarios where value investing or mean-reversion works well.
However, in trend-following thinking, we don’t simply buy cheap stocks;
we aim for stocks that the market has already started to value, in the early to mid stages of an uptrend
.
In other words, what matters is not “Is it cheap?” but
whether it is entering a stage where it is likely to rise
.
What is Stage Analysis
The central idea of KENVO Stage Analysis Pro [for stocks] is Stan Weinstein’s Stage Analysis.
Stage Analysis divides the big price movements into four stages.
Stage1: Bottom formation
After a long decline, the price begins to move sideways in this phase.
Selling pressure is weakening, but there isn’t yet a clear uptrend.
If you buy too early at this stage, it may just end in a temporary sideways move and then drop again.
Stage1 is better viewed as a phase to
start monitoring
.
Stage2: Uptrend
The most crucial phase.
The 30-week moving average turns up, and the price moves above it.
Buyers are predominant among market participants, and pullbacks tend to be bought as well.
In trend-following investing, the default target is Stage2.
In KENVO Stage Analysis Pro, buy signals such as BUY, ADD, and VCP BUY are generally displayed in Stage2.
This is because
the idea is not to fight the trend
.
Stage3: Top formation
The uptrend nears its end and momentum slows.
Prices stay high, but making new highs becomes difficult, and volume-driven declines or long upper wicks may increase.
In this phase, rather than buying anew,
protecting profits
becomes more important.
Stage4: Downtrend
The 30-week moving average turns down, and prices move below it.
In this phase, buying with the expectation of a rebound may lead to further declines.
KENVO Stage Analysis Pro treats Stage4 as a phase where new buying should be approached with caution.
Seeing “quality uptrends” with the Trend Template
Not all rising prices indicate a good trend.
Some stocks surge briefly, while others show long-term moving averages aligned and steady upward movement.
To verify this difference, we use Mark Minervini’s Trend Template concept.
KENVO Stage Analysis Pro evaluates mainly the following elements collectively.
50-day, 150-day, 200-day moving averages, the direction of the 200-day moving average, the position of price relative to long-term moving averages, distance to 52-week highs and lows, the direction of Relative Strength, etc.
Checking each of these manually takes a lot of time.
Especially when watching many Japanese and U.S. stocks, checking all stocks every time isn’t realistic.
KENVO Stage Analysis Pro enables these conditions to be checked on a dashboard, so
you can grasp the completeness of long-term trends at a glance.
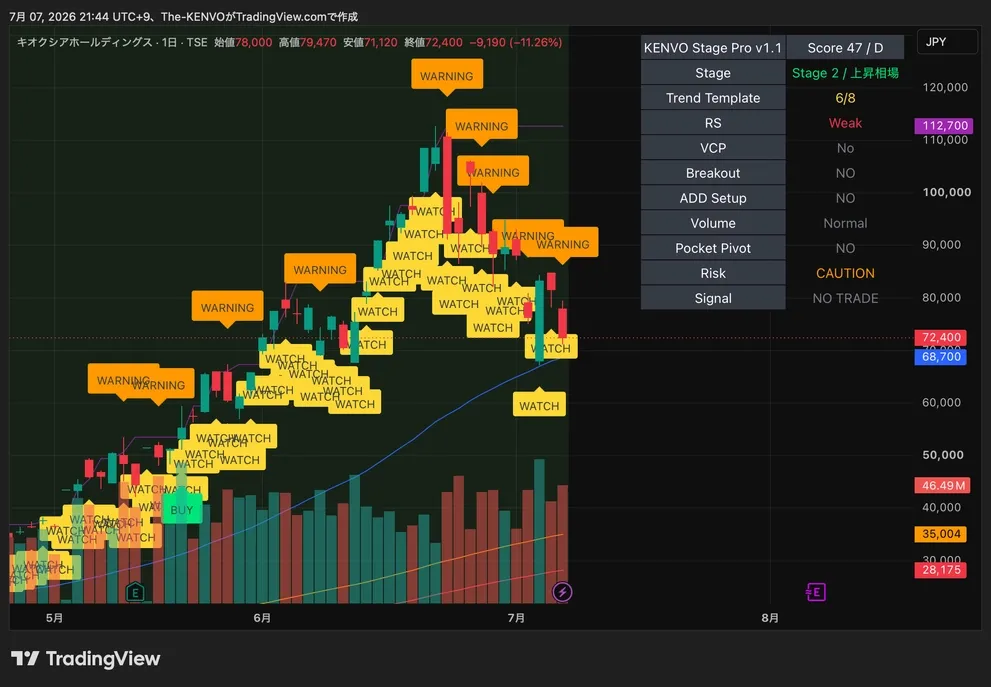
Choosing stocks stronger than the market with Relative Strength
In trend-following investing, it’s not enough to pick stocks simply because they are rising;
select stocks stronger than the overall market
.
For example, if a stock rises by 20% but the overall market rises by 30% in the same period, that stock is relatively weak.
Conversely, if the market rises only 5% while a stock rises 20%, that stock is stronger than the market average.
KENVO Stage Analysis Pro displays such market comparisons as Relative Strength, or RS.
If you set benchmarks like SPY or QQQ for U.S. stocks, or TOPIX-linked ETFs and Nikkei indices for Japan, you can verify whether the target stock is stronger or weaker than the market.
This is very important.
Because many stocks that rise substantially show strength above the market from early in their rise.
What is VCP?
Another key element of KENVO Stage Analysis Pro is VCP.
VCP stands for Volatility Contraction Pattern, a pattern where price moves and volume progressively contract.
In simple terms,
a calm before a big rise
.
Before a large price surge, selling pressure tends to shrink, price swings reduce, and volume settles down.
This is a state where the price stores energy.
Like compressing a spring, price activity narrows, selling pressure decreases, and it breaks out with volume.
If you can capture this phase, it becomes a very attractive entry in trend-following investing.
KENVO Stage Analysis Pro combines ATR, Bollinger Band width, and volume contraction to assess VCP formation potential.
And when a breakout occurs with volume after VCP formation, it displays a VCP BUY signal.
Of course, a VCP BUY does not guarantee an rise.
Nevertheless, as an entry candidate with multiple confluences, it is a scene worth paying attention to.
Main information you can check with KENVO Stage Analysis Pro
In KENVO Stage Analysis Pro [for stocks], you can review current stock conditions on charts and dashboards.
Key checks include: current market stage, long-term trend completion, Relative Strength, market average comparison, volume status, presence of VCP formation, breakout presence, pullback buying candidates, risk state, overall score, current signals, etc.
Crucially,
do not rely on a single signal; combine Score, Stage, Trend Template, RS, and Volume to judge
.
Even for the same BUY signal, the chart’s overall completeness differs between a score above 90 and scores in the 60s.
Additionally, simply BUY versus VCP BUY involve different conditions and confluences.
Instead of taking signals as trade orders,
use them as messages to interpret the market conditions
.
Signal concepts
KENVO Stage Analysis Pro mainly displays signals as below.
WATCH
Stage where you start preparing to buy.
It is entering Stage2, RS is improving, the trend is shaping, etc.—positive changes are beginning.
However, decisive breakout or volume increase may not yet be confirmed.
At this stage, it is suitable to add to a watch list and continue monitoring rather than buying immediately.
BUY
The classic breakout signal.
Displayed when multiple conditions align, such as Stage2, Trend Template, and breakout with volume.
A candidate for initial entry.
ADD
Signal to target the first pullback after breakout.
Even strong stocks may retrace after breakout.
This captures the moment where buying again on the pullback could continue the uptrend.
Useful for adding to an existing position or for those who missed the initial BUY to re-enter.
VCP BUY
A highly confluenced entry candidate within KENVO Stage Analysis Pro.
Displayed after VCP forms and price/volume contract, followed by a breakout with volume.
It does not guarantee ascent, but it is a signal with high attention in trend-following investing.
WARNING
A caution signal to protect profits.
It does not mean sell immediately.
Signals of momentum loss at highs, volume-driven declines, or fading trend indicate risk management actions may be needed.
If this signal appears, consider taking profits, revising stops, or adjusting position size.
EXIT
A strong caution signal indicating the possibility of a downtrend.
In trend-following investing, when to exit is as important as when to enter.
EXIT is treated as a scenario where risk control takes precedence over new buying.
The essence of this indicator is to teach the “waiting” rather than the “buying” moment
I believe a good indicator does not simply produce a lot of buy signals.
Rather, the important thing is to
teach you when not to buy
.
In investing, you do not always need to hold a position.
When conditions aren’t right, you wait.
Even strong stocks should be waited on before breakout.
In Stage2, if RS is weak, you wait.
If the Score is low, you wait.
If WARNING or EXIT appears, think about protecting profits.
Thus, making trading decisions based on fixed criteria rather than emotions is important for long-term investing.
KENVO Stage Analysis Pro [for stocks] is precisely a tool for that purpose.
Recommended for whom
KENVO Stage Analysis Pro [for stocks] suits the following people.
People who want to implement mid- to long-term trend-following in Japanese or U.S. stocks.
People who want to practice breakout investing systematically.
People who want to reduce chart analysis time.
People who want to objectify trading decisions as much as possible.
People who want to apply Stage Analysis, Trend Template, and VCP concepts to practical trading.
On the other hand, for ultra-short-term trading that lasts seconds to minutes, stocks with low volume, or illiquid markets, this indicator may not perform as well.
This indicator assumes stock market trend-following investing.
Recommended usage
In practice, use it in the following flow to understand easily.
First, check Stage.
If Stage2, focus on it as an uptrend candidate. If Stage4, judge new buying cautiously.
Next, check Score.
If 80 or higher, it is a watch candidate; if 90 or higher, it is a chart to actively watch.
Next, check Trend Template.
If PASS, there is a possibility the long-term trend conditions are in place.
Next, check RS.
Prioritize stocks stronger than the market average to improve trend-following accuracy.
Finally, check the Signal.
Whether it is WATCH, BUY, ADD, or VCP BUY.
Also verify no WARNING or EXIT appears.
Thus, it is important to confirm using multiple pieces of information rather than relying on a single signal.
Summary
In stock investing, determining the buying phase is as important as stock selection.
Rather than buying cheap-looking stocks, aim for ones that form an uptrend, are stronger than the market average, and break out with volume.
This is the fundamental idea of trend-following investing.
However, manually checking Stage Analysis, Trend Template, Relative Strength, VCP, volume, and breakouts for every stock is not easy.
KENVO Stage Analysis Pro [for stocks] integrates these pieces of information onto a single chart and lets you objectively understand the current state of the stock.
It is not a tool that automatically executes trades.
It does not guarantee profits.
Nevertheless, it is highly useful as an auxiliary tool to bring investment decisions closer to objective rules rather than being swayed by emotions.
If you want to practice trend-following investing more simply and more objectively, please take a look.
▼ Product page here
https://www.gogojungle.co.jp/tools/indicators/82186?src=pickup&via=users