
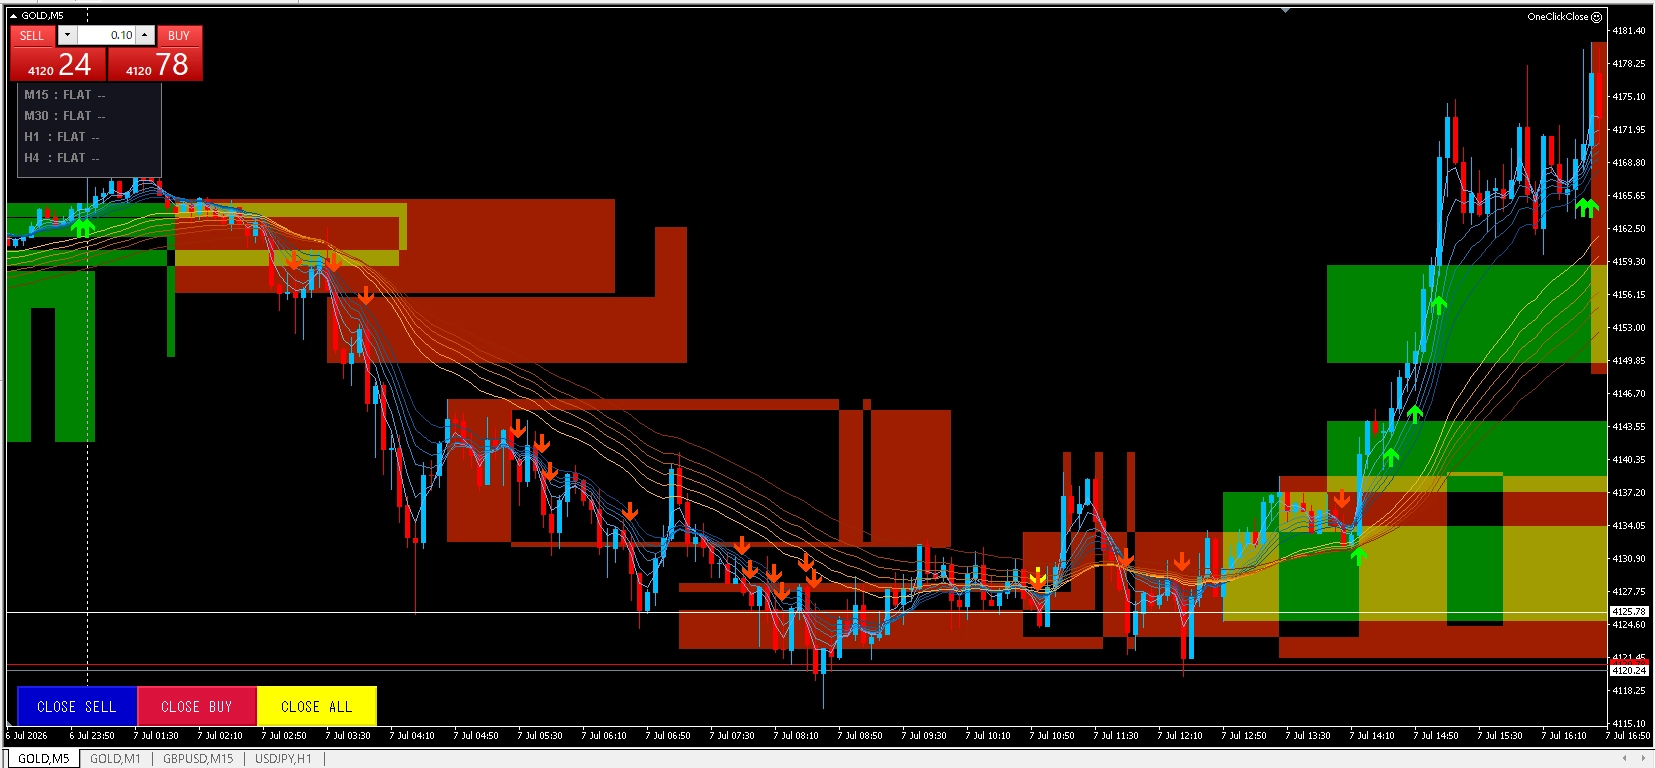
2026/07/07~08 Gold Demand & Supply
Status of Gold on 7/7
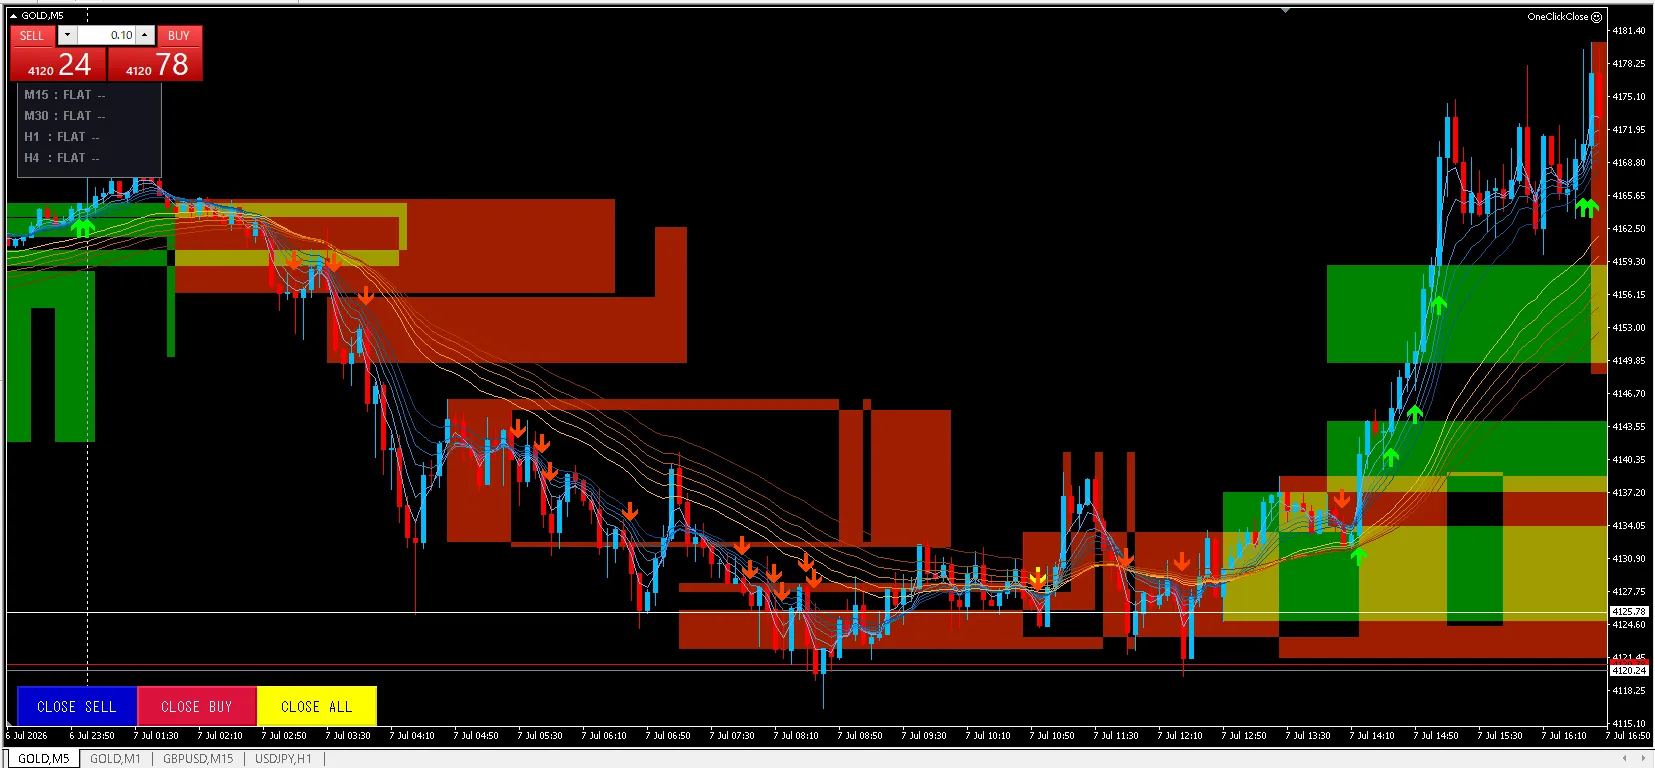
The chart displays a 5-minute candle with a Demand indicator and GMMA.
After a period of decline, around when it surged past the GMMA, the colors began to change.
From this area, it is a fever time for BUY.
If you wait for this moment and repeatedly trade, you can easily aim for huge profits. After the GMMA shift,
there have been no new lows, so it is possible to trade safely.
And the same situation happened again on 7/8.
While I was writing the article...
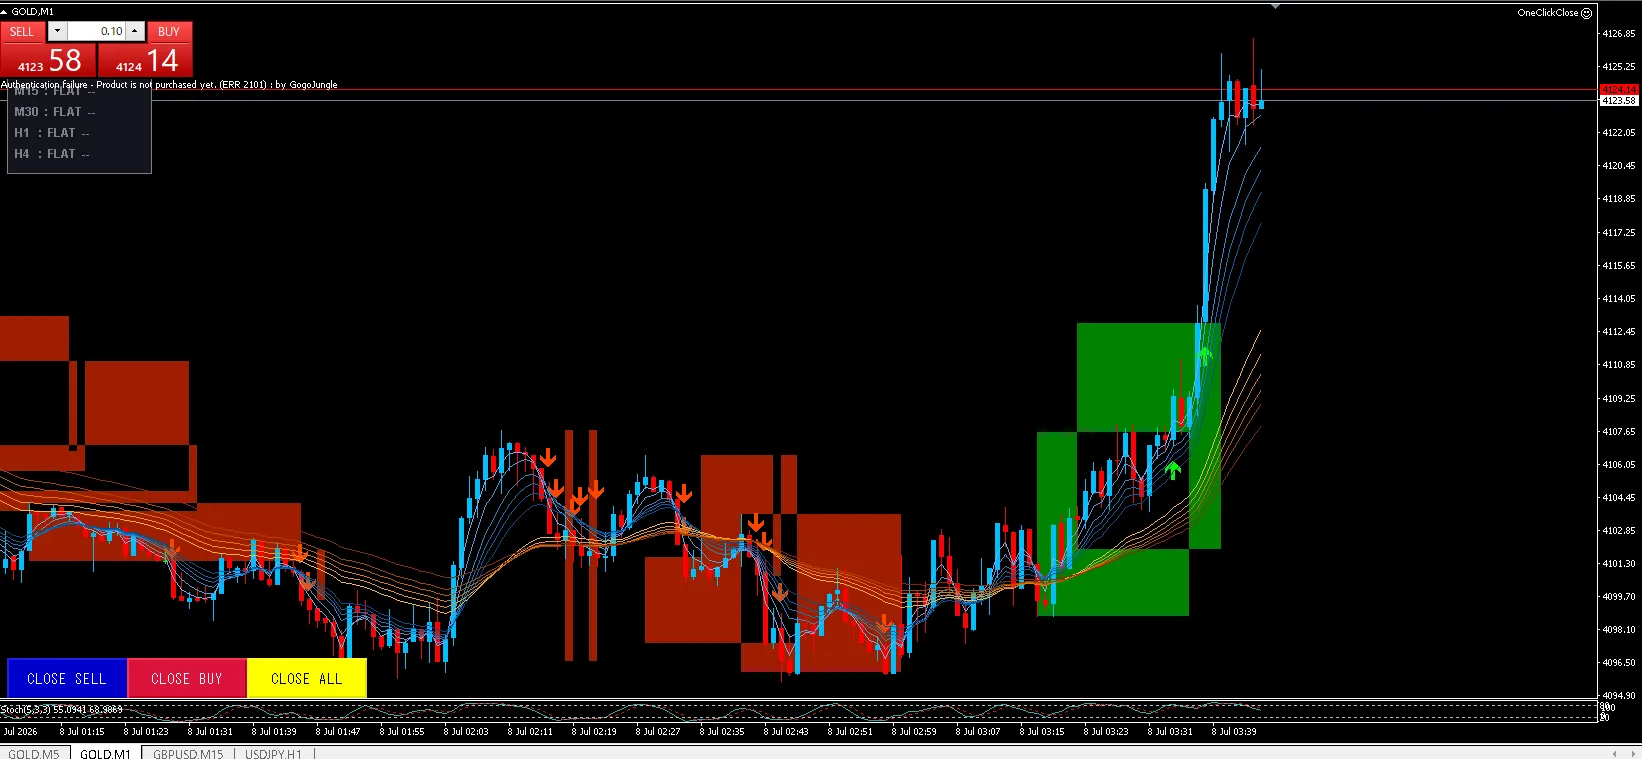
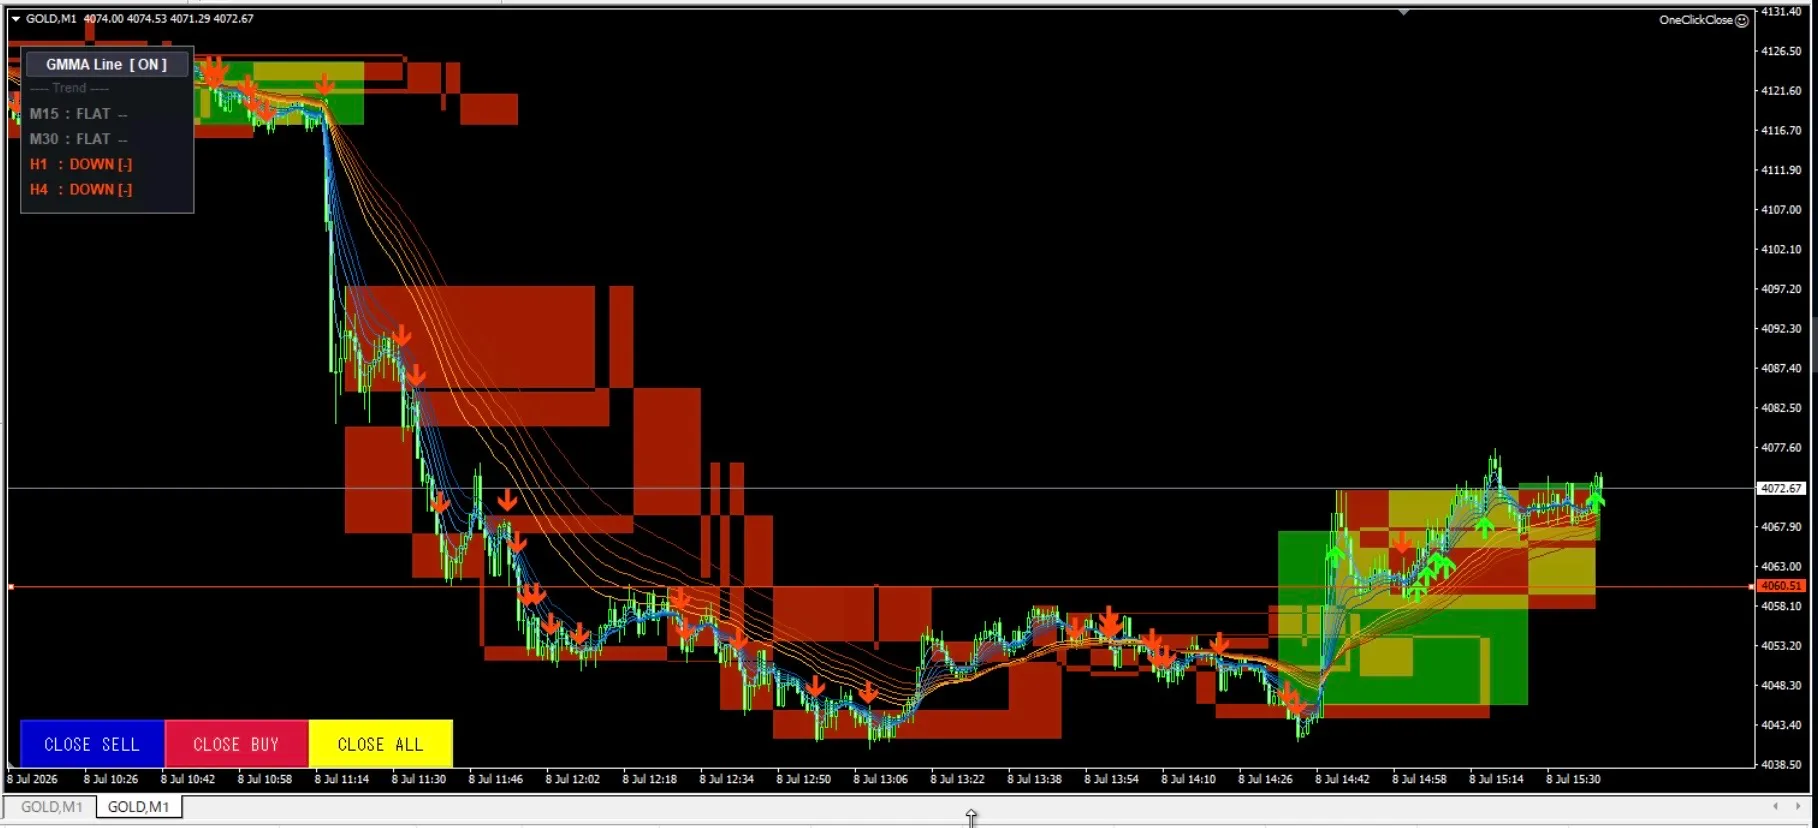
Yes. This is displayed on a 1-minute chart here.
After the shift, it rose sharply again.
Since there are no new lows, it is less likely to be a false breakout,
and it’s a safe entry point.
These kinds of situations occur frequently, so even trading once a day can
aim for profits of 200,000 to 1,000,000 yen.
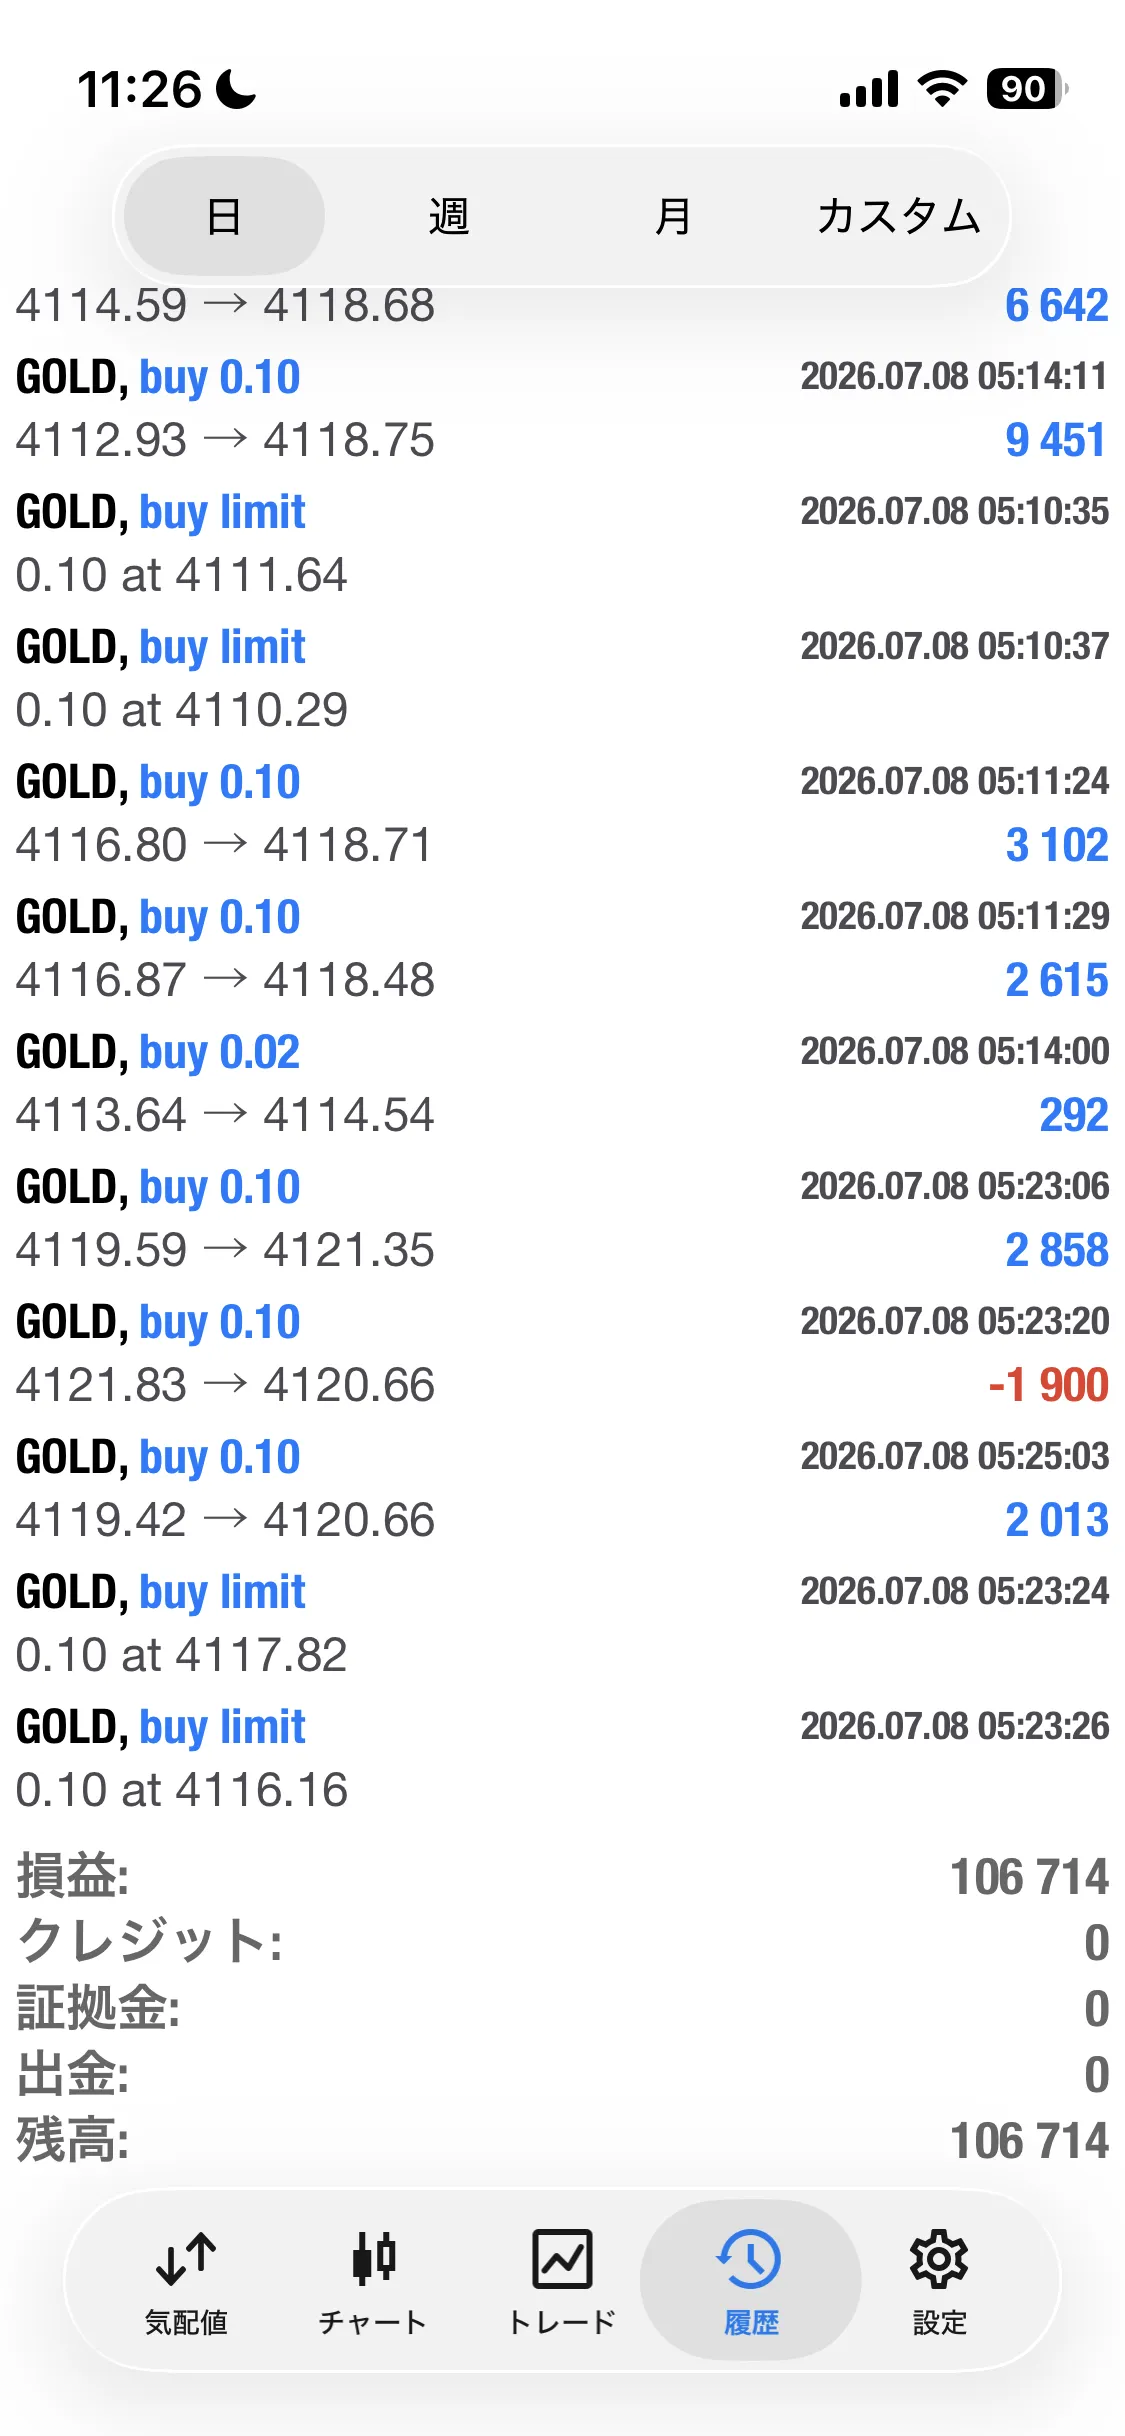
Why is it so easy only with the same patterns
↓
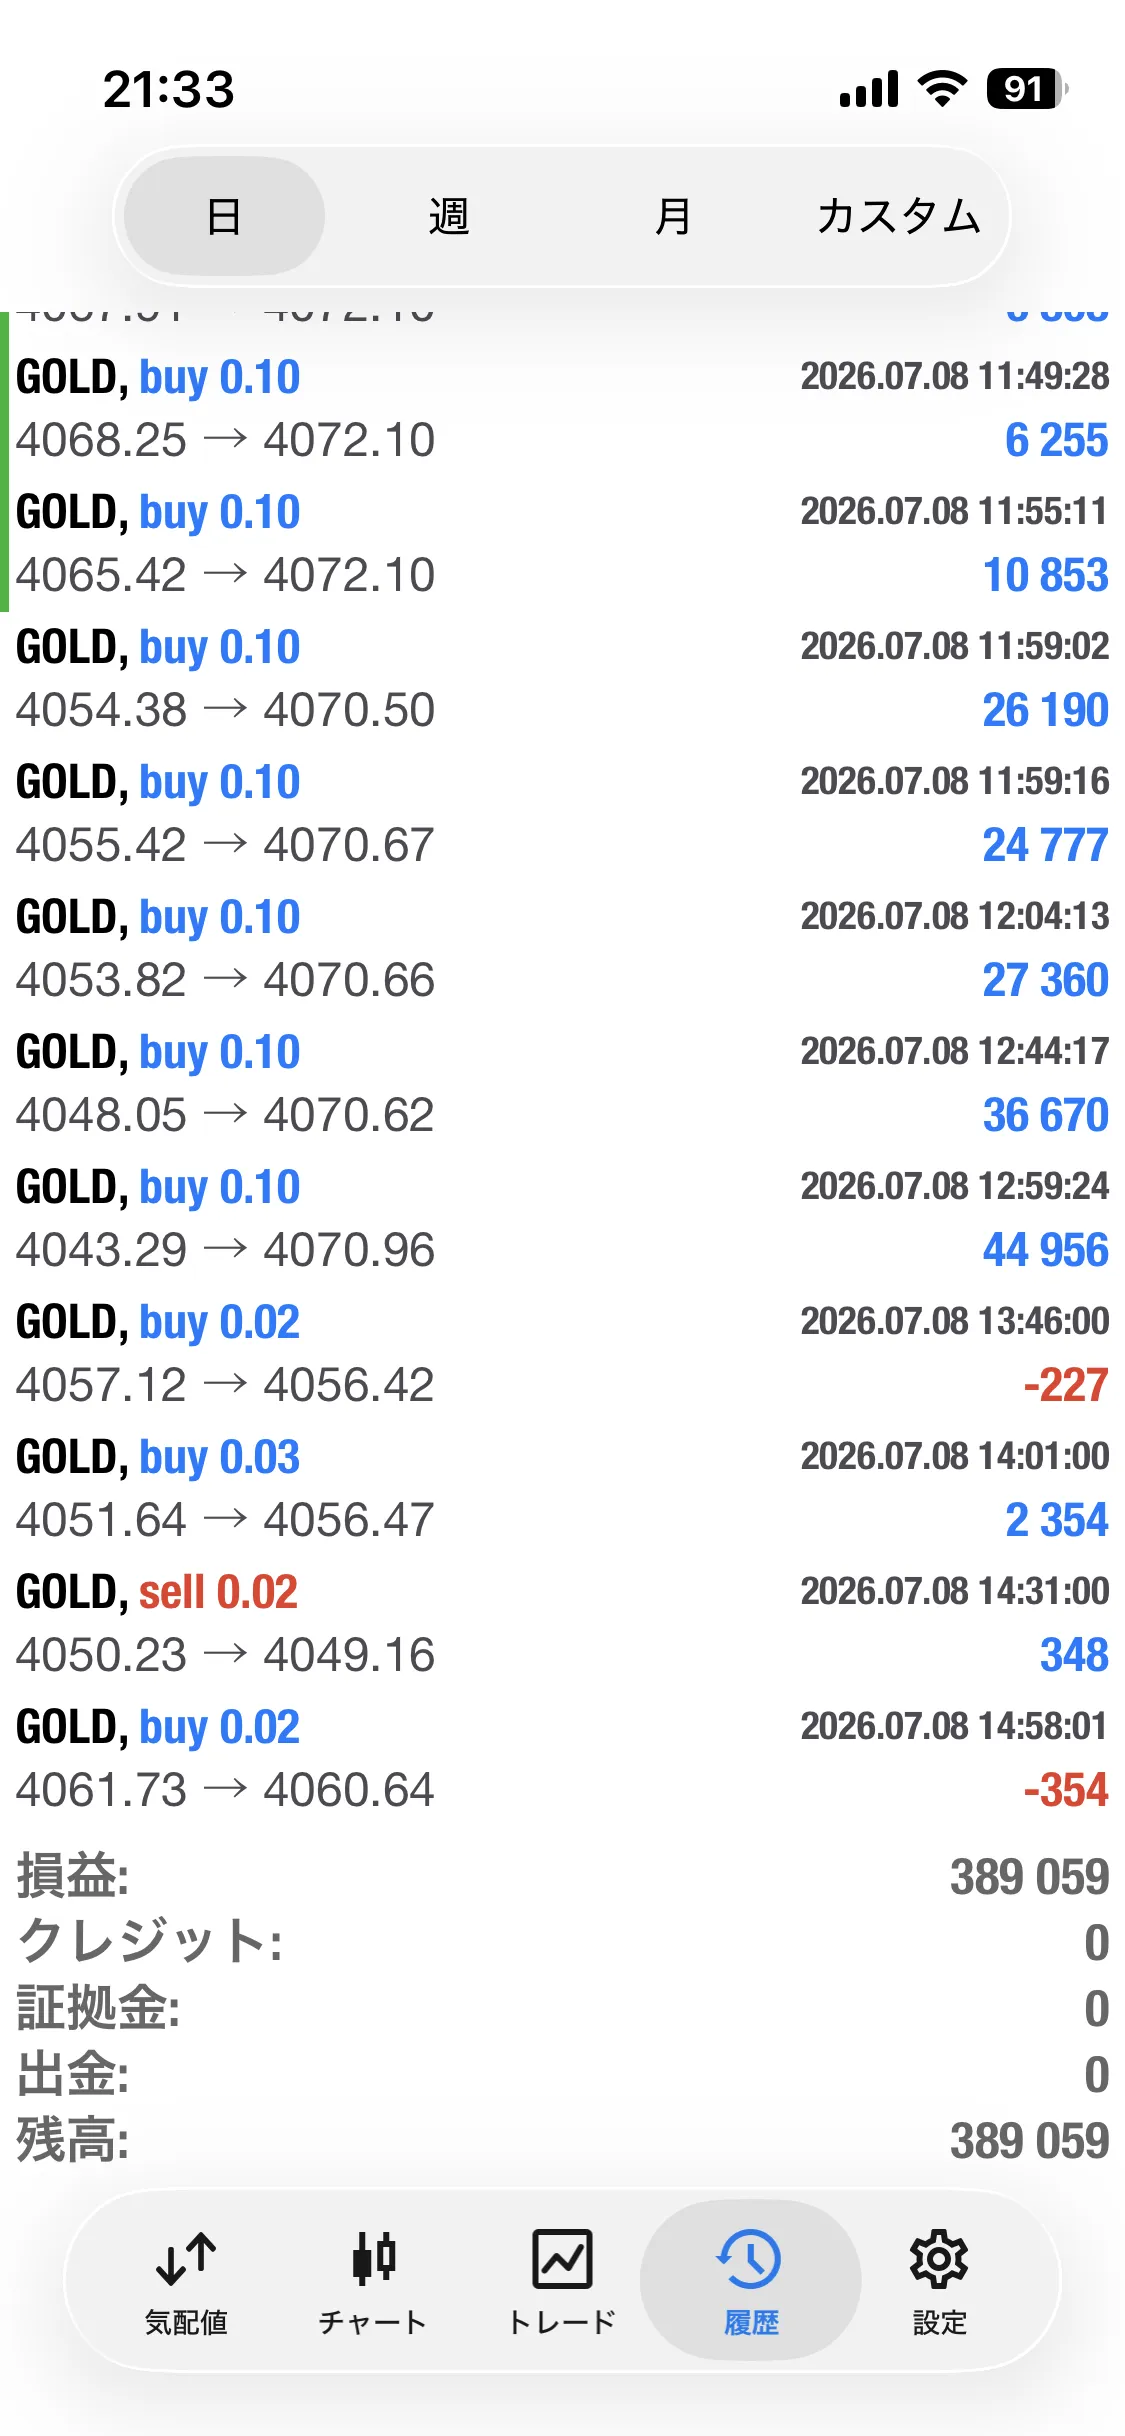
If you only target the same patterns, you can achieve explosive profits in a remarkably amusing way.
The key is whether you can wait for this pattern to come.
If you rush in, you’ll just be doing a counter-trend and you’ll die.