
Daily Nikkei 225: 2026/7/8
Tool details for analysis link
Note: Has received steady high evaluations.
■ Newly developed Performance + Indicator DAVID
https://www.gogojungle.co.jp/tools/indicators/73936?via=users_products
■ Expert Trendline Drawing Indicator “Unmatched Sword”
https://www.gogojungle.co.jp/tools/indicators/54499?via=users_products
■ Indicator Pack MT4/5 version, monthly subscription
“Tenka Musou” Synchronization System
https://www.gogojungle.co.jp/tools/indicators/50319
“David” Synchronization System
https://www.gogojungle.co.jp/tools/indicators/73939?via=users_products
Trial版・Ultimate Synchronization System Monthly
https://www.gogojungle.co.jp/tools/ebooks/50353
Following: Current analysis article
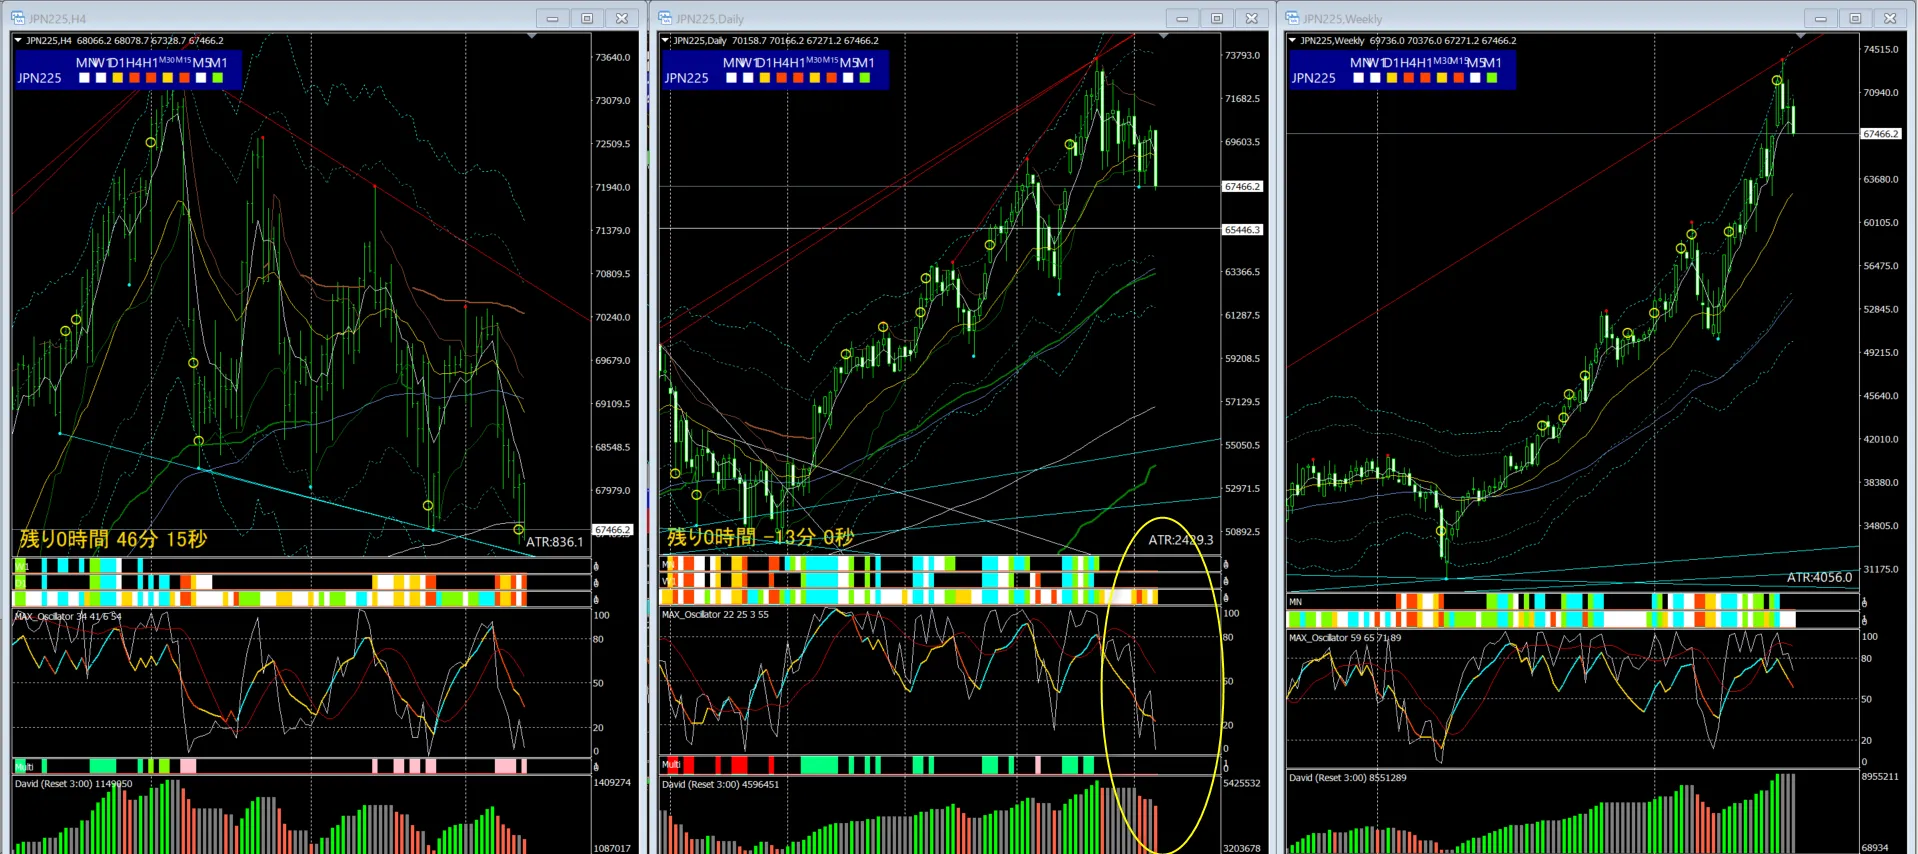
One-line comment: Range: Downward pressure intensifies
Daily chart:MAX Oscillator: Synchronization band“Weak decline”
4-hour chart“Strong decline” indicates signal
Weekly chart – “Neutral” suggests caution
■ Within range, downward pressure intensifies
Daily EMA around 20 shows rebound; still in a range
Looking at the daily MAX Oscillator, is downward pressure somewhat strong?
For a while, a wedge-like range is forming on the 4-hour chart,
more likely to be downward bias
There are times when price movement becomes extremely volatile depending on the time
If you think it's dangerous, it may be best to exit immediately and manage risk as always
requires caution as a constant
Do not ignore near-term moves; maintain a flexible approach to short-term fluctuations
Be especially careful about sudden, rapid changes
Notes
Volatility is quite high, so be careful with capital management.
Important
This is an analysis comment using the original indicatorCurrent situation analysisand does not constitute buying/selling recommendations or promise future movements.
Note: This does not recommend trading or guarantee future movements.