
Everyday Nikkei 225: 2026/7/7
Analysis Tool Details Link
Note: We have steadily earned high praise.
■ Newly Developed Profitability + Indicator DAVID
https://www.gogojungle.co.jp/tools/indicators/73936?via=users_products
■ Superb Trend Line Drawing Indicator “Unmatched Sword”
https://www.gogojungle.co.jp/tools/indicators/54499?via=users_products
■ Indicator Pack MT4/5 Version - Monthly
“天下無双” Synchronization System
https://www.gogojungle.co.jp/tools/indicators/50319
“David” Synchronization System
https://www.gogojungle.co.jp/tools/indicators/73939?via=users_products
Trial Version · Ultimate Synchronization System Monthly
https://www.gogojungle.co.jp/tools/ebooks/50353
Below: Current Analysis Articles
One-line Comment: Range
Daily chart:MAX Oscillator: Synchronization Band“Neutral”
4-hour chart“Strong Uptrend” indicated tendency
Weekly chart “Neutral” indicated tendency
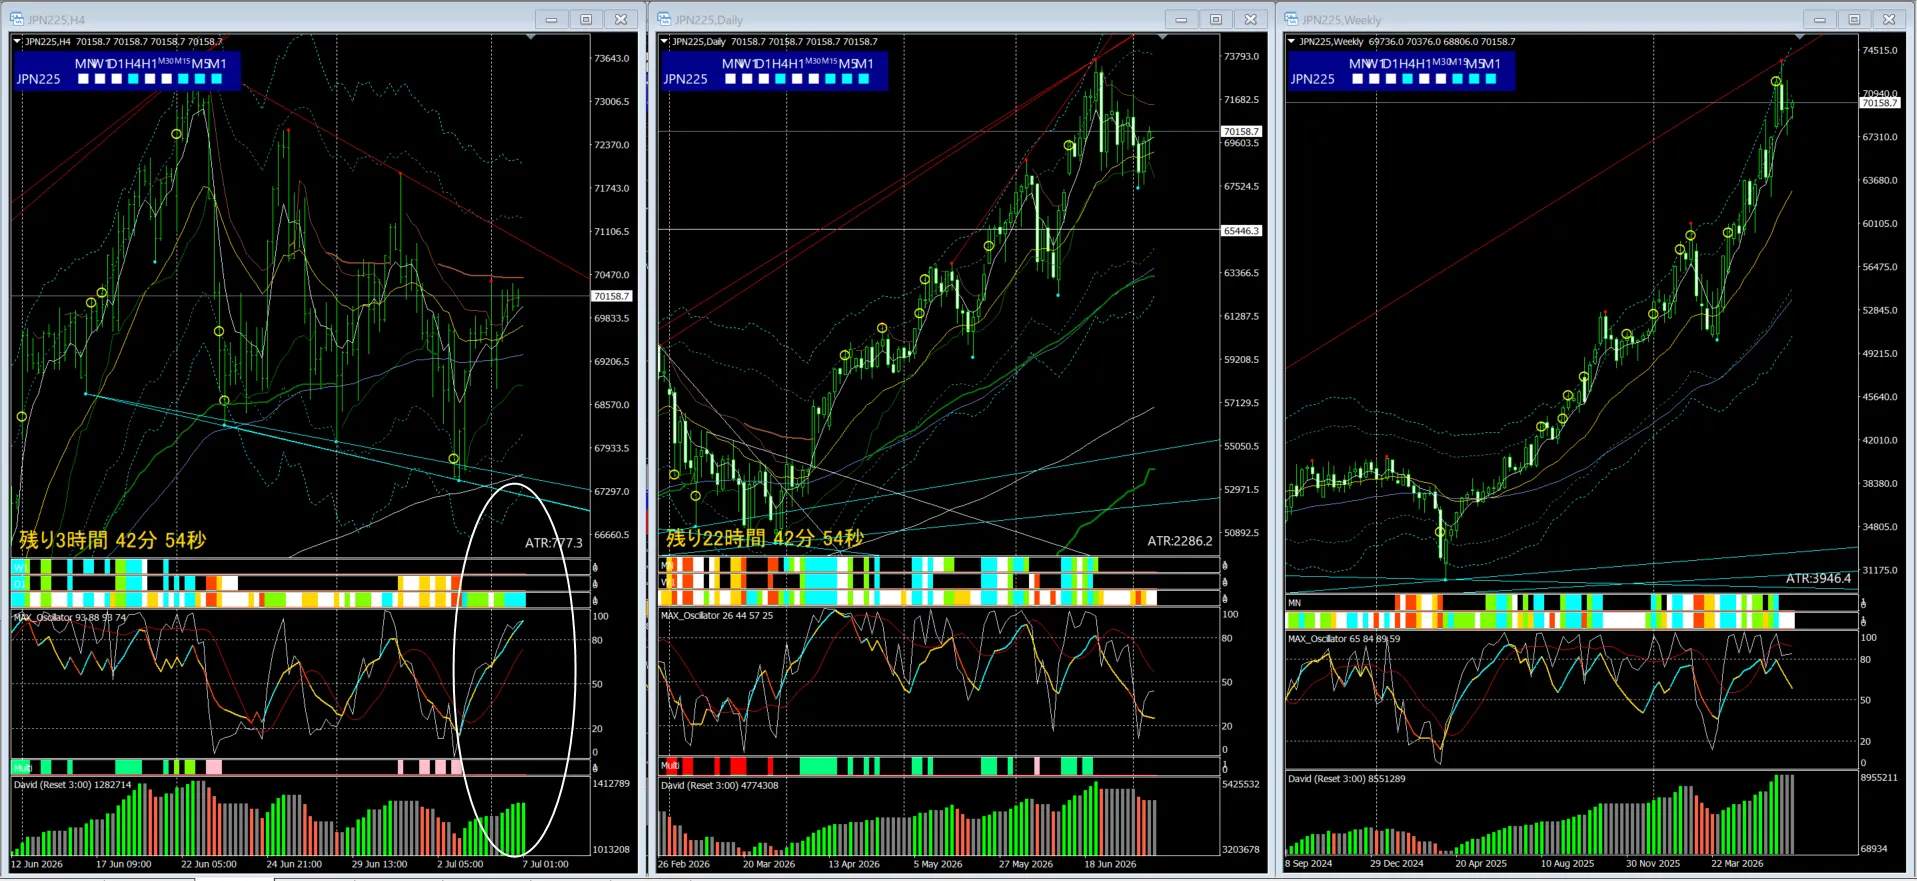
※ Range within rebound
Rebound near daily EMA 20 - still in a range
Looking at the daily MAX Oscillator, is there slightly stronger downward pressure?
For a while, it seems to form a wedge-like range on the 4-hour chart
and may move within that
For the time being, should we flexibly react to the near-term waves?
There are times when price moves become extremely volatile depending on the time of day
If you think it’s dangerous, it’s better to exit quickly and manage risk as well
Caution remains essential.
Do not ignore near-term moves; keep a flexible attitude to respond to short-term waves
Be especially wary of sudden sharp changes!
Important considerations
Volatility is fairly high, so be mindful of capital management.
Notes
This is an analysis comment of the current situation by the original indicators,and does not constitute buy/sell recommendations or guarantee future movement..
This does not recommend trading or guarantee future movements.