
NK225 Futures MTF Dow Theory: 4 Scenario Analysis Report 2026-07-07 (For Intraday Session)
NK225 Futures MTF Dow Theory Analysis Report
1. Trend Table
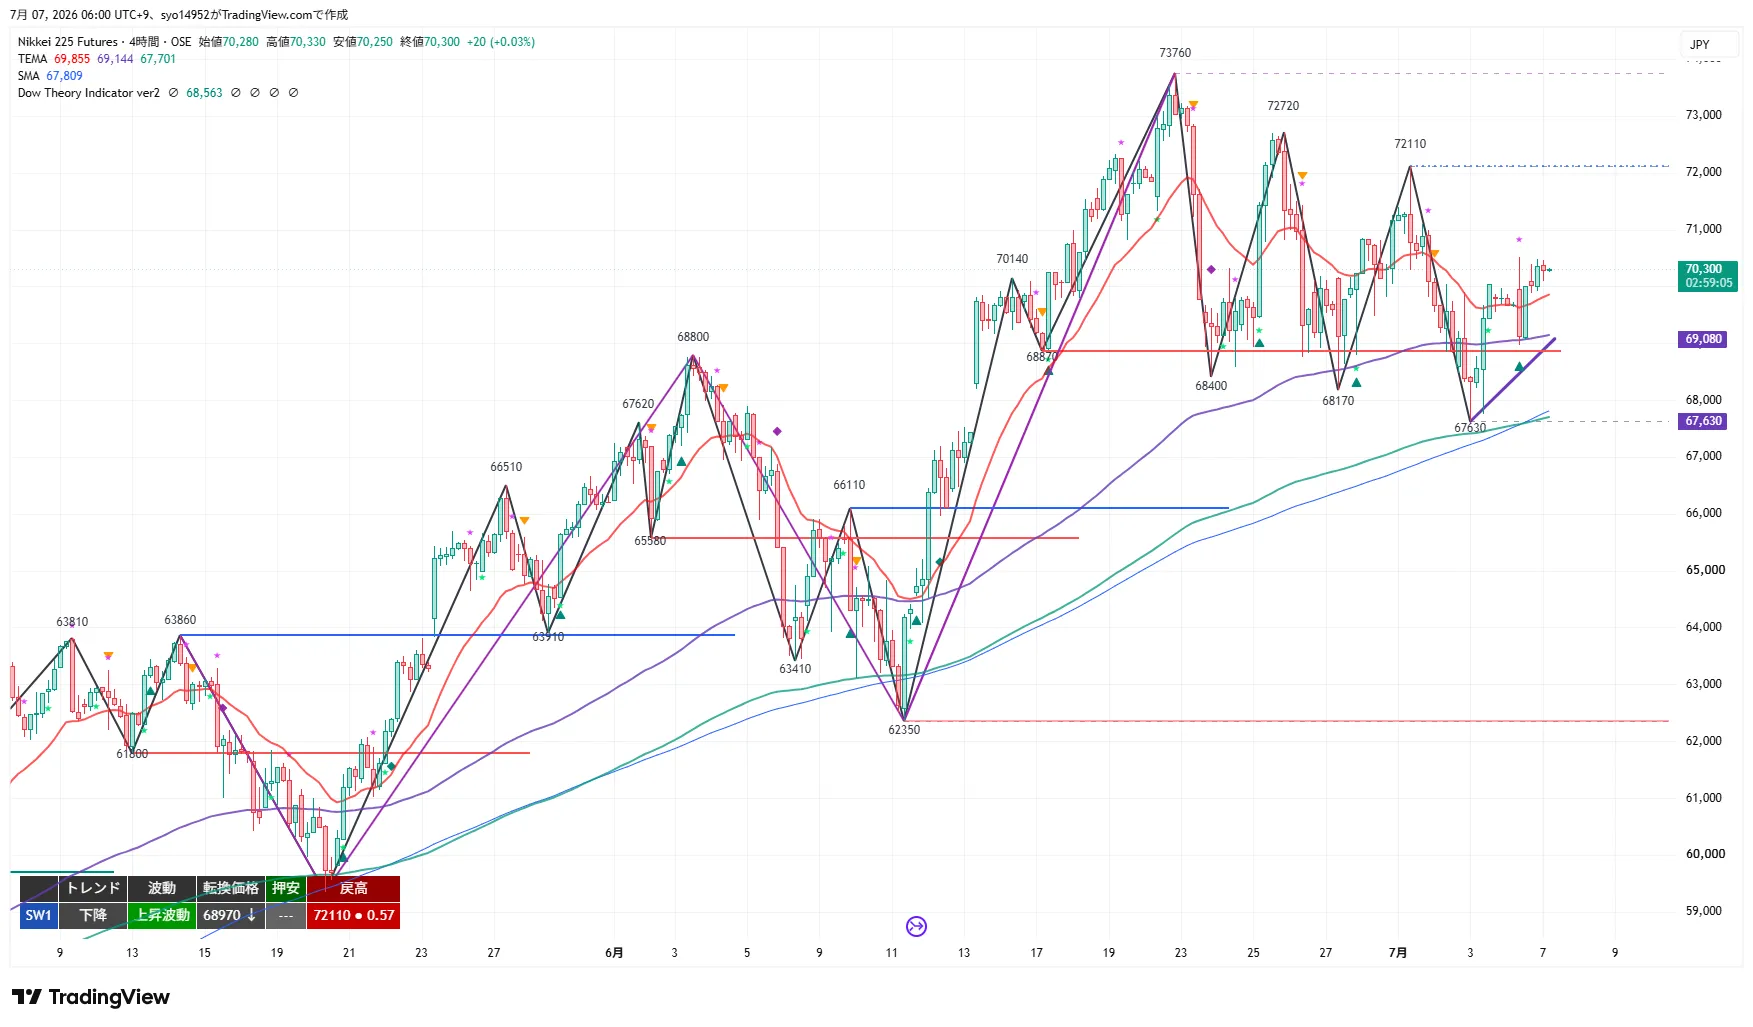
Downward/Upward waves. Transition price 68,970, pullback low not yet formed, retracement high 72,110. In the downtrend where retracement highs were stepped down from 73,760 → 72,720 → 72,110, the price rebounded from 67,630 and raised the pullback low from 67,630 → 68,970 to return to 70,300. The price has reached the 4H 20EMA (around 70,400, downward slope) and is above the resistance band of 70,490–70,520, and is above the 120EMA (24-hour equivalent to 68,600) and the 200EMA (around 68,000).
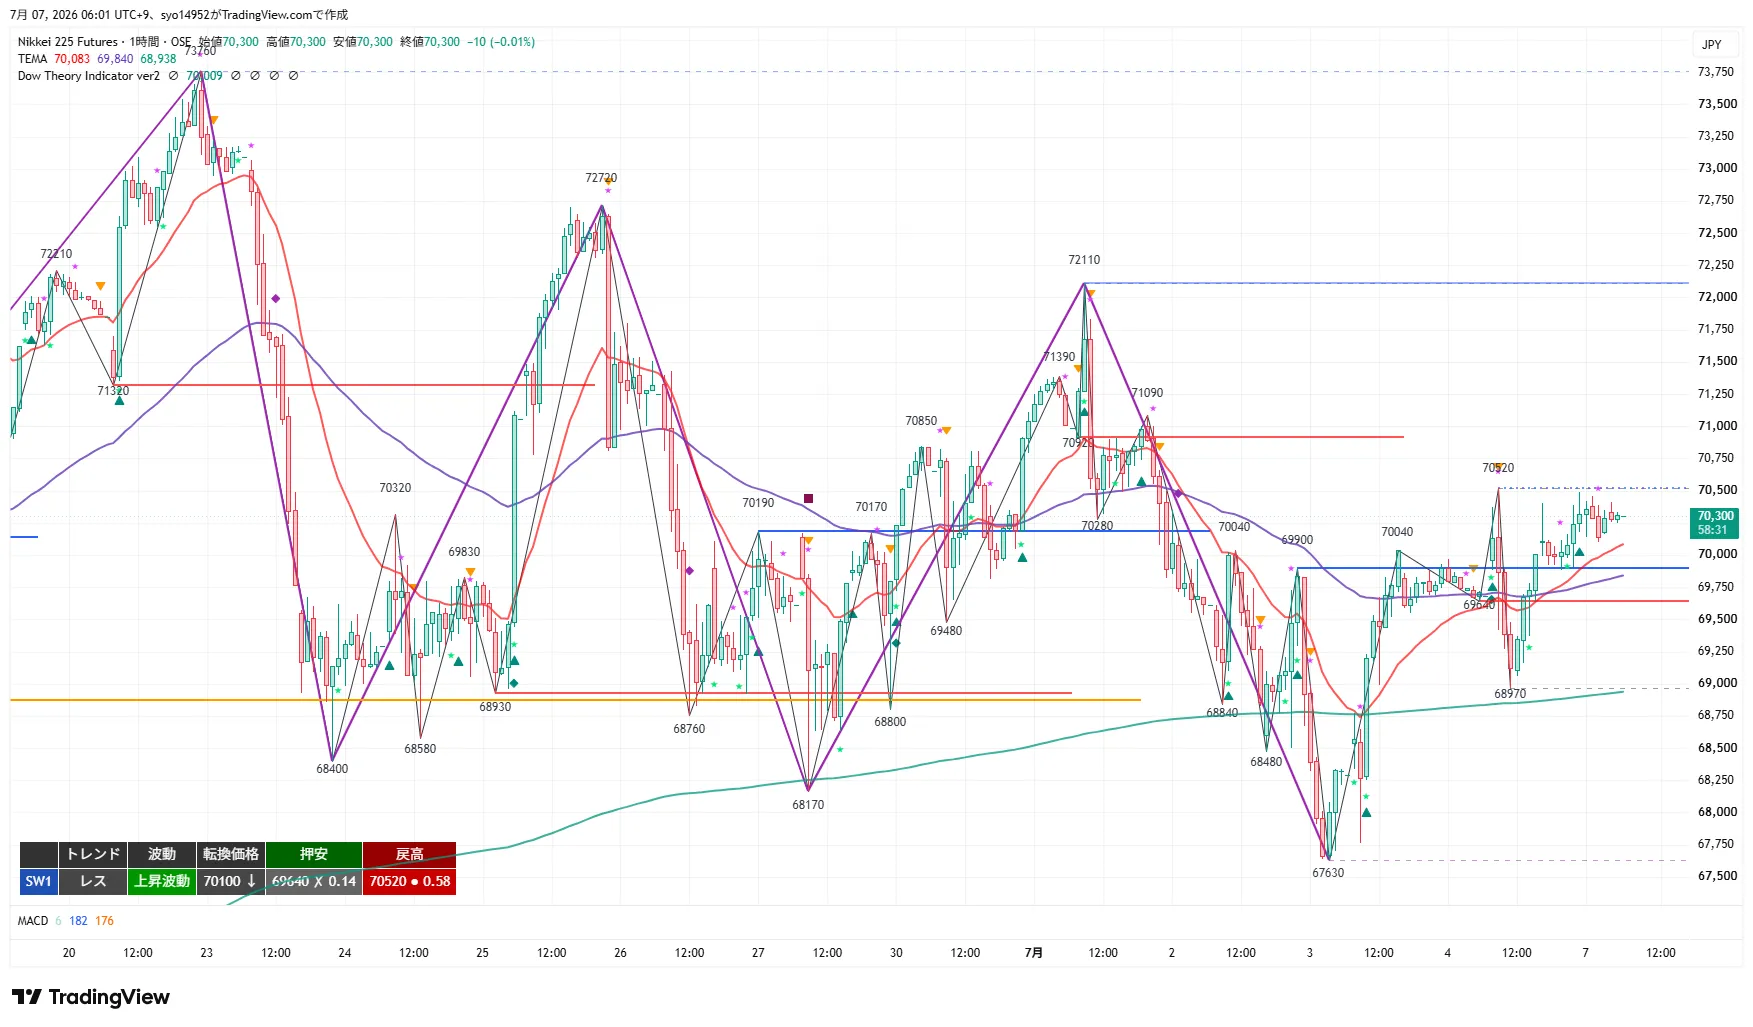
Rest/Upward wave. Transition price 70,100, pullback low 69,640 (breached), retracement high 70,520. After recovering from 68,970 to 70,520, price has been range-bound around 70,300. The 20EMA is rising and price is above it, returning above the 480EMA (24-hour equivalent to 20EMA).
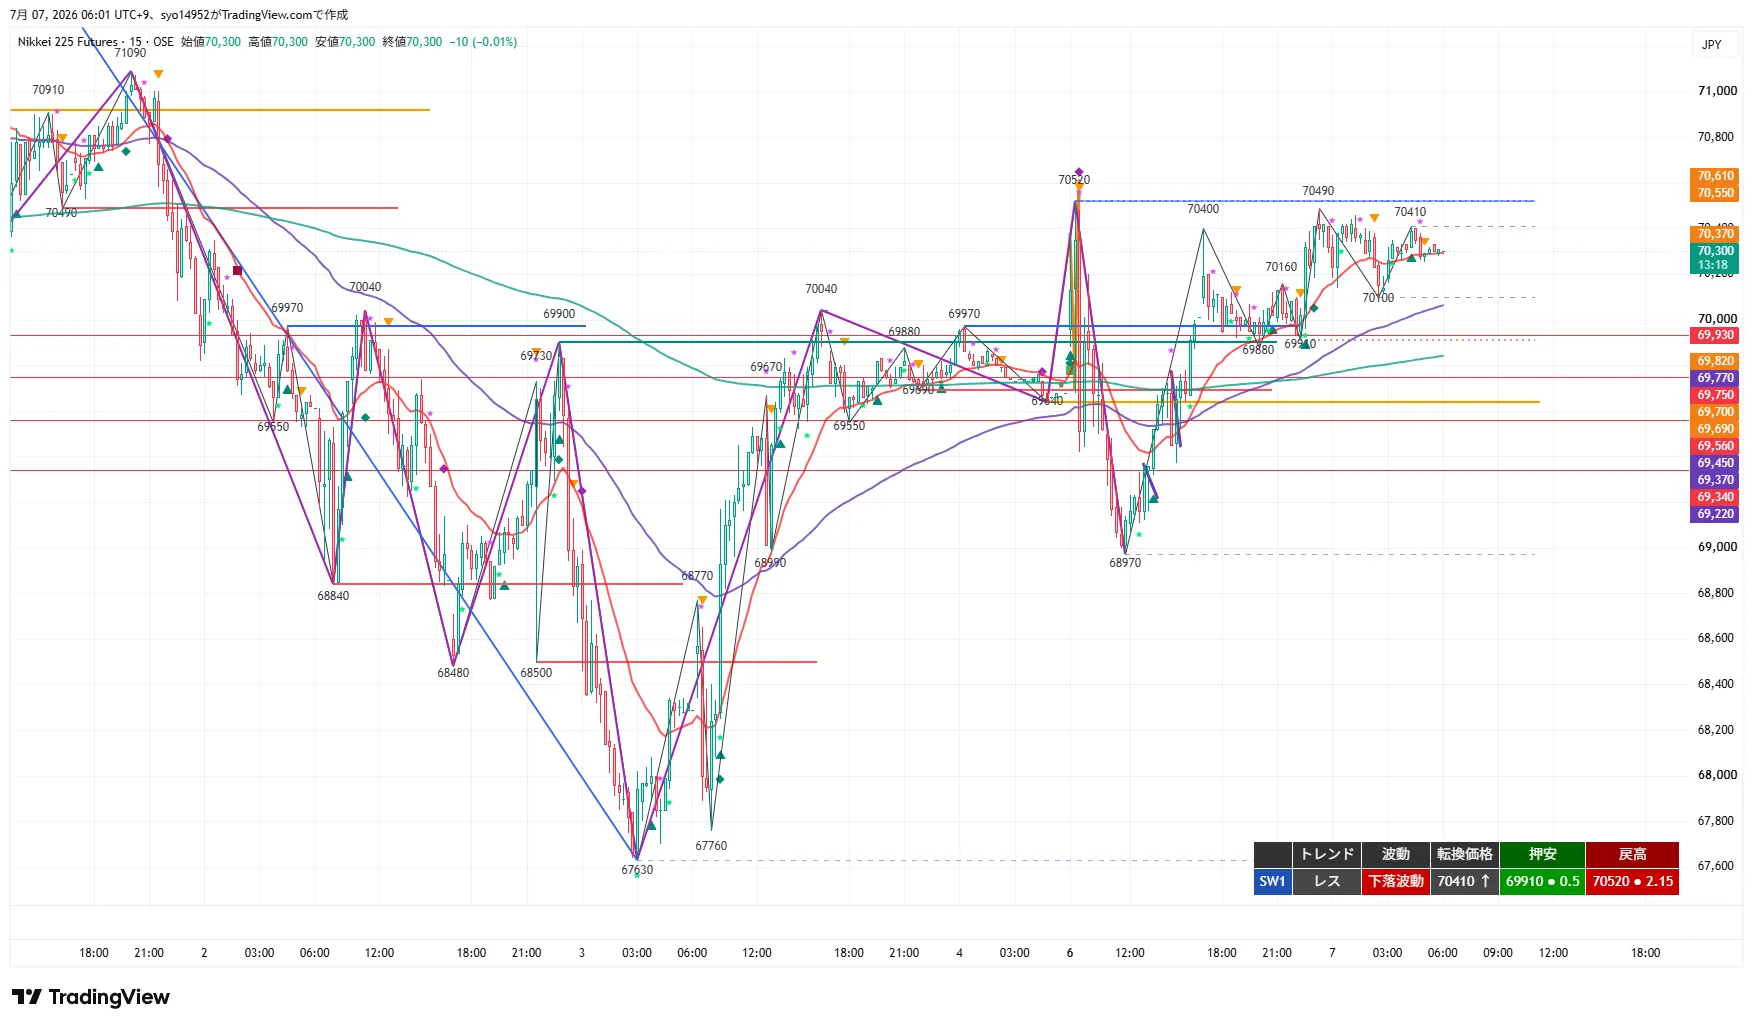
Rest/Downward wave. Transition price 70,410, pullback low 69,910, retracement high 70,520. A small pullback from 70,520 to 70,300 and a consolidation in the high 70,100–70,490 zone. The 20EMA is flat, positioned above the 320EMA (4H 20EMA equivalent around 69,900).
2. Key Price Levels
- 73,760 JPY: 4H/Daily retracement high and recent high. Final upside target.
- 72,720 JPY: 4H retracement high (previous top).
- 72,110 JPY: 4H retracement high (July 1 high). Confirmation of 4H upward regression / ①T2.
- 71,090 JPY: Old retracement high. Upper bound of zone ③ retrace sell zone 2 / ①T1.
- 70,850 JPY: Old segment. Lower bound of zone ③ retrace sell zone 2 / intermediate resistance.
- 70,520 JPY: Recent high (7/6 high) / old pullback low (7/1) / 4H 20EMA band. Trigger for long entry following a breakout of ① and upper bound of zone ③.
- 70,490 JPY: Recent high (7/7) / old pullback low. Lower bound of zone ③ zone 1.
- 70,410 JPY: 15m transition price.
- 70,300 JPY: Current/Night close price.
- 70,100 JPY: 1H transition price. Upper bound of zone 2 / main cluster.
- 69,910 JPY: 15m pullback low. Lower bound of zone 1 / ④ trigger.
- 69,640 JPY: 1H old pullback low (breached → consolidated). Upper bound of zone 2 / ④ main cluster.
- 68,970 JPY: 4H transition / recent low. Lower bound of zone 2 / ③/④ T1.
- 68,480 JPY: Turning point. ④ T2.
- 67,630 JPY: Rebound starting point / important low. Breach accelerates downside.
- 62,350 JPY: 4H/Daily structural low. Downside’s most important level.
3. 4H Analysis
The 4H timeframe shows a Downward and Upward wave pattern. Transition price 68,970, pullback low not yet formed, retracement high 72,110. From 73,760 → 72,720 → 72,110, the retracement highs were lowered, price has bounced from 67,630 and raised pullback low to 68,970, returning to 70,300. Price reaches the 4H 20EMA (around 70,400, downward) and sits above the resistance band of 70,490–70,520, and above the 120EMA (24-hour equivalent to 68,600) and the 200EMA.
Although the pullback low has risen and the retracement appears strong, the 4H downward wave (with retracement high not yet updated to 72,110) has not broken. If the price closes clearly above 4H 20EMA and 70,490–70,520, it would test 72,110; only after breaking 72,110 decisively would the 4H downward structure be considered broken. Downside levels to watch: 68,970 (transition), 68,480, 67,630 (start point). If 67,630 is breached, downside acceleration toward 67,000–66,000 is possible.
4. 1H Analysis
1H is a Rest/Upward wave. Transition 70,100, pullback low 69,640 (breached), retracement high 70,520. After rising from 68,970 to 70,520, price consolidates around 70,300. The 20EMA is rising and price remains above it, returning above the 480EMA (24-hour equivalent to the 20EMA).
If 70,520 closes above, the retrace continues and tests 70,850–71,090. Conversely, if 70,100 is breached on a 1H close, the upward wave would fail and a new downtrend would resume, with 69,910 and 68,970 in focus.
5. 15m Analysis
15m Rest/Downward wave. Transition 70,410, pullback low 69,910, retracement high 70,520. A small pullback from 70,520 to 70,300 and price holds in the high 70,100–70,490 zone. The 20EMA is flat, positioned above the 320EMA (4H 20EMA equivalent around 69,900).
If the 15m close breaks above 70,410–70,520, it would exit the range and push higher toward 70,850 and 69,910; breaks below the 70,100–69,910 and 68,970 would break the short-term structure. With price in a high-range, avoid trades in the range center; wait for clear close confirmations on higher or lower sides.
6. Conclusion
During night trading, price oscillated between 68,970 and 70,520, with a rebound from 67,630 (July 3) extending the up move to close at 70,300. The 4H shows a downward/upward wave (pullback low raised from 67,630 to 68,970), reaching the key resistance band at 4H 20EMA and 70,490–70,520. The 1H shows a Rest/Upward wave, and the 15m shows Rest/Downward wave with tight range near the highs. During the day, break of 70,490–70,520 (4H 20EMA/old pullback high) or stall determines the next move; break above could lead to a retrace toward 72,110, while stall suggests a pullback and selling pressure.
Break above 70,520 close would allow a continuation long from 70,520 to 71,090 and 72,110 (long target). Supportive pullbacks around 70,100–69,910 and 69,640–68,970 offer opportunities for pullback buying. If 70,520–70,520 resistance holds, selling pressure may emerge around 70,490–70,520 or 70,850–71,090. If 69,910 closes below on a 15m basis, downside becomes likely toward 68,970. Because the 4H downward trend remains, the upper side near 72,110 remains heavy, and buying should be protected with MFE considerations.
In summary, against the 4H downward/upward waves (retracement), the 1H Rest/Upward wave and 15m Rest/Downward wave indicate price is in the key resistance zone around 4H 20EMA and 70,490–70,520. While there is upward momentum due to rising pullback lows (67,630→68,970), the 4H retracement high of 72,110 has not been broken, so until 70,520 and 72,110 are exceeded on a close, the outlook remains a range and a pullback opportunity remains available. The market will be treated with four equal scenarios.
7. Trade Ideas
- Trigger condition: Break above 70,520 (recent high / July 6 high / old pullback low = 4H 20EMA band) on a 15m close (continuation of the retracement / break of 4H 20EMA).
- Pre-signal: After the breakout, pullback near breakout price or near sloped 20MA in 1m/5m charts to time the wave turn (back-entry, target around 70,520, breakout price as reference).
- Confirmation / Target: 70,520 recaptured on 1H close.
- Stop & invalidation: prior leg breaches 70,070; entry leg breaches 69,910.
- Targets: 71,090 (partial take + at cost), 72,110.
- RR: Based on trigger at 70,520 / LC 70,070 (risk 450). T1 71,090 +570 = RR1.3; T2 72,110 +1,590 = RR3.5.
- Note: 4H has heavy resistance at 72,110 (4H retracement high). Only after a clear close above 72,110 would the 4H downtrend be considered broken. Focus on the main leg.
- MFE protection: exit at +200 or +300 with trailing; given the pullback in the 4H downtrend, avoid chasing highs; protect early.
- Standard: Shallow pullback zone 1: 70,100–69,910 (1H transition -> 15m pullback low), or Deep pullback zone 2: 69,640–68,970 (1H old pullback low -> 4H transition / recent low). Confirm rebound with 15m close.
- Pre-signal: Shallow target 69,960 (LC 69,610), deep target 69,100 (LC 68,770). In a 4H down/up retracement, use supports at 70,100/69,910, 68,970 for clear rebound confirmation, and verify near 20MA for confirmation of ascent.
- Confirmation / Target: 70,520 recaptured on 1H close.
- Stop & invalidation: prior leg breaches 69,610 (deep pullback 68,770); main leg breaches 68,970. Full exit if 68,970 breached → switch to ④.
- Targets: 70,520 (partial take + at cost), 70,850.
- RR: Trigger at 69,960 / LC 69,610 (risk 350). T1 70,520 +560 = RR1.6; T2 70,850 +890 = RR2.5.
- MFE protection: exit at +200 or +300 with trailing. Since this is a pullback buy within a 4H downtrend, protect early.
- Standard: Retracement zone 1: 70,490–70,520 (recent high / old pullback high = 4H 20EMA band) and confirm stall on a 15m close. Deep retracement defines zone 2 as 70,850–71,090 (old segment / old retracement high).
- Pre-signal: Confirm retrace stall with 15m close (target around 70,470). Direction is in line with 4H downtrend; however, 1H/15m rising implies limited pullback playing; avoid early entries above the 20MA.
- Confirmation / Target: Break below 70,100 on 1H close (breakup of 1H up-move) → downside resumes.
- Stop & invalidation: prior leg recovers to 70,820; main leg recovers to 71,090. Strong invalidation at 72,110 (4H retracement high restores to ①). If 70,520 clears on a 15m close, invalidate briefly.
- Targets: 69,910 (partial take + at cost), 68,970 / 68,480.
- RR: Trigger 69,910 / LC 70,820 (risk 350). T1 68,970 +940 = RR2.8; T2 68,480 +1,430 = RR4.3.
- MFE protection: exit at +200 or +300 with trailing. Limit downside and avoid chasing; if T1 already hit on trigger foot, skip.
- Trigger: Break below 69,910 (15m pullback low) on a 15m close (pullback complete, downside resumes).
- Pre-signal: After breakdown, pullback near breakout price or near sloped 20MA in short timeframes (1m/5m) to time wave turn (back-entry around 69,910 vicinity, breakout price basis).
- Confirmation / Target: Break below 69,640 (1H old pullback low) on 1H close (downtrend continues).
- Stop & invalidation: prior leg recovers to 70,240; main leg recovers to 70,100. Full exit at 70,520.
- Targets: 68,970 (partial take + at cost), 68,480 / 67,630.
- RR: Trigger 69,910 / LC 70,240 (risk 330). T1 68,970 +940 = RR2.8; T2 68,480 +1,430 = RR4.3.
- Note: The 4H has lifted pullback low from 67,630 to 68,970; supports at 68,970 (4H transition), 68,480, 67,630 (rebound origin) are present; only after 1H/15m ascent (pullback) is a strong down move triggered. Be cautious of sharp reversals or traps in the lower price zone; await clear close below before triggering.
- MFE protection: exit at +200 or +300 with trailing. Stay protected and avoid chasing; if trigger is confirmed and T1 reached, skip.
8. Current Actions
- Most important line 1: 70,490–70,520 (recent high / old pullback low = 4H 20EMA band) — If 15m closes above, continue the retrace and follow the breakout long above 4H 20EMA (71,090→72,110). If momentum stalls beforehand, consider selling rallies.
- Most important line 2: 70,100 (1H transition) / 69,910 (15m pullback low = downturn resumed) — Pullback buying with a hold at 70,100–69,910 and a rebound; If 69,910 closes below on 15m, expect a full retrace and downturn toward 68,970; watch for 67,630 breach to accelerate further.
- Market tone: With a 4H down/up wave (retracement) and rising pullback lows, price reaches the key resistance at 4H 20EMA and 70,490–70,520. Upward momentum exists, but 4H downward trend (72,110 retracement high not broken) persists; higher levels near 72,110 are heavy. Keep buy and sell balanced at the resistance, protect via MFE early, and avoid deep chasing.
9. Points of Attention
- Entry price, trigger, and stop are based on the chart shape at the close. If the structure changes over time, adjust entry price using lower timeframe wave-turn prices unless higher timeframe structure changes; adopt the approach that best reflects actual conditions.
- There is a gap between night close (06:00) and day open (8:45). Watch gap positions: if price significantly exceeds target on open, breakout entries may be treated as partial or pass through gaps; pullback buys are void if zone not reached. Around NY Open (summer time ~22:30), watch for reversals near zone boundaries; confirm reversals/ stall with 15m closes to validate triggers (do not enter too far away from prices).
- 4H remains in a resistance zone around 70,490–70,520. Do not rush entries inside the middle of the range; await a clear close above 70,520 or a break below 70,100/69,910 to confirm.
- Buying (①,②) is within the retracement buy zone in a 4H down trend; the upper resistance at 70,850–72,110 requires early MFE protection. Selling rallies (③) is limited to 1H/15m rising conditions; be mindful of traps and avoid overtrading; maintain caution near ④ with support at 67,630 (rebound origin).
- If the break triggers already reached Target 1 at a confirming foot, treat as not taking further. ///
10. About This Report
This report analyzes NK225 futures using Dow Theory Indicator across three timeframes: 4H / 1H / 15m.
Note: This report is for information purposes and does not constitute trading advice. Investment decisions should be made at your own discretion and responsibility.