

NK225 Futures MTF Dow Theory 4-Scenario Analysis Report 2026-07-03 (for US session)
NK225 Futures MTF Dow Theory Analysis Report
Date and Time: July 3, 2026 06:11 JST / Night Session Close
Current Price: 68,290 JPY
Target: For the Daytime Session (7/3)
Conclusion
The night session continued to fall, breaking 68,170 and dropping to 67,630, then rebounded to 68,290 to close. On the 4H chart, there is a reset and downward movement; the 1H chart shows a downtrend with downward waves being dominant, but it reached a major support zone around the 4H 120 EMA (equivalent to the daily 20 EMA) and the 15m began to rebound into an upward wave. During the daytime, the basic approach is a range of selling rallies, with attention to rebounds (buying the dip) at supports of 67,630 and 67,000.
Rebound selling is expected in the ranges 68,490–68,840 and 69,730–69,900 if rallies stall. If 67,630 closes below on the 15m, the downside pressure continues toward 67,000 and 66,000. If a rebound is confirmed at 67,700–67,630 and 67,000 supports, consider buying the dips (counter-trend). A decisive break above 68,840 would make the rebound more robust; stay with long positions that follow the breakout, while maintaining protection for MFE.
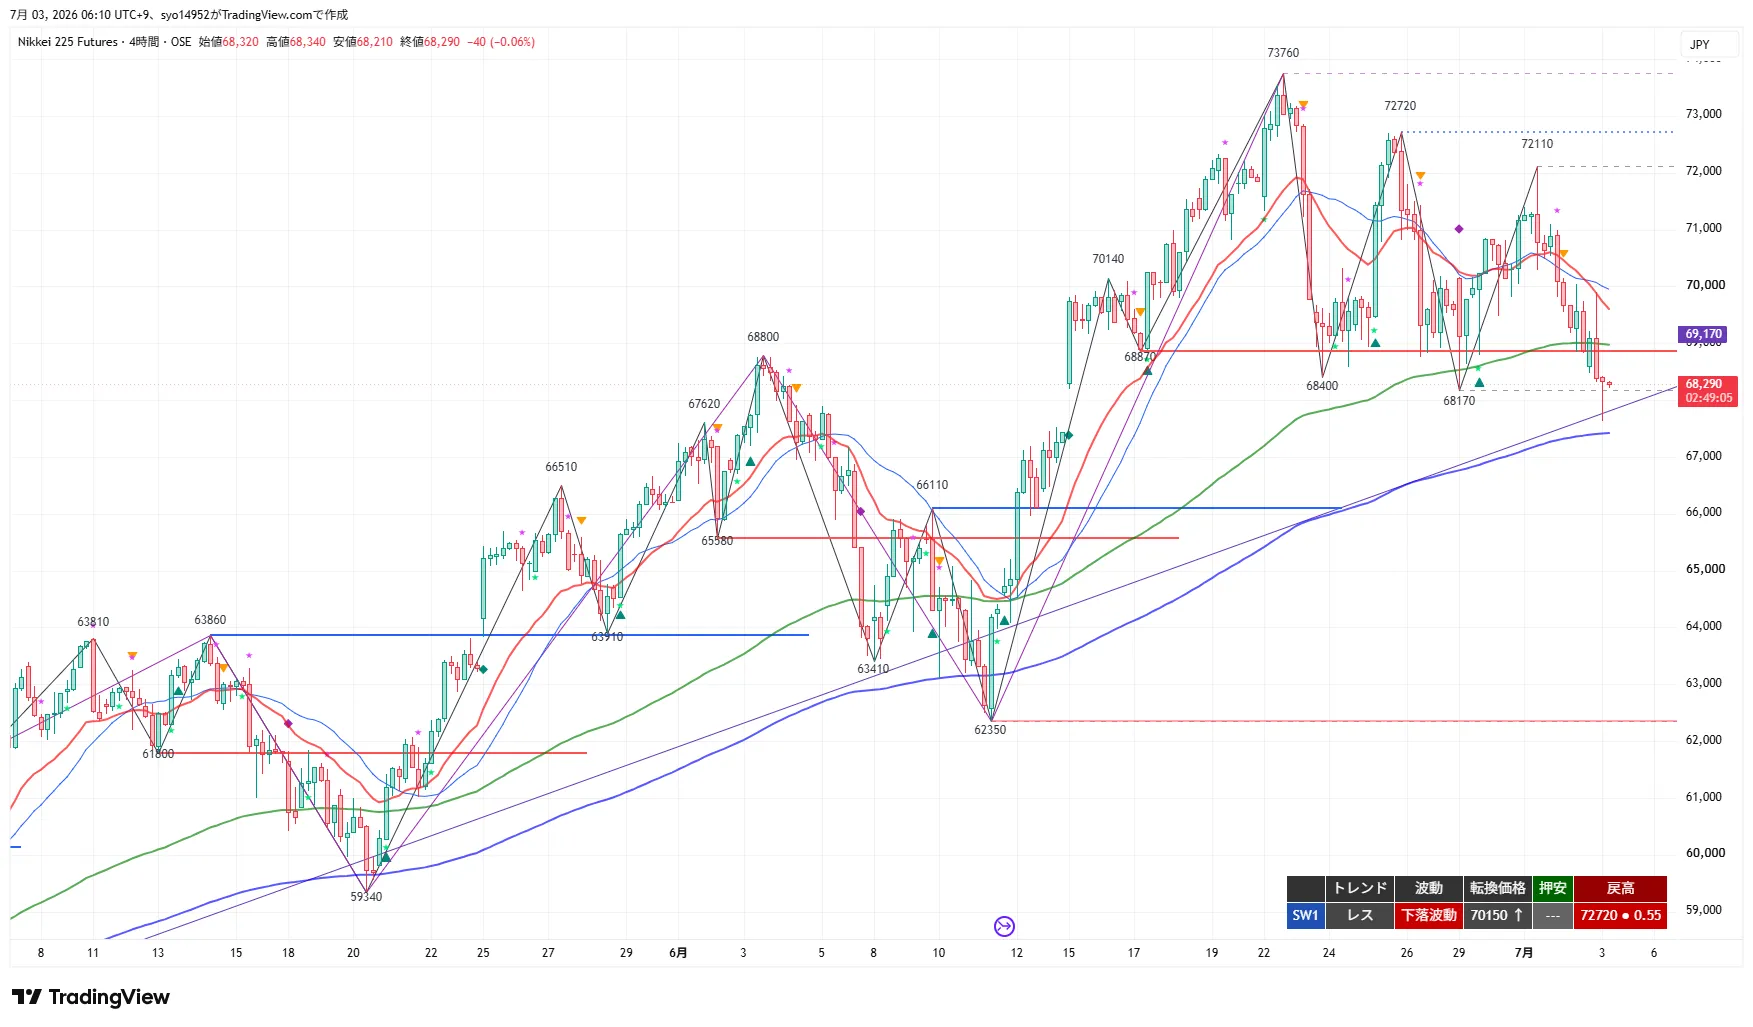
4H Analysis
The 4H chart shows a reset and downward movement. Turning point at 70,150, no forming swing low yet, rebound high at 72,720. After lower highs from 73,760 to 72,720 to 72,110, the price fell from 72,110, broke 68,170, and reached 67,630. Price has broken the 4H 120 EMA (around 68,500) and is approaching the major support band near the 200 EMA (around 67,500). The trend indicator has shifted from down to reset, signaling a pause and waiting for a decisive move downward.
Downward momentum remains dominant, but if the price reaches the major supports (daily 20 EMA around 67,630 and 67,000) and holds, a rebound could occur. Upside targets are 70,150 (turning point) and 72,720; a rebound remains within the range unless 70,150 closes above.
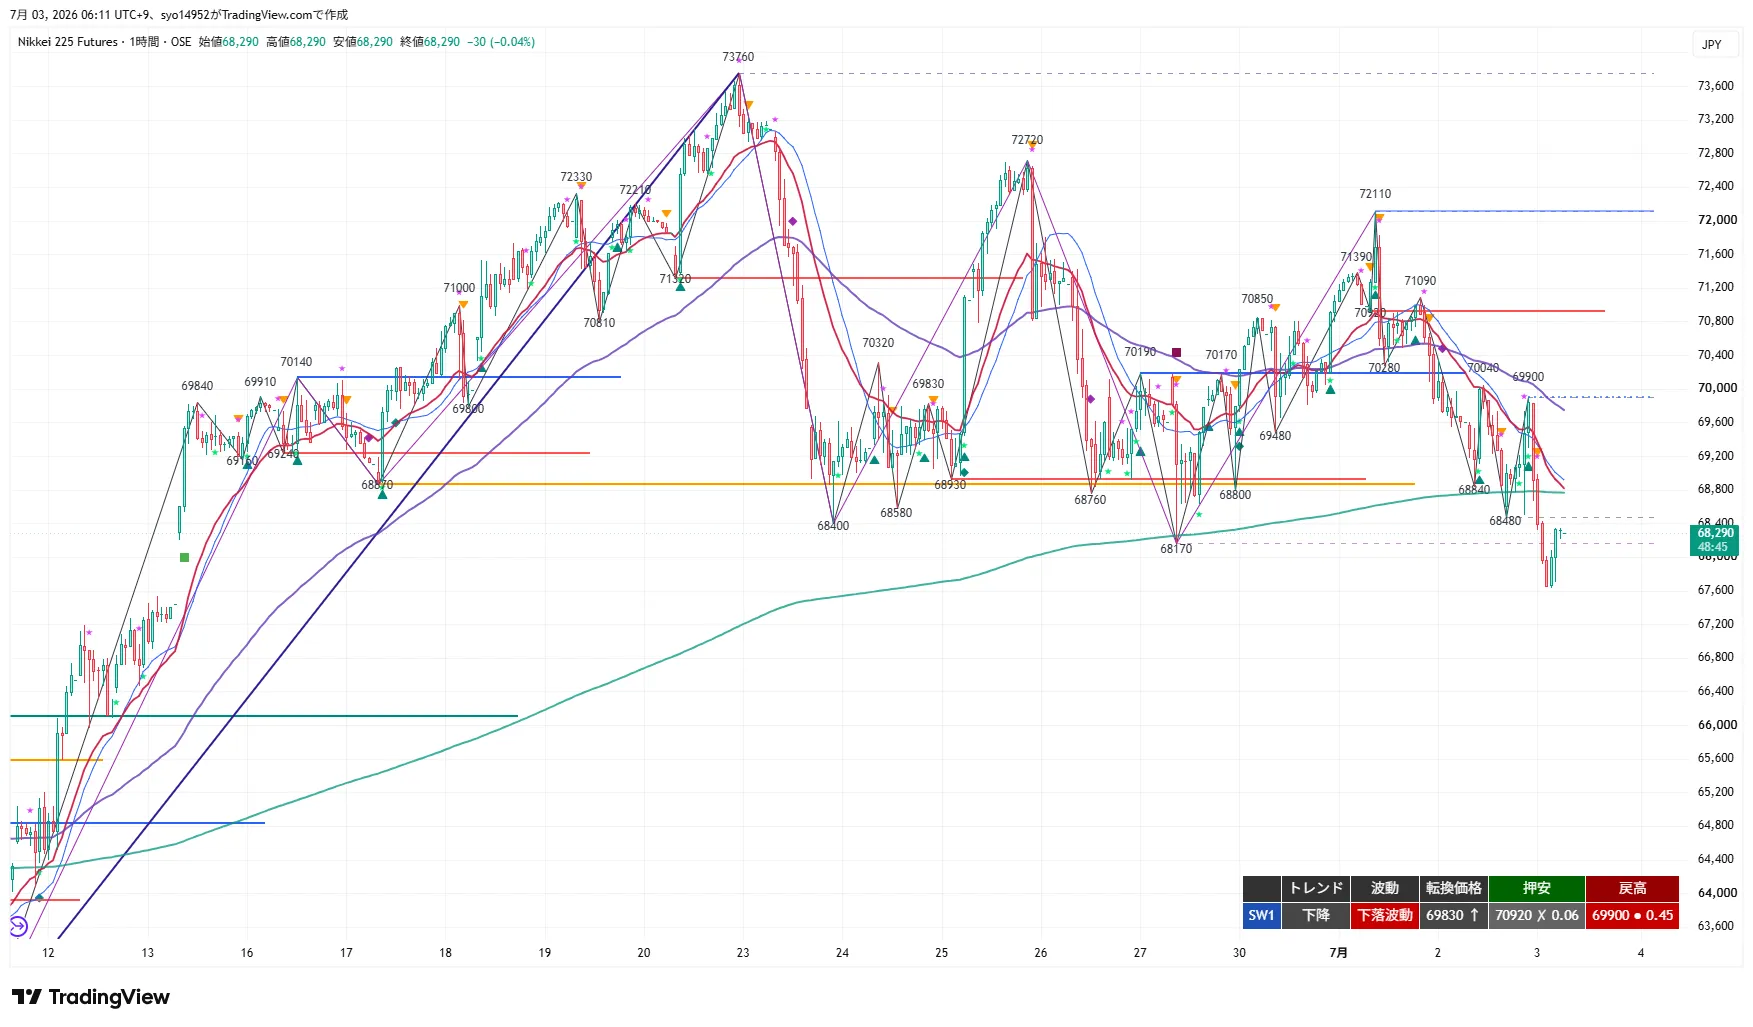
1H Analysis
The 1H chart shows a down and downward-move pattern. Turning point at 69,830, no established swing low (the prior swing low of 70,920 has been breached), rebound high at 69,900. The price fell from 72,110 to 69,900 to 68,480, and down to 67,630, finally at 68,290. The 20 EMA and 80 EMA are both downward-sloping and the price lies below them.
Rebound rallies are expected in the 68,490–68,840 area, with deeper pullbacks around 69,730–69,900 likely to stall. If 67,630 breaks, downside continues toward 67,000 and 66,000. A recovery above 69,830 on a 1H close would be the first signal for a potential uptrend reversal.
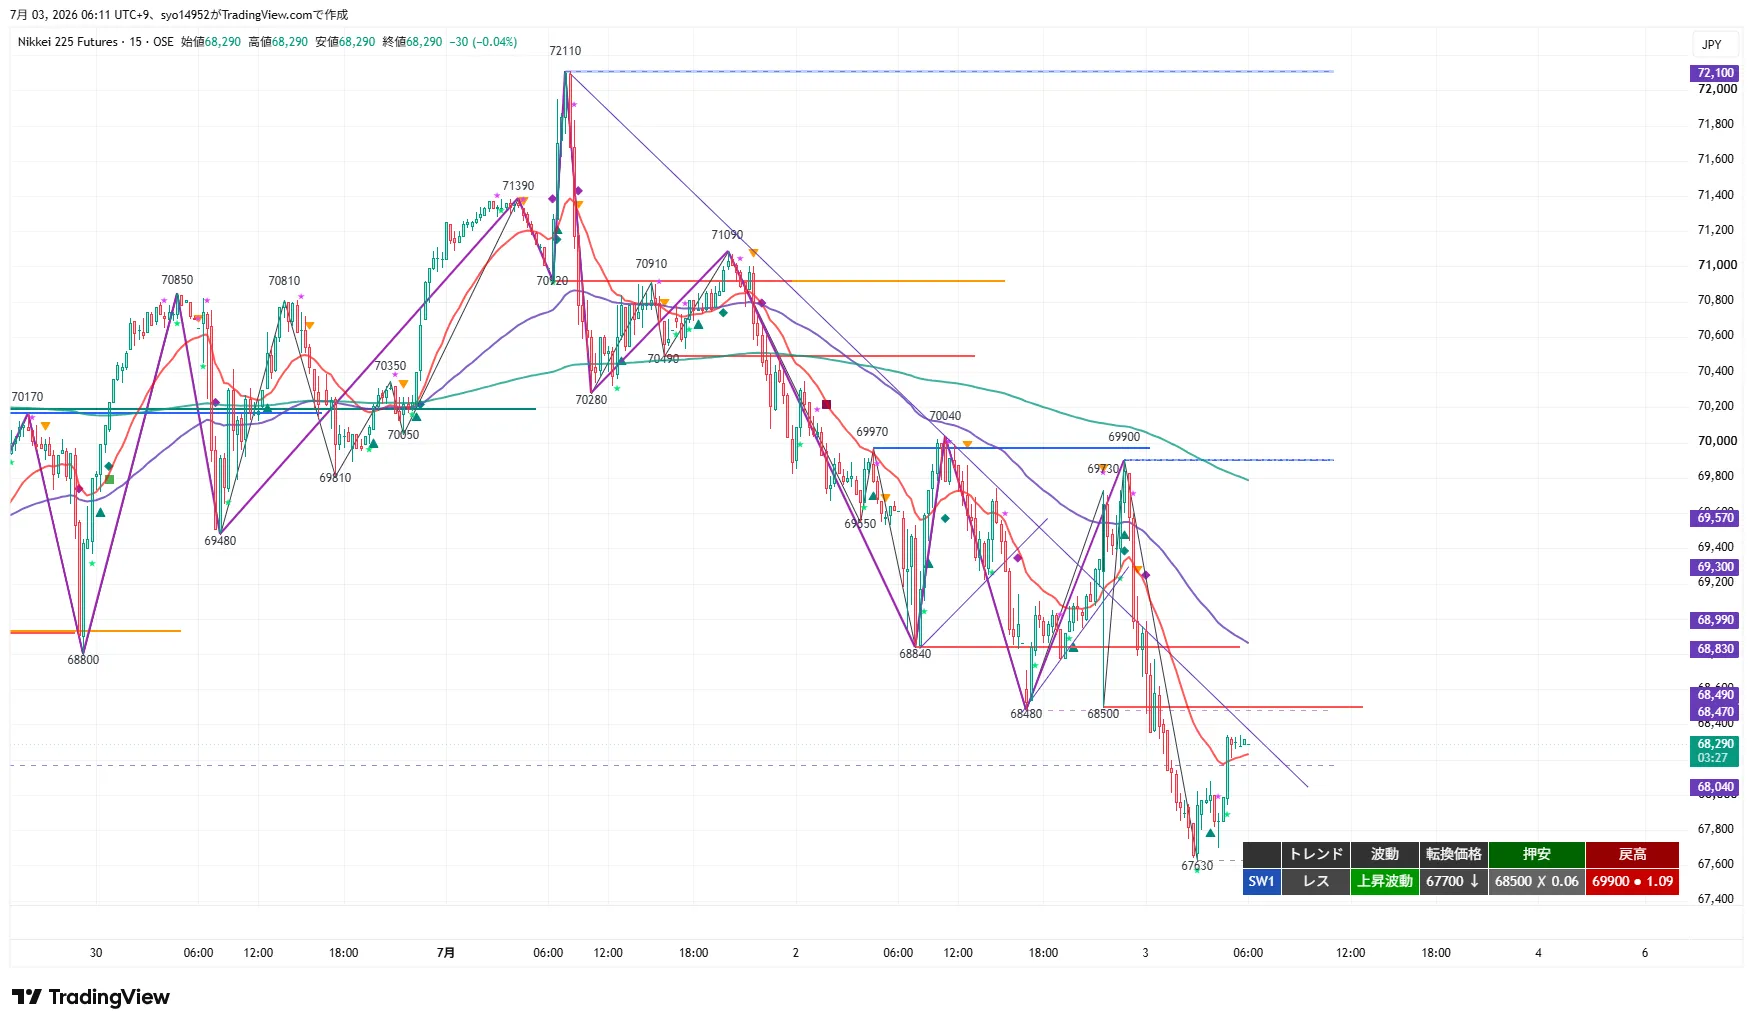
15m Analysis
The 15m chart shows a reset and an upward wave. Turning point at 67,700, a breached swing low at 68,500, and rebound high at 69,900. After dipping to 67,630, price rebounded to 68,290. The 20EMA and 80EMA (1H 20 EMA equivalent) trend downward to sideways, with the price below the 320 EMA (4H 20 EMA equivalent around 68,900).
If 67,700 is broken on a 15m close, the short-term rebound ends and a downside move resumes. A breakout above 68,840 would intensify the rebound. The zone between 67,630 and 67,700 serves as a short-term divergence point; with upper-timeframe downtrend, keep a cautious stance on rallies and treat rebounds near key supports as potential dip-buying opportunities.
Verification of the Previous Trade Ideas
Target: Night Session
- ① Breakout-following long: Not materialized. The night session traded in a 67,630–68,840 range and did not reach 70,500.
- ② Dip-buying (long): Not materialized. The dip zones (69,480–68,800 / 68,400–68,170) were breached to the downside, with a full liquidation at 68,170 and a drop to 67,630—dip buying did not work (④ downward breakout is the main path).
- ③ Rebound selling (short): Not materialized (rebound zone not reached). The night session did not rally to 69,970–70,280, but the downside continued to around 68,400 (goal) with a low of 67,630.
- ④ Breakout-following short: Fulfilled / became realized. Price broke 69,480 intraday to trigger, and downward movement carried into night session, breaking 68,400 (realized) and reaching 68,170, then 67,630—a downward breakout functioned as the main flow.
MTF State
- 4H: Reset / downward movement. Turning point 70,150; no swing low yet; rebound high 72,720. After 72,110, price fell to 68,170 and broke 67,630, reaching the major support band near the 4H 120 EMA. Trend shifted from down to reset. 20 EMA and 20 SMA trending downward.
- 1H: Downward movement. Turning point 69,830; no swing low; rebound high 69,900. 72,110 → 69,900 → 68,480, down to 67,630 and 68,290. All MAs pointing downward.
- 15m: Reset / rising wave. Turning point 67,700; breached swing low 68,500; rebound high 69,900. After dropping to 67,630, rebounded to 68,290. The 320 EMA (4H 20 EMA equivalent) is below.
- Consistency: On higher timeframes, 4H reset/downward wave and 1H down/declining wave indicate downward pressure is dominant, but 15m has rebounded into an upward wave reaching major supports (daily 20 EMA around 67,630–67,000). While the higher timeframe takes precedence, selling rallies remains the base; however, if a strong rebound is confirmed at supports, dip buying is also viable. Until 70,150 (4H turning point) and 69,830 (1H turning point) recover, price is within a rebound range; a break below 67,630 suggests continued decline.
Key Prices
- 72,720 JPY: 4H rebound high. Upper bound of 4H downside move.
- 70,150 JPY: 4H turning price.
- 69,900 JPY: 1H/15m rebound high. Upper bound of rebound. Zone 2 upper limit for rebound selling.
- 69,830 JPY: 1H turning price. Realization of breakout-following long (1H upward regression).
- 69,730 JPY: old rebound high. Lower bound of rebound zone 2.
- 68,840 JPY: old swing low (now high due to rebound). Trigger for breakout-following long and upper bound of rebound zone 1.
- 68,500 JPY: old swing low (breached → resistance) + 4H 120 EMA (daily 20 EMA equivalent). Lower bound of rebound zone 1.
- 68,290 JPY: current price / night close.
- 67,700 JPY: 15m turning point. Upper bound of Zone 1.
- 67,630 JPY: most recent swing low. Lower bound of Zone 1; trigger for ④.
- 67,000 JPY: psychological level / downside target. Zone 2 of 2 and 3/4 T1.
- 66,000 JPY: downside target.
- 65,000 JPY: downside target.
- 62,350 JPY: 4H/daily structural low. Most important on the downside.
Trade Ideas
① Breakout-following long
- Trigger: Break above 68,840 (old swing low / rebound high) on a 15m close (rebound intensifies).
- Pre-entry: After breakout, pullbacks toward breakout price vicinity or near a tilted 20MA on 1m/5m charts to time the wave turn (back-entry, breakout price as reference).
- Realization condition: 69,830 (1H turning point) recovers on a 1H close (upward regression of the 1H down wave).
- Stop loss / invalidation: first leg fails if 68,390 breaks; real entry fails if 67,630 breaks.
- Targets: 69,730 (partial take + break-even), 69,900.
- RR: T1 69,730 = 2.0 / T2 69,900 = 2.4.
- Note: Since 1H down and 4H down waves are present, this is a counter-trend rebound. Until 69,830 recovers, expect rebound range; 69,730 and 69,900 act as staged resistance. Focus on the real-entry move.
- MFE protection: exit at +200 or +300 for trailing with at least +100; protect early due to counter-trend nature.
② Dip-buying (long)
- Standard condition: shallow zone 1 67,700–67,630 (15m turning point to recent low) or deep zone 2 around 67,000 (psych level) and confirm rebound on a 15m close.
- Pre-entry: shallow dip target 67,750 (LC 67,430), deep dip target 67,050 (LC 66,730). Given 1H down and 4H down, it is a counter-trend buy; confirm rebound only at strong supports like 4H 120 EMA around 68,500, 67,630, 67,000, etc., using 20 MA vicinity as confirmation of rise.
- Realization condition: 68,490 recovers on a 1H close.
- Stop loss / invalidation: first leg breaks 67,430 (deep dip) and real entry breaks 66,700. Full exit if 66,700 breaks (67,000 is clearly broken; strategy ④ remains the main flow).
- Targets: 68,840 (partial take + break-even), 69,730.
- RR: T1 68,840 = 3.4 / T2 69,730 = 6.2.
- MFE protection: exit at +200 for break-even or small profit, +300 for at least +100 or trailing. Do not chase too deeply due to downside nature; protect early as it is a counter-trend play.
③ Rebound selling (short)
- Standard condition: Rebound Zone 1 for 68,490–68,840 (old swing low area that turned into resistance) and confirm stall on a 15m close. For deeper rebounds, use 69,730–69,900 (old rebound high / 1H rebound high) as Zone 2.
- Pre-entry: Rebound stall confirmed by 15m close (leading cue around 68,540). Since 1H down and 4H down, follow the trend with the rebound selling direction.
- Realization condition: Break below 67,700 on a 1H close (downward continuation).
- Stop loss / invalidation: leading leg recovers above 68,890; the real leg recovers above 69,830. Strong invalidation at 69,830 (1H turning point recovery) returns to ① path.
- Targets: 67,630 (partial take + break-even), 67,000 / 66,000.
- RR: T1 67,630 = 2.6 / T2 67,000 = 4.4.
- Note: Below 67,630, the major support zone (daily 20 EMA around 67,000) looms; with 4H reset, avoid deep chasing. Do not press under 20MA; if trigger is confirmed and T1 reached, consider pausing.
- MFE protection: exit at +200 for break-even or small profit, +300 for at least +100 or trailing.
④ Breakout-following (short)
- Trigger: Break below 67,630 (recent low / 15m turning point 67,700) on a 15m close (downward continuation).
- Pre-entry: After the break, pullbacks toward breakout price vicinity or toward a tilted 20MA on short timeframes (1m, 5m, etc.) to time wave turns (back-entry, breakout price reference).
- Realization condition: Break below 67,000 (psych level) on a 1H close (further downside continuation).
- Stop loss / invalidation: leading leg recovers above 67,960; real leg recovers above 68,490. Full exit at 68,840.
- Targets: 67,000 (partial take + break-even), 66,000 / 65,000.
- RR: T1 67,000 = 1.9 / T2 66,000 = 4.9.
- Note: Below 67,630, major supports such as daily 20 EMA around 67,000, 65,000, etc., are gradually present. With 4H reset, be cautious of rapid reversals and traps near major supports; confirm a clear close below before triggering.
- MFE protection: exit at +200 for break-even or small profit, +300 for at least +100 or trailing.
Current Actions
- Most important Line 1: 68,490–68,840 JPY (old swing low area that has turned into resistance). If this stalls, sell rallies (1H downtrend in order). A deeper pullback will stall around 69,730–69,900.
- Most important Line 2: 67,630 JPY (recent low / branching for continued decline) / 67,000 JPY (psych level). If 67,630 breaks on a 15m close, downside continues toward 67,000 and 66,000. If a rebound is confirmed at supports 67,700–67,630 and 67,000, consider dip buying (contrarian); a breakout above 68,840 would intensify the rebound and enable breakout-following long.
- Market outlook: In a 1H down / 4H reset (downward movement), downward pressure remains dominant, but price reaches major supports near the 4H 120 EMA (daily 20 EMA equivalent) and 15m begins to rebound. Maintain a bias toward selling rallies, but also consider dip buying on strong rebound near supports. Until 69,830 (1H turning point) recovers, keep upside within rebound territory; avoid overextending on both sides near major supports.
Entry prices, triggers, and stop losses are set based on the chart shapes at close time (turning prices and swing lows/highs of each timeframe). If the structure changes over time and there is no change in the higher-timeframe structure, entries should be adjusted using the lower-timeframe turning prices (e.g., when a short-term lower-timeframe moves into a down wave and then turns up) to align with actual conditions, adopting the option that best fits the real situation.
Note: This report is intended to provide information and is not investment advice. Please make your own investment decisions at your own risk.