
NK225 Futures MTF Dow Theory 4-Scenario Analysis Report 2026-07-02 (for daytime session)
NK225 Futures MTF Dow Theory Analysis Report
Date and Time: July 2, 2026 06:03 JST / Night Session
Current Price: 69,610 JPY
Subject: For the Day Session (7/2)
Conclusion
On 7/1, price retraced to 72,110 then stalled and declined, falling to 69,550 toward the night session and closing at 69,610. 72,110 is a retracement high that failed to exceed 72,720 (4H downtrend upper high), marking a shift from the previous uptrend to a downtrend in the 4H, and the 1H and 15m also turned downward, aligning all timeframes downward. During the day, selling on rallies was favored, with rallies stalling at 69,970–70,280 (shallow pullback) and 70,500–71,090 (deep pullback).
A rally selling setup would occur if 69,970–70,280 and 70,500–71,090 pullbacks stall; if 69,480 is broken on a 15m close, downward momentum continues (toward 68,800 and 68,170). A recovery above 70,500 (1H turning point) would be the first sign of a bullish retracement within the 1H downtrend turning up, i.e., a breakout-following long. Since all timeframes are in a downtrend, pullback buying and breakout-following longs are treated as counter-trend trades and should be limited to strong support levels such as 68,170 (a key low) and similar levels, avoiding chasing.
4H Analysis
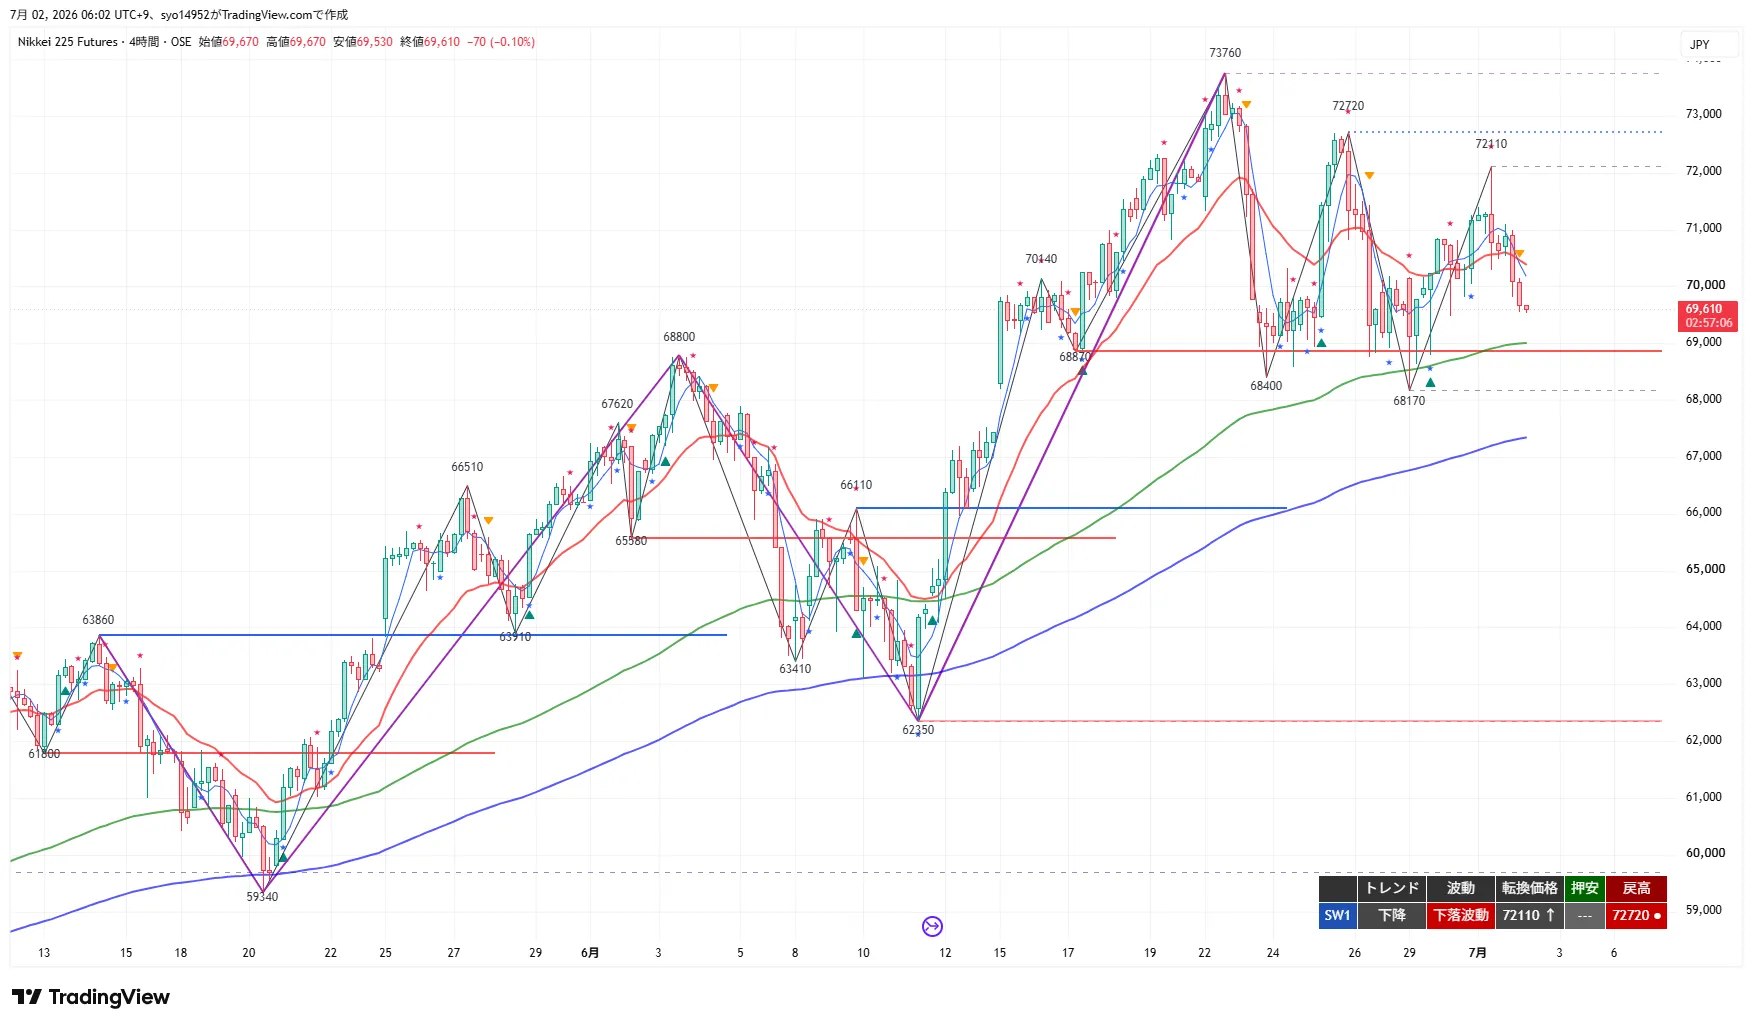
The 4H is in a downtrend and declining moves. Turning point at 72,110, no established swing low, retracement high at 72,720. The sequence 73,760 → 72,720 → 72,110 shows the retrace highs stepping lower, with the most recent stall at 72,110 (72,720 not yet updated) followed by a decline to 69,610. The previous rise has turned into a downtrend. The 20EMA and 20SMA are moving downward, with price below them, approaching the 120EMA (roughly the 20EMA of the daily, near 69,000).
The sequence of lower retracement highs continues to dominate, with resistance at 70,500, 71,090, 72,110, and 72,720. A close above 72,110 is needed to consider the breakdown of the 4H downtrend. Support levels are 69,000 (120EMA) and 68,170 (recent low); breaking these would accelerate the decline toward 66,110 and 62,350.
1H Analysis
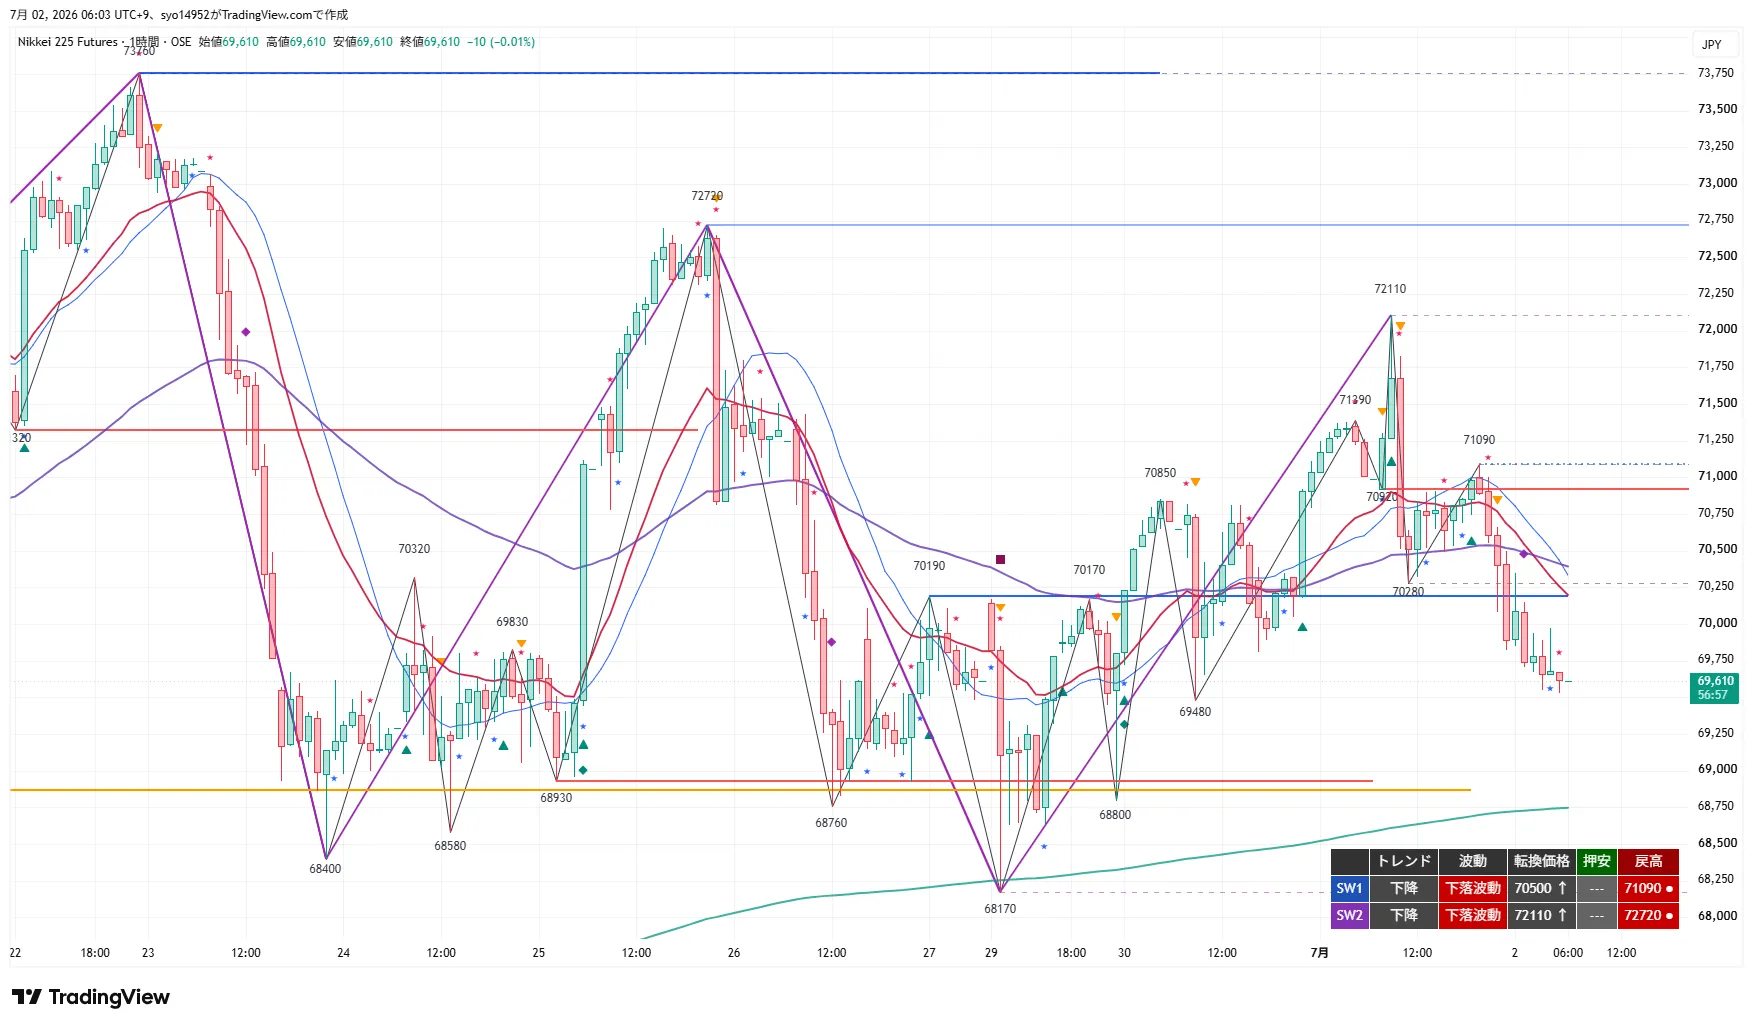
The 1H is in a downtrend and decline. Turning point at 70,500, no established swing low, retrace high at 71,090 (SW1). A larger wave (SW2) is a downtrend with turning point at 72,110 and retrace high at 72,720. From 71,090’s pullback, price fell to 69,610. The 20EMA and 80EMA are downward, with price beneath them.
Pullbacks run from 69,970–70,280, with deeper retracements stalling around 70,500–71,090. If 69,480 is breached on a 1H close, those declines continue toward 68,800 and 68,170. A recovery above 70,500 on a 1H close would be the first sign of a retracing up in the downtrend.
15m Analysis
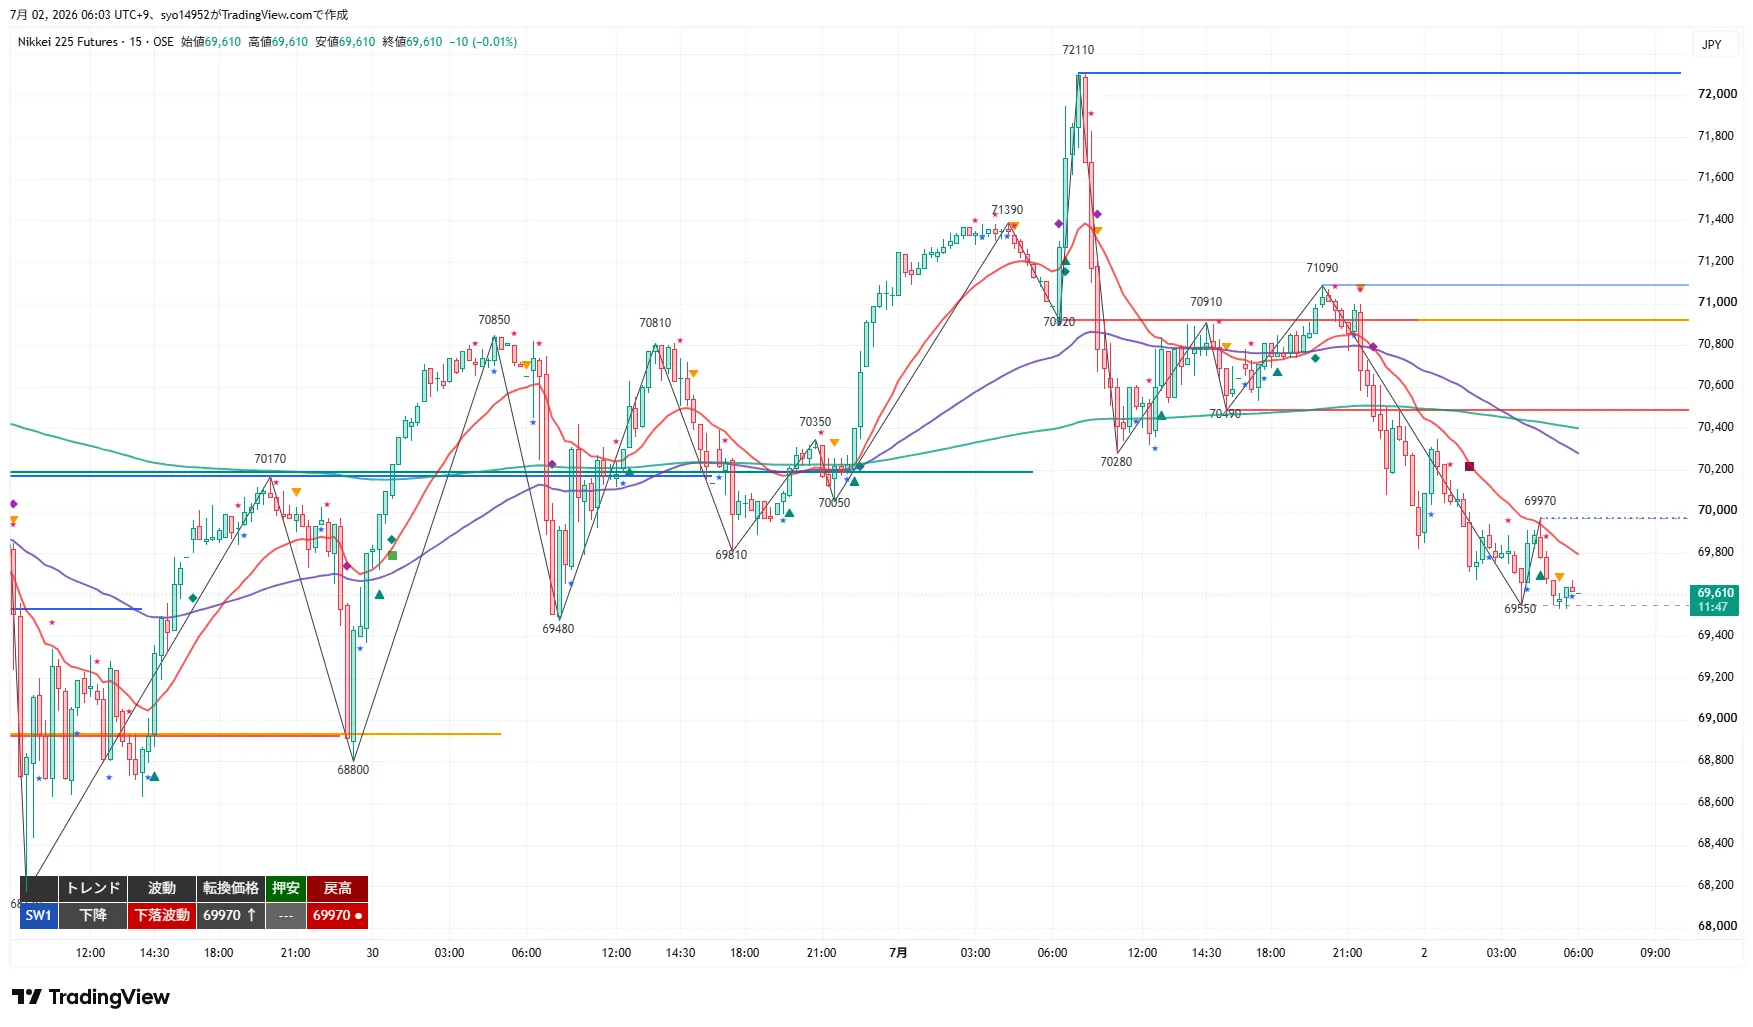
The 15m is in a downtrend and decline. Turning point at 69,970, no established swing low, retrace high at 69,970. From the 72,110 high, the price declined to 69,550, then retraced to 69,970 and briefly rebounded to 69,610. The 20EMA and 80EMA (roughly the 1H 20EMA) are downward, with the 320EMA (4H 20EMA equivalent near 70,400) below it.
If the 15m close breaks above 69,970, the near-term downtrend eases; a break below 69,550–69,480 will continue the decline toward 68,800 and 68,170. The pullback rally is viewed as a selling opportunity; with the 20EMA downward, early long entries should be avoided.
MTF State
- 4H: Downward / declining moves. Turning 72,110; no swing low formed; retracement high 72,720. Pullback highs step down from 73,760 → 72,720 → 72,110, stalling at 72,110 and turning down. From the previous upmove to the downmove. 20EMA and 20SMA downward; approaching the 120EMA (daily's 20EMA equivalent near 69,000).
- 1H: Downward / declining moves. Turning 70,500; retracement high 71,090 (SW1) / Turning 72,110; retracement high 72,720 (SW2). Decline from 71,090’s pullback. All MAs downward.
- 15m: Downward / declining moves. Turning 69,970; no swing low formed; retracement high 69,970. Decline from 72,110 to 69,550, then a rebound to 69,970 and a slight dip to 69,610. 320EMA (4H 20EMA equivalent) is below.
- Consistency: All four timeframes (4H, 1H, 15m) are in downward/downtrend phases with a unified direction downward. The higher timeframes take precedence; the basic stance is to sell on rallies. A breakdown is not expected until 72,110 (4H/1H SW2 turn) is closed above, and until 70,500 (1H turning point) is recovered to consider a return move. Pullback buying is a counter-trend action in a downtrend across all timeframes and should be limited to strong supports such as 68,170 (important low) to confirm a rebound.
Important Prices
- 73,760 JPY: 4H / daily timeframe retracement high and recent high. Final upside target.
- 72,720 JPY: 4H retracement high. Upper boundary of 4H downtrend.
- 72,110 JPY: 4H/1H (SW2) turning point and recent high (7/1 high). A close above could test the breakdown of the 4H downtrend.
- 71,090 JPY: 1H (SW1) retrace high / recent retrace high. Upper bound of Sell Zone 2.
- 70,500 JPY: 1H (SW1) turning price. Trigger for a breakout-following long (1H up-move retracement). Lower bound of Sell Zone 3.
- 70,280 JPY: Former swing low (1H node). Upper bound of Sell Zone 3.
- 69,970 JPY: 15m turning point / retrace high. Lower bound of Sell Zone 3.
- 69,610 JPY: Current price / Night session close.
- 69,550 JPY: Most recent low (15m).
- 69,480 JPY: Former swing low. Upper bound of Sell Zone 2 / Trigger 4.
- 69,000 JPY: 4H 120EMA (daily 20EMA equivalent). Support band on the lower side.
- 68,800 JPY: Former swing low. Lower bound of Sell Zone 2 / ③/④ T1.
- 68,400 JPY: Former corrective low. Upper bound of Sell Zone 2 / ④ core.
- 68,170 JPY: Recent important low (4H). Lower bound of Sell Zone 2 / ③/④ T2.
- 62,350 JPY: 4H / daily structure low. Most important downside.
Trade Ideas
① Breakout Following Long
- Trigger: Break above 70,500 (1H turning point) on a 15m close (1H downtrend retracement).
- Pre-entry: After break, pullback toward breakout price vicinity or toward the tilted 20MA on 1m/5m or other short timeframes to time the wave change (back-entry, breakout price basis).
- Core: Recovery above 70,500 on a 1H close.
- Stop loss / invalidation: Break below 70,050 for the prior leg; below 69,480 for the core position.
- Targets: 71,090 (partial take plus break-even) and 72,110.
- RR: T1 71,090 = 1.3 / T2 72,110 = 3.6.
- Note: In a全 TF downtrend, this is a counter-trend trade; until 70,500 is recovered, it remains within a pullback; 71,090 and 72,110 act as staged resistance. Focus on the core position.
- MFE Protection: Exit at +200 for break-even or small profit, or +300 for at least +100 or trailing. Since all TFs are down, protect early.
② Buy the Dip (Long)
- Standard: Breakout zone 1 shallow pullback in the 69,480–68,800 area, or in the deep pullback zone 2 68,400–68,170 (old corrective low to 4H important low); confirm rebound with 15m close.
- Pre-entry: Shallow pullback around 69,200 (LC 68,730), deep pullback around 68,250 (LC 68,030). Since all TFs are downward, see this as counter-trend; confirm a clear rebound only at strong supports such as 68,170 and 68,800, near the 20MA, before acting.
- Core: Recovery above 70,500 on a 1H close.
- Stop loss / invalidation: For the pre-entry, break below 68,730 (68,030 on deep pullback); for the core, break below 68,170. If fully retreating below 68,170, skip (④ remains the main path).
- Targets: 69,970 (partial take + break-even) and 70,500.
- RR: T1 69,970 = 1.6 / T2 70,500 = 2.8.
- MFE Protection: Exit at +200 for break-even or small profit, or +300 for at least +100 or trailing. Do not chase; protect early and avoid deep chasing in a downtrend across all TFs.
③ Sell the Rally (Short)
- Standard: In the rally zone 69,970–70,280 (15m turning and old swing low), observe a stall on a 15m close. If a deeper rally occurs, treat 70,500–71,090 (1H turning to 1H high) as Sell Zone 2.
- Pre-entry: Stall in the rally zone confirmed by 15m close (reference around 70,020). Since all TFs are downward, pursue the mean-reversion in the direction of the downtrend.
- Core: Break below 69,480 on a 1H close (downtrend continues).
- Stop loss / invalidation: Pre-entry recovers to 70,350; core recovers to 69,480. Full exit at 70,280.
- Targets: 68,800 (partial take + break-even) and 68,170 / 67,000.
- RR: T1 68,800 = 3.7 / T2 68,170 = 5.6.
- MFE Protection: Exit at +200 for break-even or small profit, or +300 for at least +100 or trailing. Avoid early entries below the 20MA; if the trigger is confirmed and T1 is reached, consider skipping the rest.
④ Breakout Following Short
- Trigger: Break below 69,480 (old swing low / 15m recent low 69,550) on a 15m close (downtrend continues).
- Pre-entry: After breakout, pull back toward breakout price vicinity or toward a rising tilt around the 20MA on short timeframes (1m/5m) to time the wave change (back-entry, breakout price basis).
- Core: Break below 68,400 on a 1H close (old corrective low breached = further decline).
- Stop loss / invalidation: Pre-entry recovers to 69,810; core recovers to 69,480. Full exit at 70,280.
- Targets: 68,800 (partial take + break-even) and 68,170 / 67,000.
- RR: T1 68,800 = 2.1 / T2 68,170 = 4.0.
- Notes: All TFs are downward in a downtrend, but supports at 68,800, 68,170 (important lows), and around the 4H 120EMA near 69,000 provide staged risk management; beware of a rapid rebound or a bear trap near the lows; await a clear close below to trigger.
- MFE Protection: Exit at +200 for break-even or small profit, or +300 for at least +100 or trailing. Avoid early entries below the 20MA; once a trigger foot confirms and T1 is reached, consider waiting.
Current Actions
- Most critical Line 1: 69,970–70,280 JPY (15m turning point, retrace high to old swing low). If this stalls, expect a rally-based sell (downtrend in all TFs). A deep pullback stalls near 70,500–71,090.
- Most critical Line 2: 69,480 JPY (old swing low/branching point for continued decline) / 70,500 JPY (1H turning point). If 69,480 is broken on a 15m close, expect continued decline toward 68,800 and 68,170. If 70,500 is recovered on a 1H close, consider a 1H downtrend reversal into a breakout-following long.
- Market Condition: All four TFs are in a downward/downtrend phase with all timeframes turning downward. The base approach is selling on rallies; until a close above 72,110 (4H/1H turning) is achieved, the downward move remains intact. Buy-the-dip should be limited to strong supports such as 68,170, and avoid excessive risk on both sides.
Entry price, trigger, and stop are based on the chart shape at the close; if structure changes over time, unless higher timeframes change, adjust entry prices using lower-timeframe wave-change prices (e.g., the price at which a short-term up move turns into a down move) and adopt the option that better fits the current reality.
※This report is for information purposes and not investment advice. Please make your own investment decisions at your own risk.