Dollar/Yen Forecast April 23
■ USD/JPY Daily Chart Forecast for Today
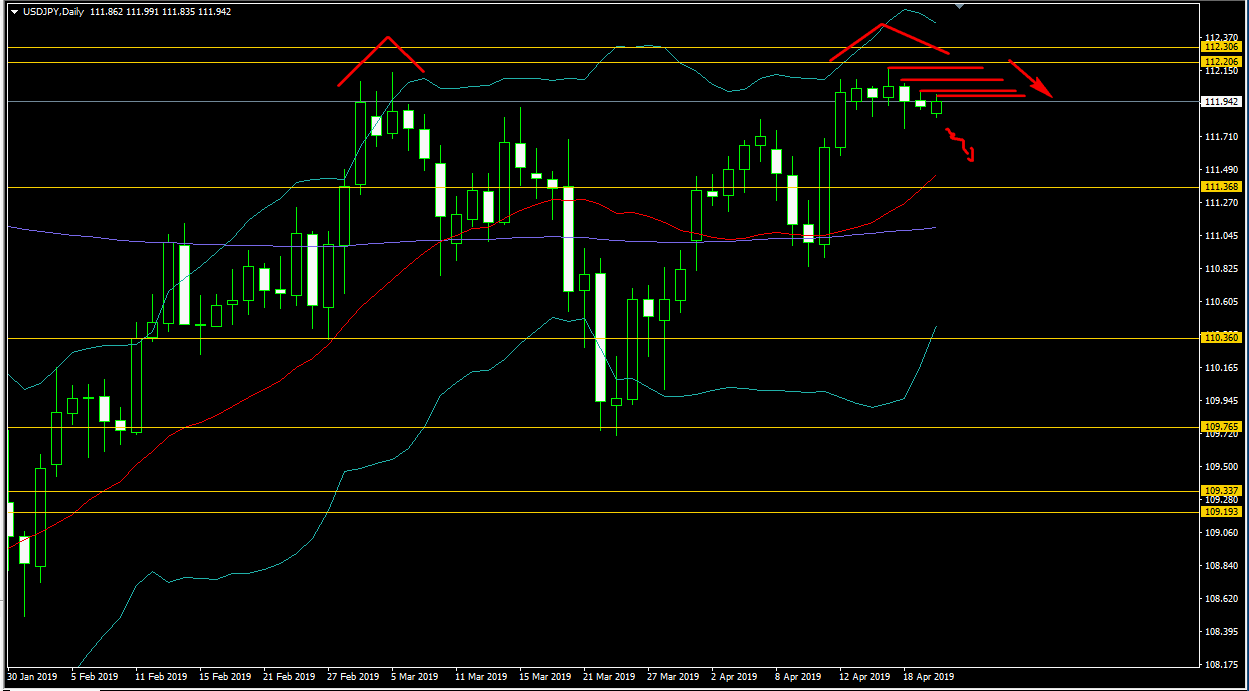
From the USD/JPY daily chart, although the candles are currently bullish, the price has formed a pattern that has been making lower highs for four consecutive bars since the latest peak, approaching a potential double top. Although institutional investors are watching, the only moving average that is said to act as a strong resistance is the purple 200-MA, and the middle band of Bollinger Bands, the red 20-MA, which are both trending upward. However, the Bollinger Bands' plus/minus 2σ are tightening, suggesting the market may remain range-bound for a while. It seems to be at a juncture where it will either gain momentum to move higher or be pushed down by a double top and transition into a downtrend.
× ![]()