【Basis】Two image-explanations of Dow Theory trend rejection & trend reversal patterns
Shirou here!

Where is the trend denial in Dow Theory?

Where is the trend reversal after the trend denial in Dow Theory?
For those who are curious, in this article we will
explain in images the trend denial and trend reversal in Dow Theory
for myself, but with explanations.
Understanding before dealing with Heaven-and-Earth indicators will help reduce trading-related anxiety.
About trend denial and trend reversal in Dow Theory
There are two patterns for trend denial and trend reversal in Dow Theory.
First is the neck-line break pattern.
In an uptrend
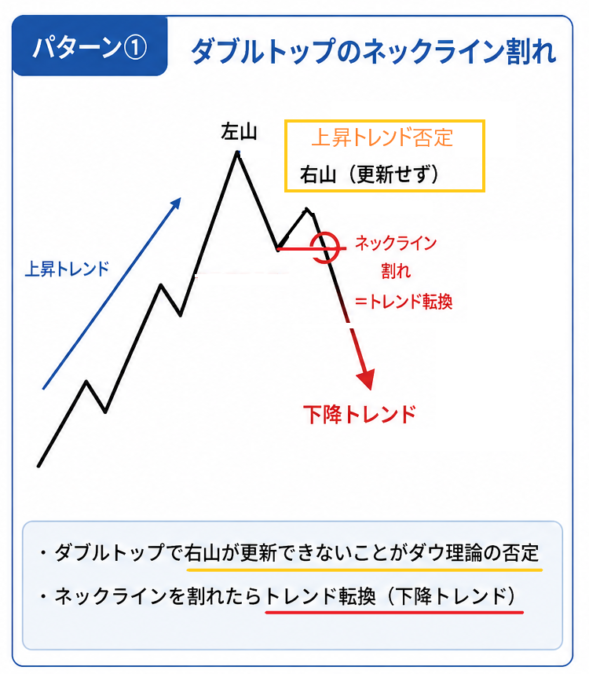
In an uptrend, if the price does not make a new high and breaks above the neck line, it becomes a trend reversal and turns into a downtrend.
- Right shoulder cannot update, trend denial
- If the neck line of the double top is broken, it becomes a trend reversal
The other pattern is simply breaking through the low price as it is.
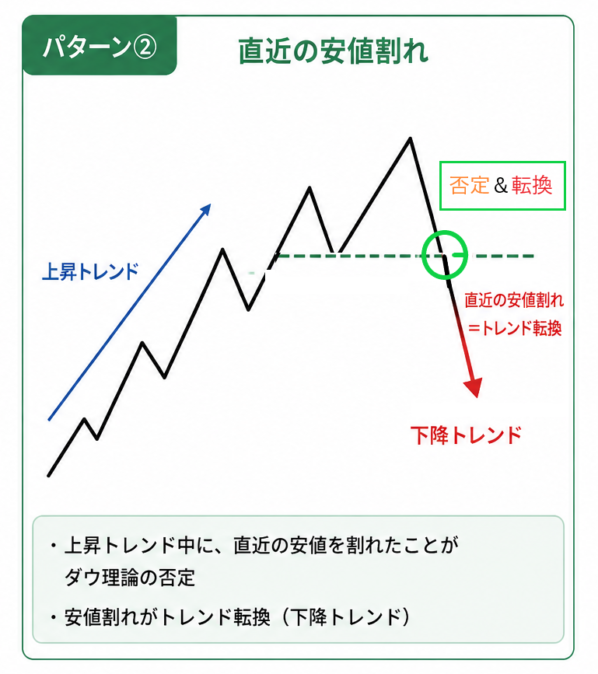
It’s a simple pattern.
In terms of how many patterns, pattern (1) is more common, while pattern (2) tends to appear more in currency pairs with larger volatility.
Notes
- Uptrend → break of the low
- Downtrend → break of the high
Let’s look at actual charts.
Pattern ① Neck-Line Break Pattern
We will look at AUDUSD on the 1-hour chart.
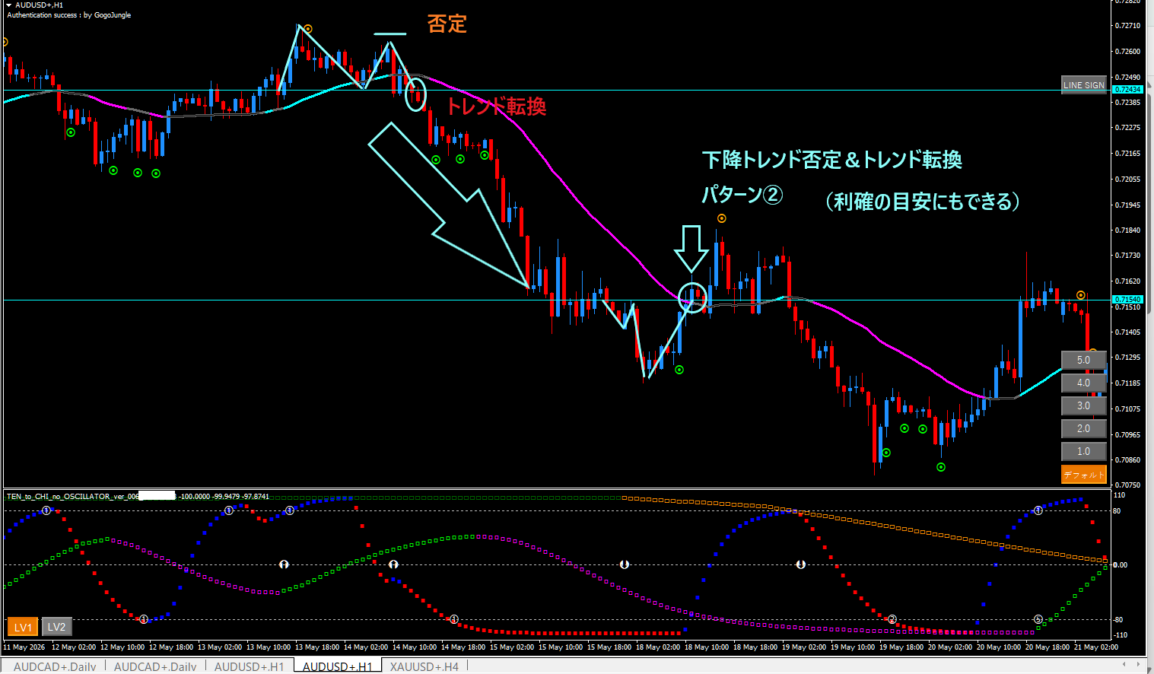
Look at the upper left.
Because the right shoulder did not update, the uptrend was denied, and afterward it fell into a downtrend by breaking the neck line.
By the way, when trading with Dow Theory, you aim for this neck line.
A downtrend requires making new highs and lows, so you can regard trend denial or trend reversal as your profit target, as shown bottom-right for example.
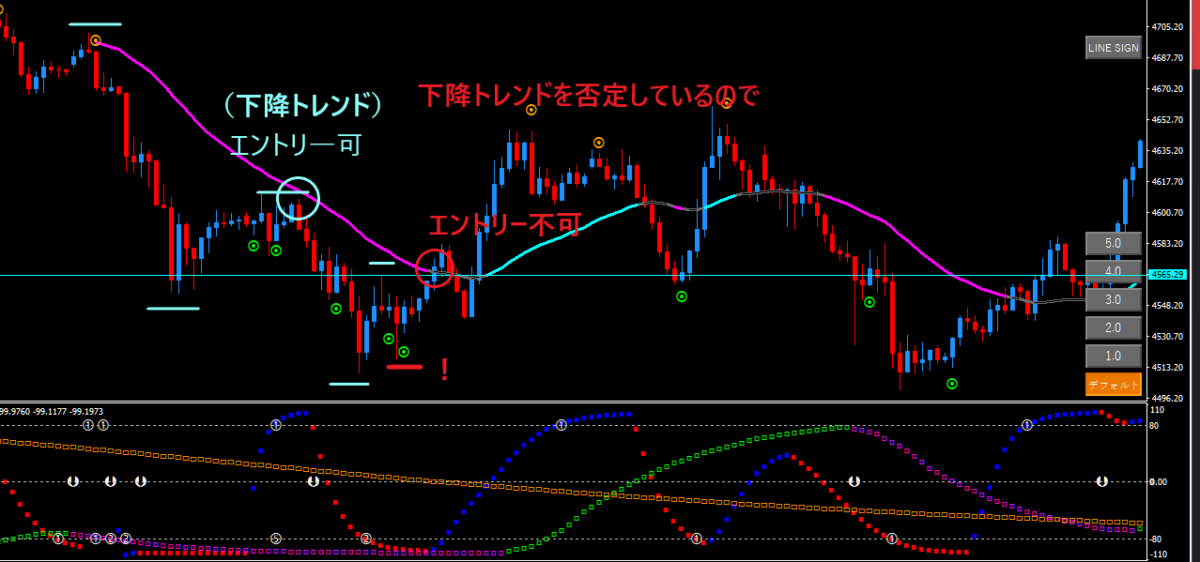
If you’re aiming with Heaven-and-Earth indicators
For Heaven-and-Earth indicators, the aim would be as follows.
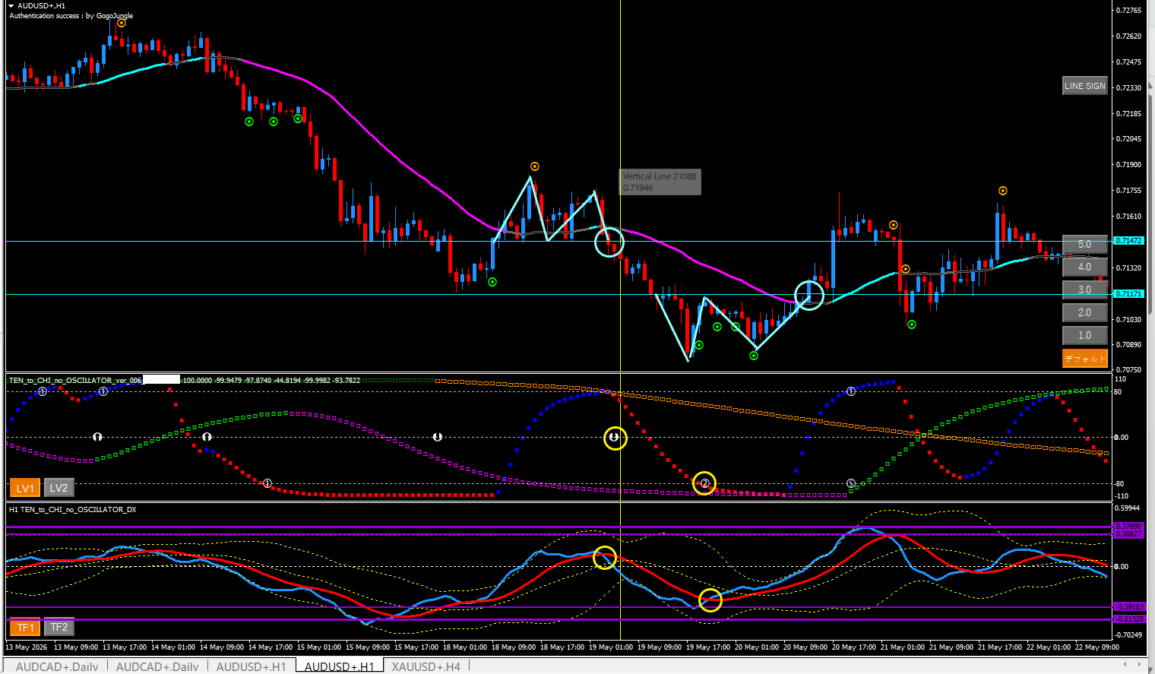
Yellow circleis the target with Heaven-and-Earth indicators.
Entries can also be made by oscillator color changes in all directions, or by a cross in Oscillator DX.
With the oscillator you can exit on pattern (②), and with Oscillator DX you can exit on an upward cross.
Thus, the entries with Heaven-and-Earth indicators are most often ideal at the moment of entry when a double top has formed, as shown in the image, and the exit tends to be favorable.
In Dow Theory,
- Enter when the neck line of the double top is exceeded
- Then when the double bottom forms and an uptrend begins, take profits
This is the judgment you can make.
Pattern ② Low-Break Pattern
In an uptrend, denial and start occur with a break of the low; in a downtrend, with a break of the high.
Gold on the 1-hour chart.
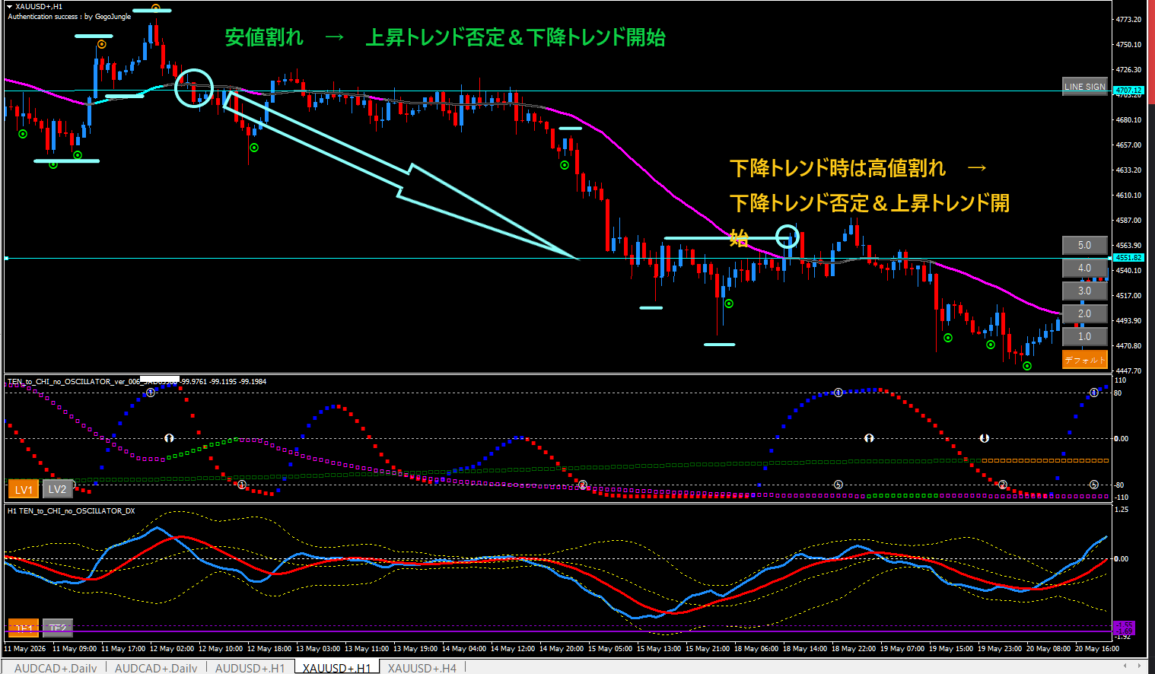
In the upper-left area, there is an uptrend, and simply the price breaks the low—Pattern ②.
This results in trend denial and trend start.
Once a downtrend has started, you can aim for profits until the uptrend begins again.
Likewise, as the downtrend breaks the high, downtrend denial and uptrend start occur.
You can take profits here.
Summary

That was an explanation of trend denial and trend start in Dow Theory.
Understanding this reduces uncertainty when entering trades with Heaven-and-Earth indicators.
For example, there is an entry called line touch, but if Dow Theory has denied the trend before the line touch, you can cut losses immediately or avoid them altogether.