
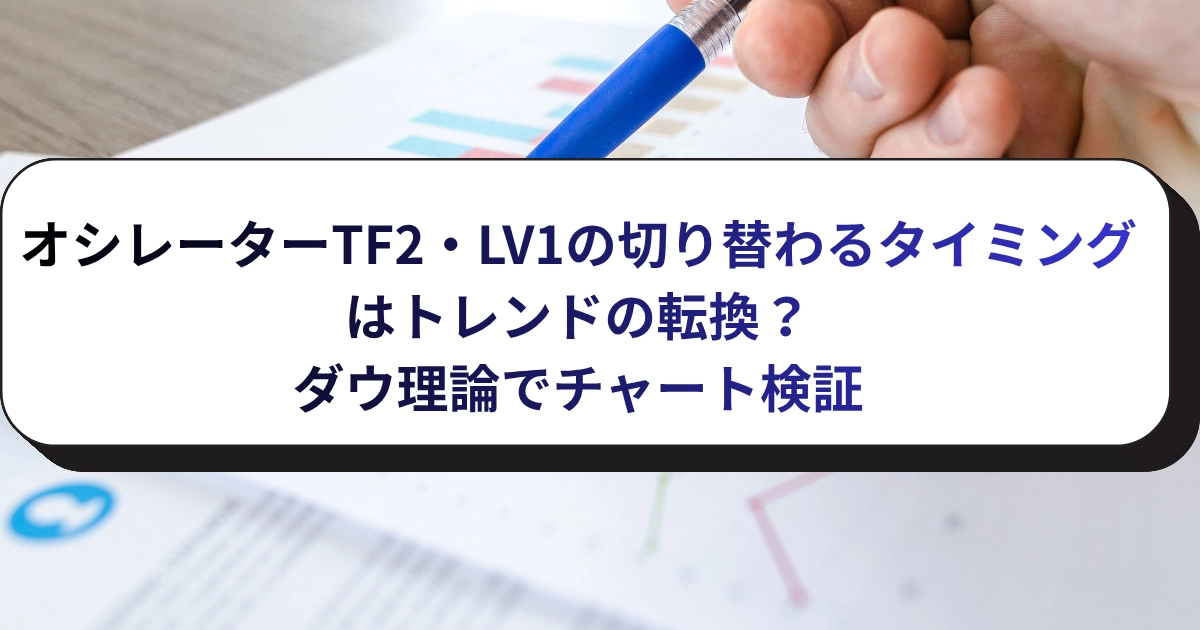
【Basis】Oscillator TF2・LV1 switching timing: Is it a trend reversal? Chart verification with Dow Theory
Shirou here!

What is the timing for the oscillator TF2 to switch?

I want to understand more about Oscillator TF2
In this article,
we examined the relationship between Oscillator TF2 (LV1) and Dow Theory
.
In the Heaven and Earth series trading, essentiallytrading in line with Oscillator TF2 is fundamental.
By reading this article,
you will understand the relationship between Oscillator TF2 and Dow Theory and be able to apply it to trading.
Dow Theory verification with Oscillator TF2 LV1
We are using the zigzag on MT4, which has a high correlation with Dow Theory.
Any currency pair would do, but for now, let's look at USD/CHF (Dollars/Swiss Franc).
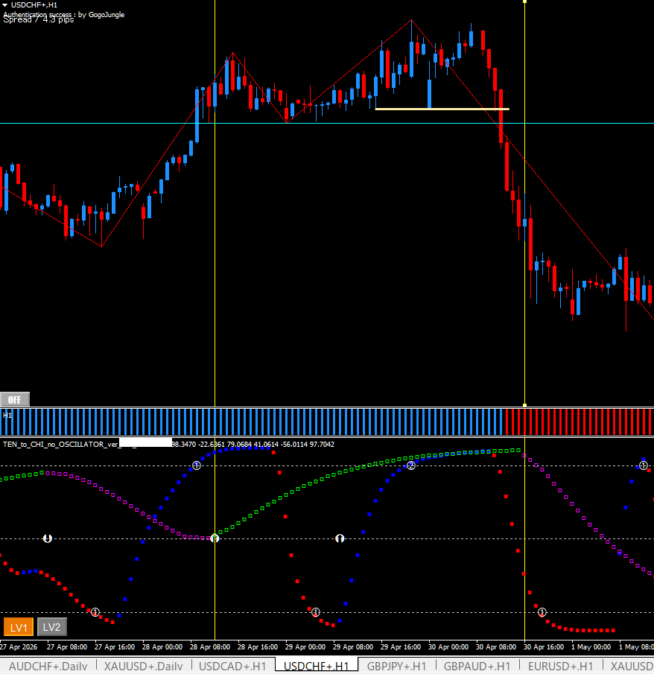
The chart looks like this.
We are testing on the 1-hour chart
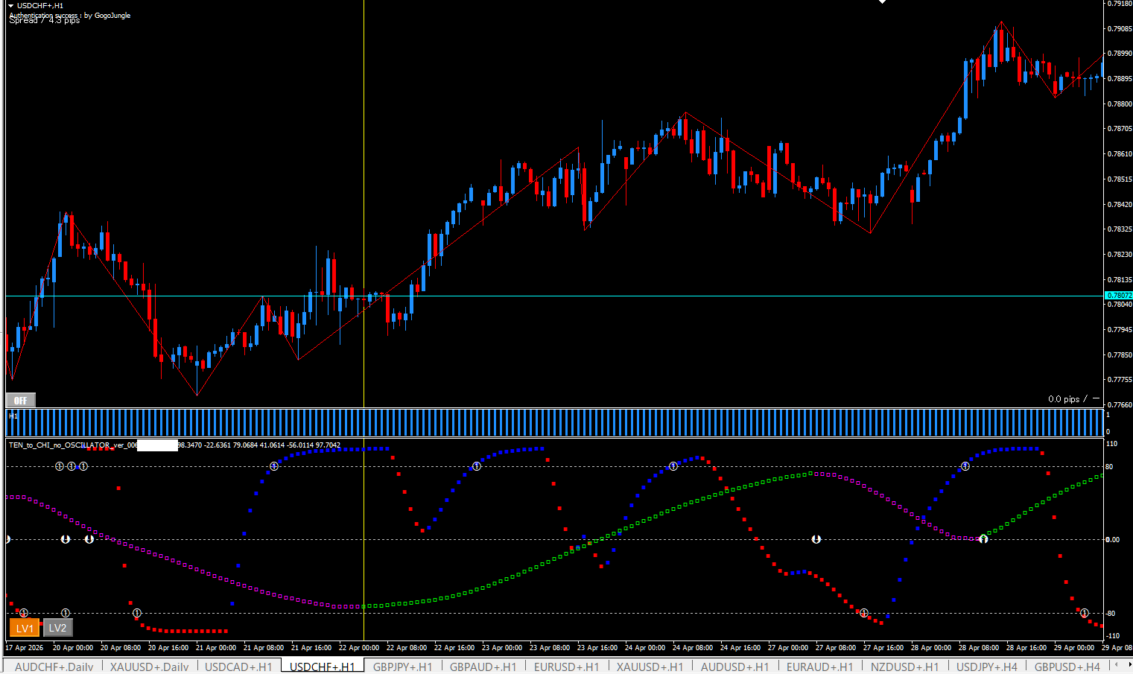
From Dow Theory, it looks like the following.
On the left, a downtrend continued. (Oscillator TF2 is purple)
However, at the point marked with a circle, the downtrend was negated, and since the neck line was breached, the trend shifted to uptrend.
At this timing it changes to green, doesn’t it?
Let’s look at the others as well.
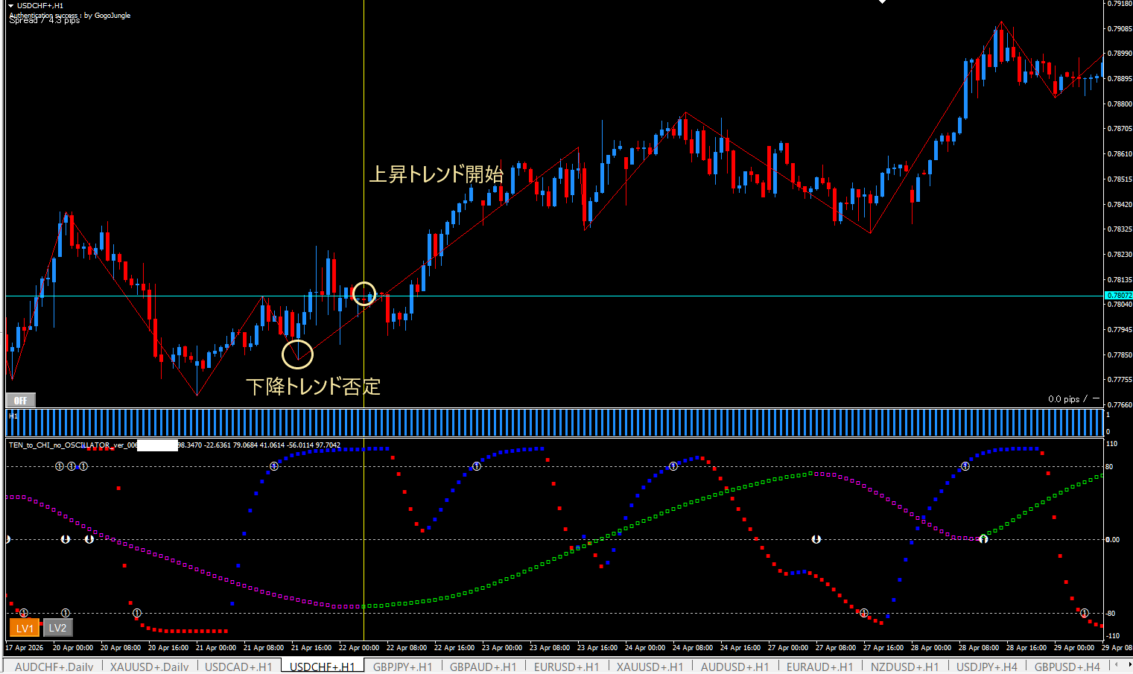
Note the middle oscillator turning green.
If you only look at the zigzag, it still looks like an uptrend. (This is because the current histogram is blue, which is interesting.)
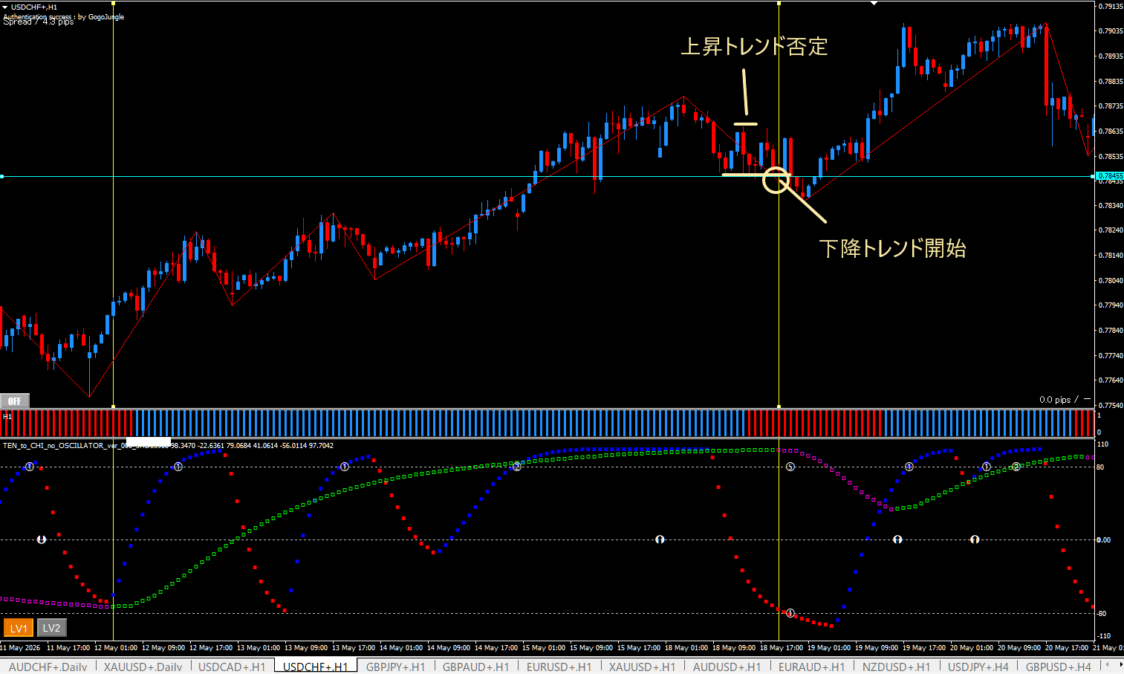
Personally, I added a short orange line that seems to correspond to a Dow Theory signal on the 1-hour chart.
It negates the uptrend and starts a downtrend
As expectedthe oscillator TF2 also turns purple at this time.
In other words,
- The trend reverses and becomes an uptrend
- Oscillator TF2 LV1 tends to switch to green
- The trend reverses and becomes a downtrend
- Oscillator TF2 LV1 tends to switch to purple
This tendency is strong, making it easier to judge the trend of higher timeframes.
By now you probably have a sense of what I want to convey, but let’s look at more.
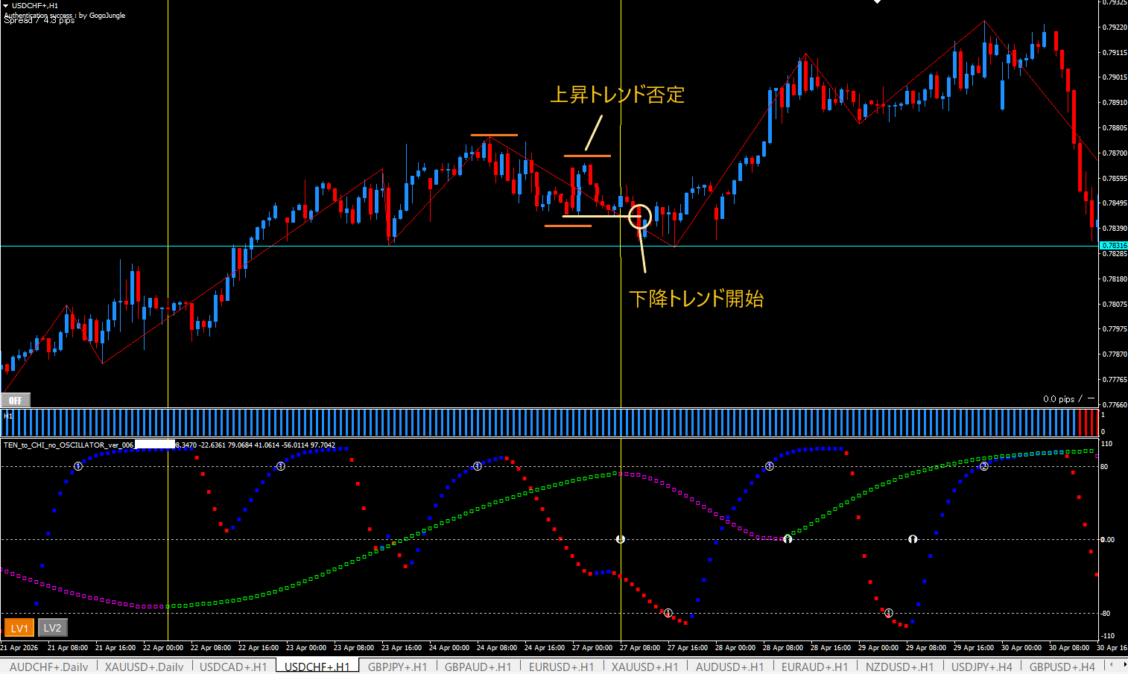
In the middle, the color changes to green midway.
If you only look at the zigzag, the uptrend is negated at the neck line and suddenly the price declines.
However, when looking more closely, I think the beige line is influential.
- A double top forms above the beige line
- The right peak is slightly smaller, so the uptrend is negated here
- Breaching the beige neck line begins a downtrend
Oscillator TF2 LV1 this time switched a bit late, but now the histogram has already turned red first.
To put it plainly, “since it turned red, don’t expect a long” is the idea.
One last page.
From the left, a clean uptrend continues.
In the zigzag, the highs and lows are being updated, respectively.
In the zigzag, it’s still an uptrend, but Oscillator TF2 has turned purple first.
If you look closely,the uptrend is negated above the beige line.
And the line below beige, the neck line. Once this is breached, a downtrend begins.
Again, at this timing, Oscillator TF2 tends to turn purple..
One caveat and summary.
[Note] Zigzag is a rough Dow Theory
The default settings for Zigzag on MT4 (12.5.3) are actuallywhen viewed in current market,a very rough flow.
The current Zigzag tends to align with the Dow Theory of the next higher timeframe’s downtrend or uptrend..
And,
Oscillator TF2 LV1 tends to mirror the next higher timeframe’s downtrend or uptrend itself.
.
Therefore, entering in line with Oscillator TF2 is well-suited for a trend-following trade.
Summary

Thus, we introduced the relationship between Oscillator TF2 LV1 and Dow Theory.
If Dow Theory feels too difficult, for now
remember only that Oscillator TF2 LV1 tends to align with the uptrend or downtrend of the next higher timeframe.
That’s sufficient to keep in mind.
This article might be challenging, but it is an important piece for Heaven and Earth users.
It might be aimed at intermediate traders.
That’s all for this article. Thank you very much!