
[Win rate 87.5%] Chart verification · Oscillator DX cross & FUTUREGCDC sign in the same direction verification, June 2026 edition
I’m Shiro!
My favorite method
Oscillator DX & FUTUREGCDC Signals in the same direction
I wasn’t able to verify this for a long time, so I’d like to test it on the most recent charts.
About the method
This time’s method ishere.
It’s a method that trades when both the Oscillator DX cross and the FUTUREGCDC cross appear at the same timing.
Even with 28 currency pairs, the average is about three entries from 8:00 to 18:00, so the number of entries is small, but the rationale is quite strong.

When monitoring on the Heaven & Earth dashboard, set it so that two signs can be displayed
The GCDC sign is overwhelmingly more common, and if alerts go off all the time you’ll get tired, so it’s easier to set alerts to trigger from the Oscillator DX cross
And if the GCDC sign is also lit on the dashboard, that’s a good sign (OK).
I’ll look at the most recent charts.
Verifying OscDX Cross & GCDC Sign on the Most Recent Chart
GCDC means Golden Cross and Dead Cross, and FUTUREGCDC means future Golden Cross or Dead Cross.
In other words, it’s basically an indicator that predicts the Oscillator DX cross.
The FUTUREGCDC parameters are set for a 1-hour chart.
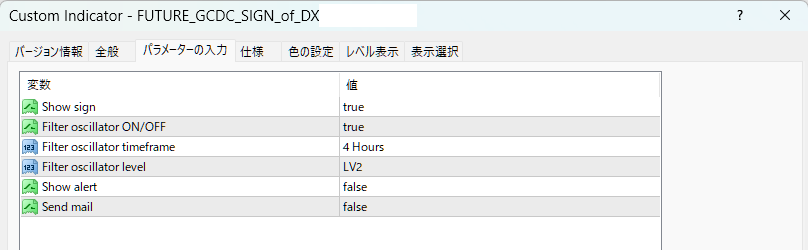
For settlements, ABUATR2 is used, and tested across 28 currency pairs.
AUDNZD ×
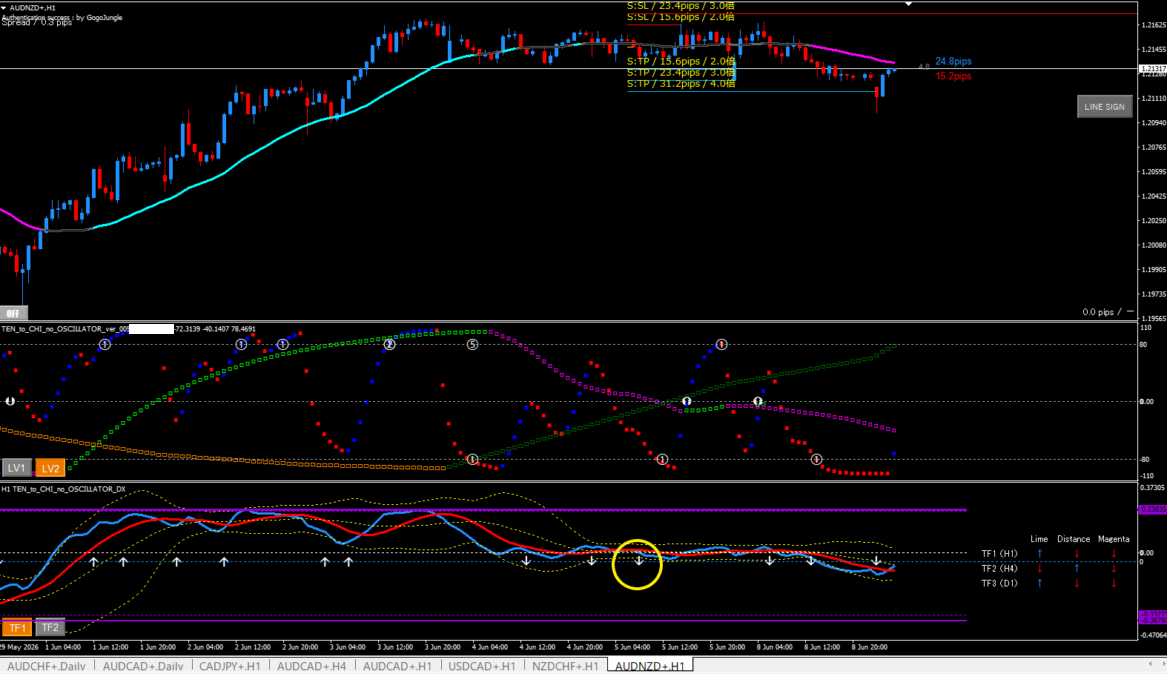
The yellow circle shows the area.
A simultaneous signal meansa cross followed by an arrow, as in the image.
This time Oscillator DX is in a range, so personally it’s a weaker signal.
CADJPY 〇 〇
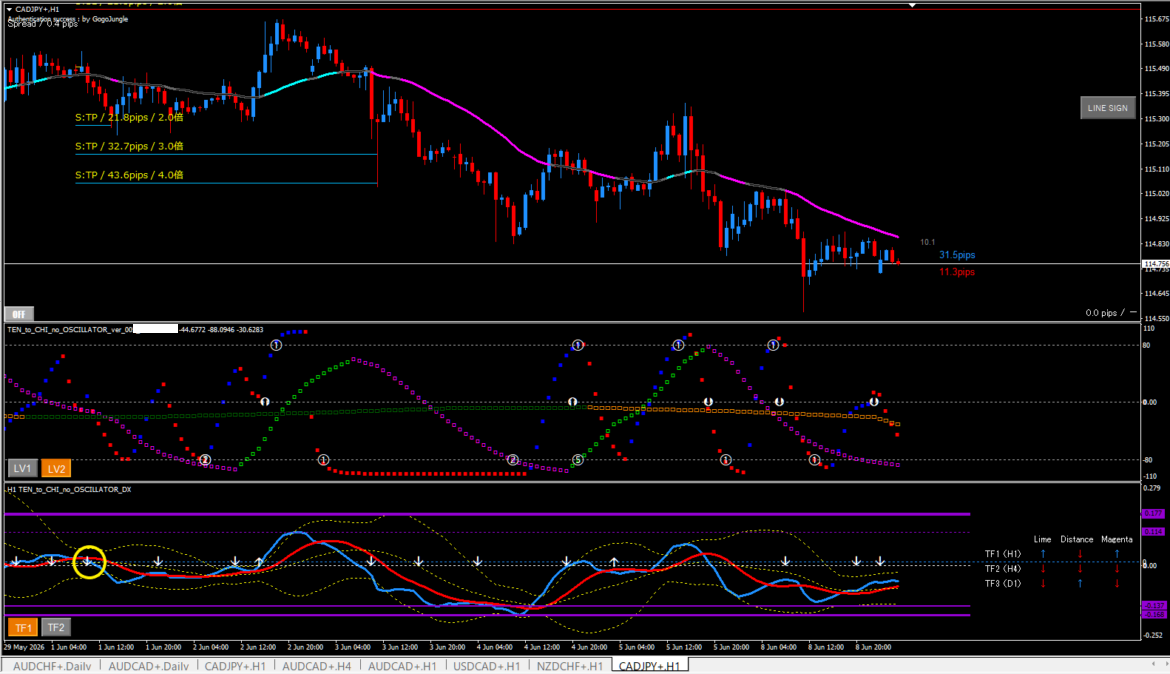
The yellow circle area shows a quite clean cross. Take profit with ABUATR2.
Another CADJPY.
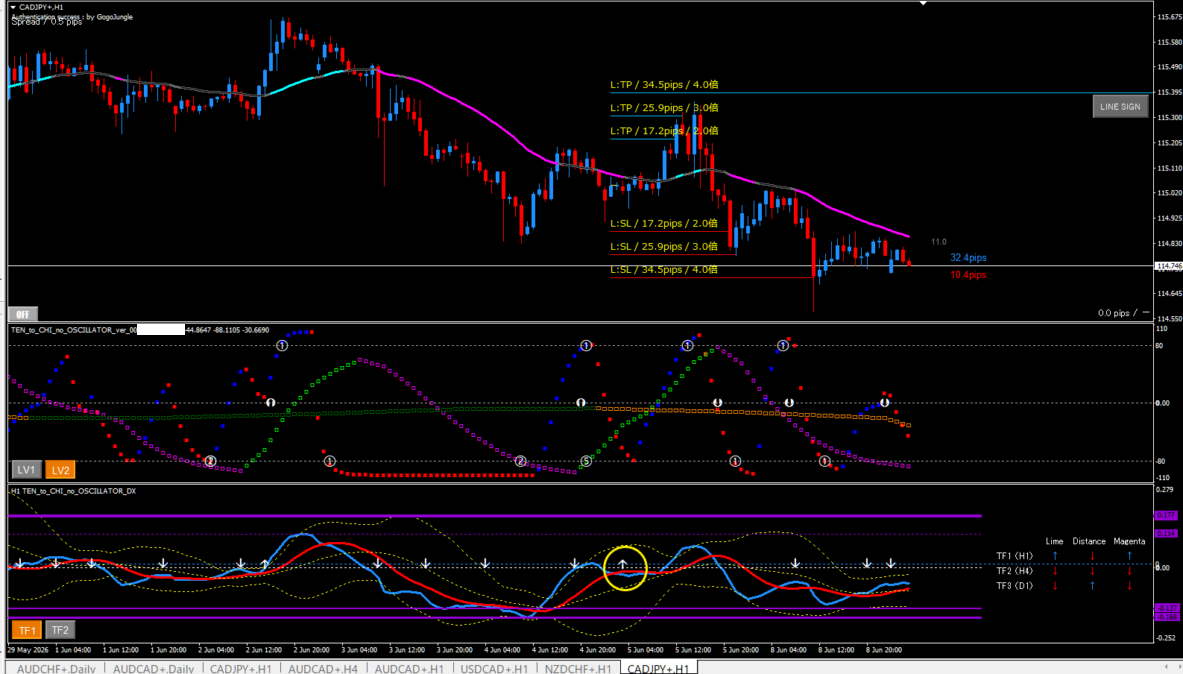
Take profit with ABUATR2 after the sign.
EURAUD Outside Example 〇
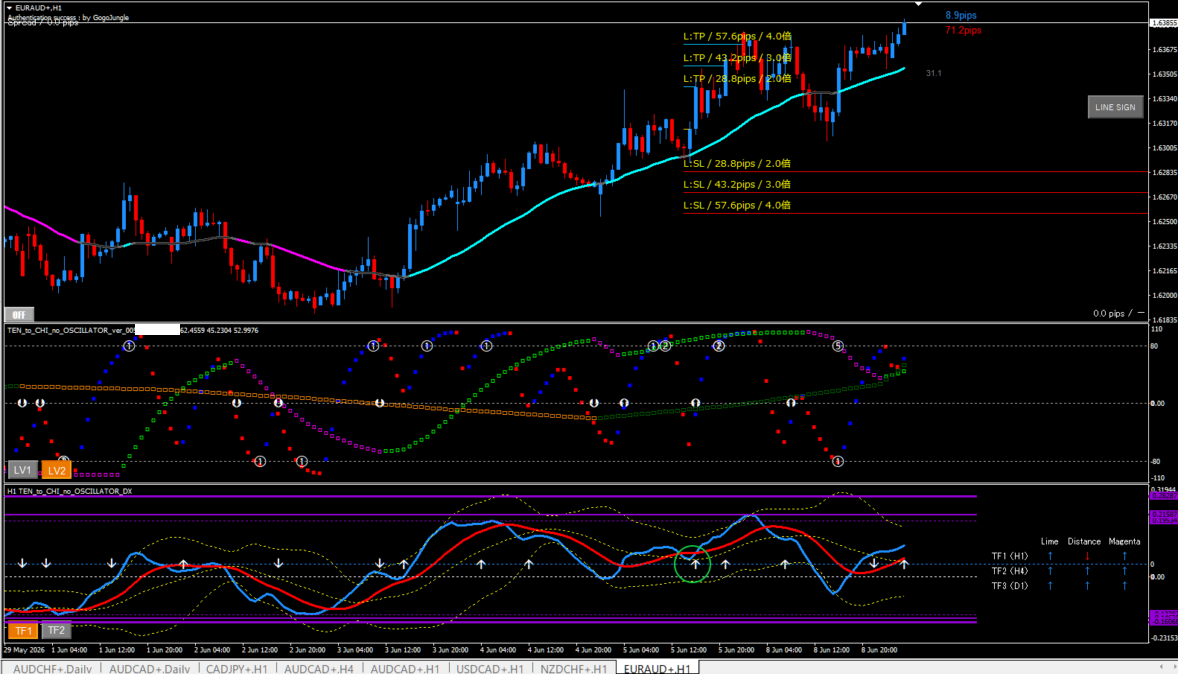
This isn’t a same-direction sign, but a pattern where an arrow appears when crossing. This is also strong.
In practice, a GCDC sign appears, then an Oscillator DX cross occurs
and it’s caught very neatly.
EURGBP 〇
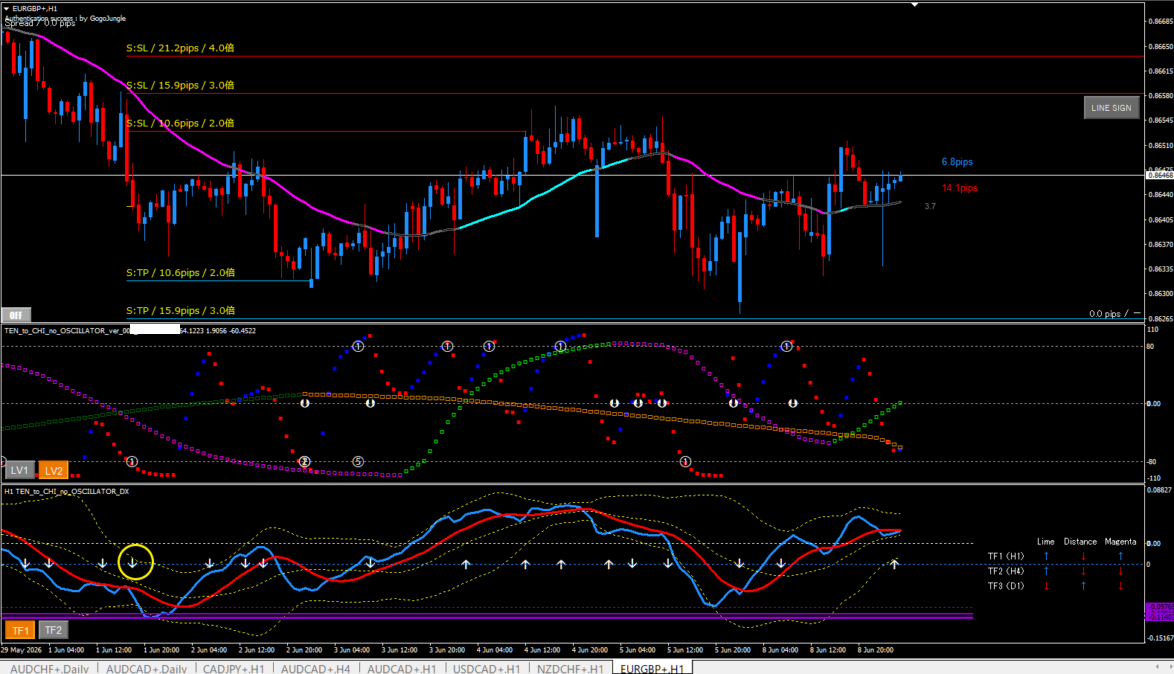
The initial yellow circle, it’s caught here too.
However, it’s too far from the Heaven and Earth line, so shorting from here is dangerous.
GBPCAD Outside Example 〇 〇
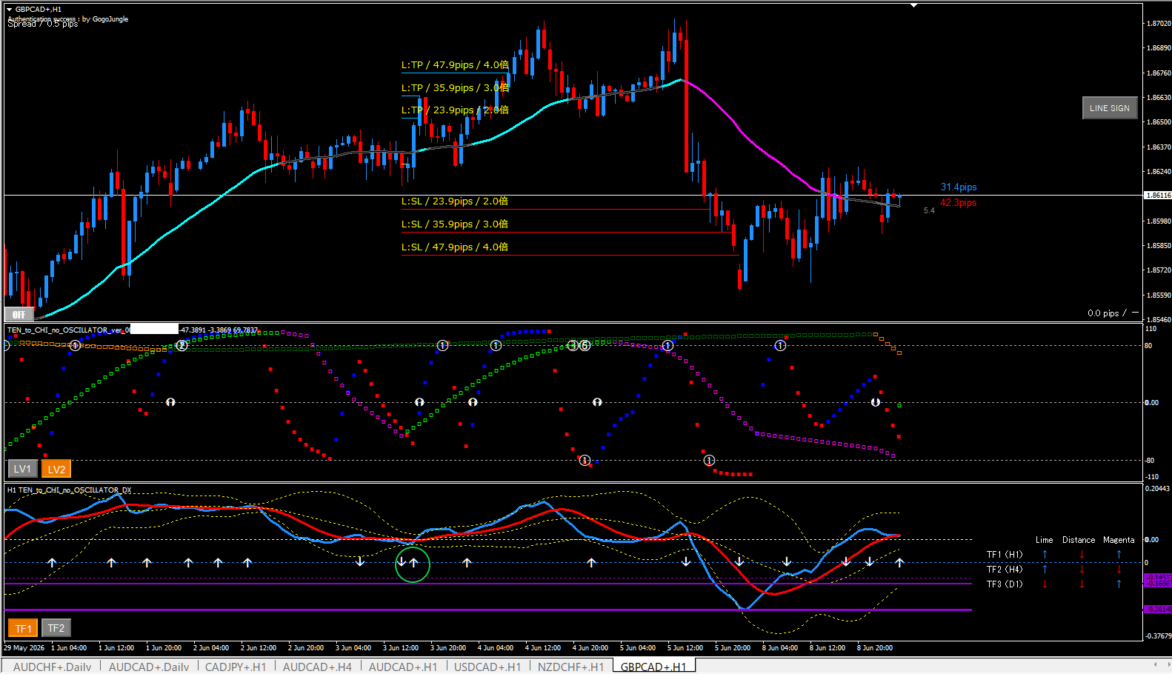
This is also an outside example, but it’s caught.
The Oscillator DX aligns with the arrows (not at the same timing).
There’s one more.
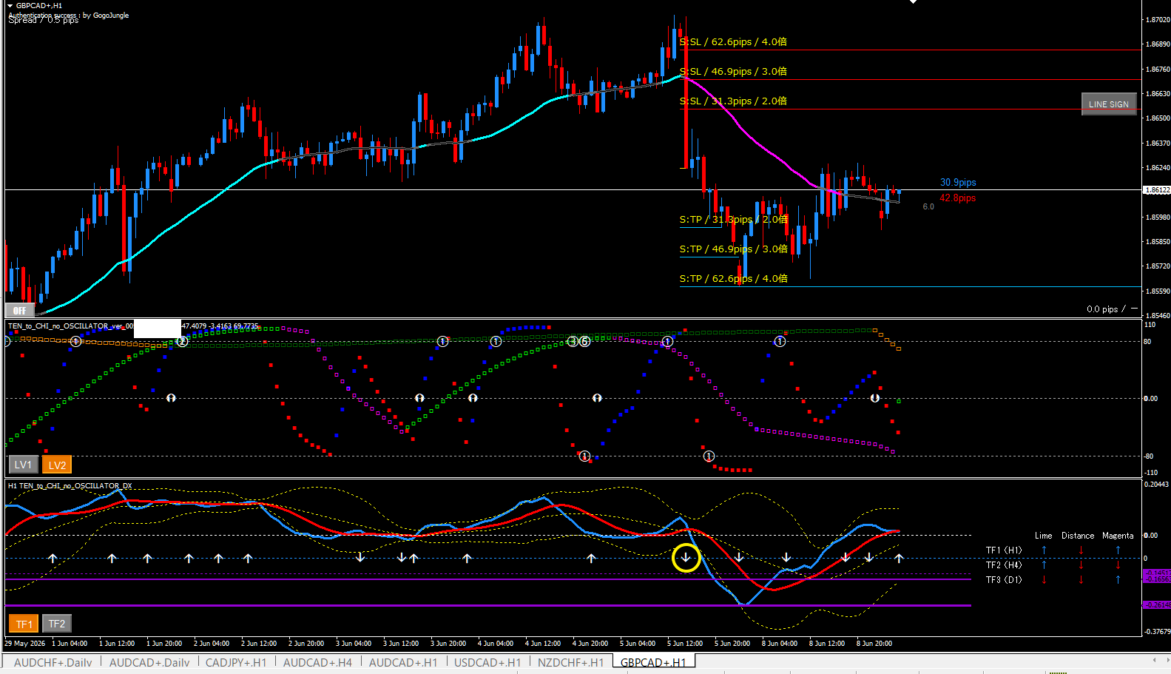
This is another outside example (arrow during cross), but it’s caught.
However, I feel resistance to short from here since I think economics data moved it.
NZDUSD Outside Example 〇 〇
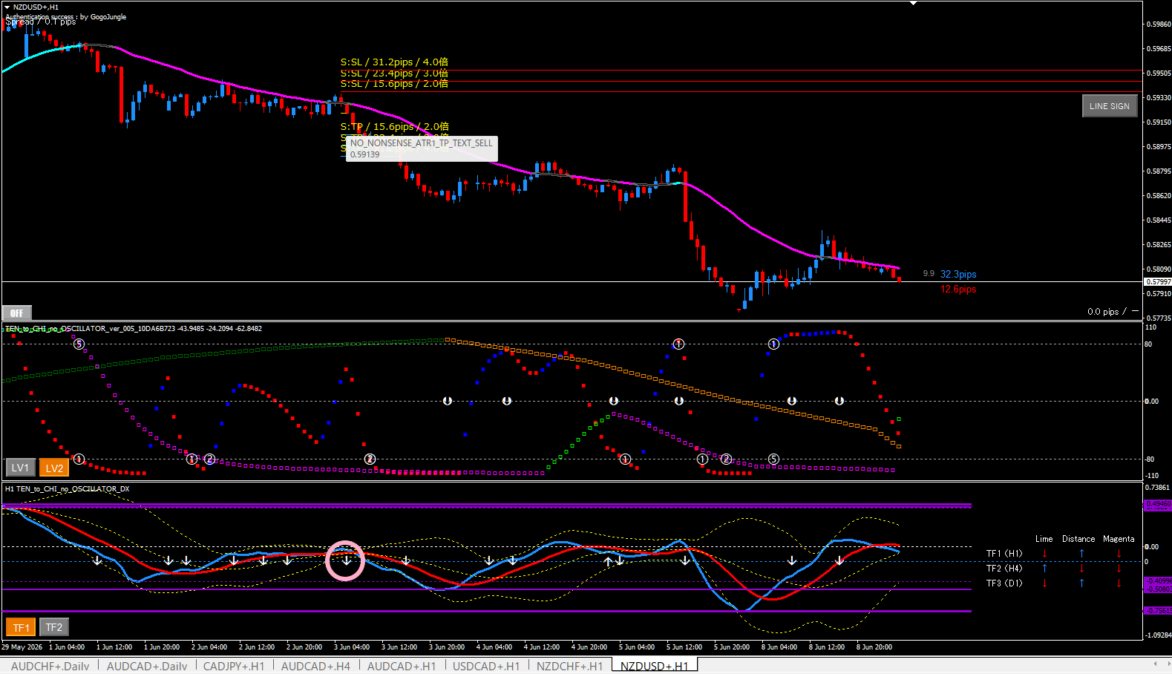
This is also an outside example.
Unlike the previous outside examples, the arrow appears before the cross.
In fact, this is the original way to use FUTUREGCDC.
FUTUREGCDC is an indicator that predicts the Oscillator DX cross
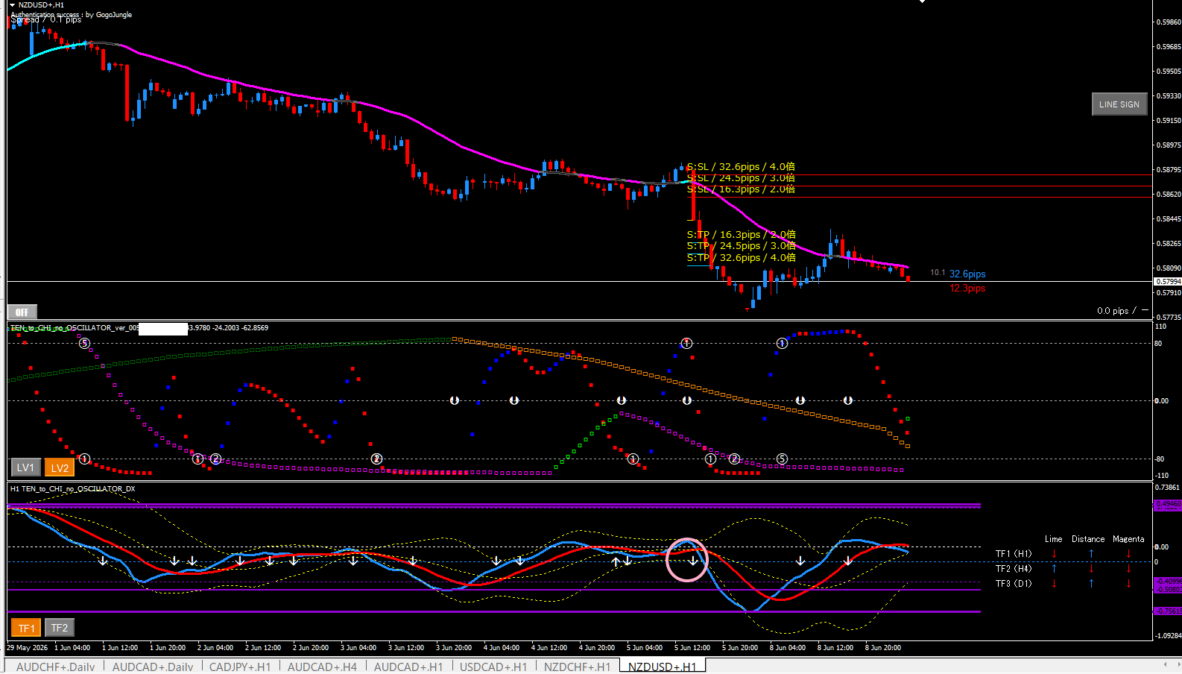
This is also an outside example, an arrow before the cross.
Summary

- Period: June 1–9
- Method: Oscillator DX Cross & FUTUREGCDC Sign (including outside examples)
- 1-hour chart trades
- 7 wins, 1 loss
- Win rate 87.5%
On charts from June 1–9, same-direction signs were not very frequent.
As with outside examples, the pattern where an arrow appears at the Oscillator DX cross is also strong, so please try it.
It’s good to set alerts to ring every time the Oscillator DX crosses on the 1-hour chart.
- Same-direction sign
- Outside example
Since you can see both, the number of entries increases and trading becomes easier.