

Virtual currency market analysis [June 30]
Today's major cryptocurrency price movements (as of 2026 year 6 month 30 date and time)
According to the latest market data (such as CoinMarketCap), the price movements of major cryptocurrencies and their day-on-day changes (24 hours ago) are as follows.
· Bitcoin (BTC)
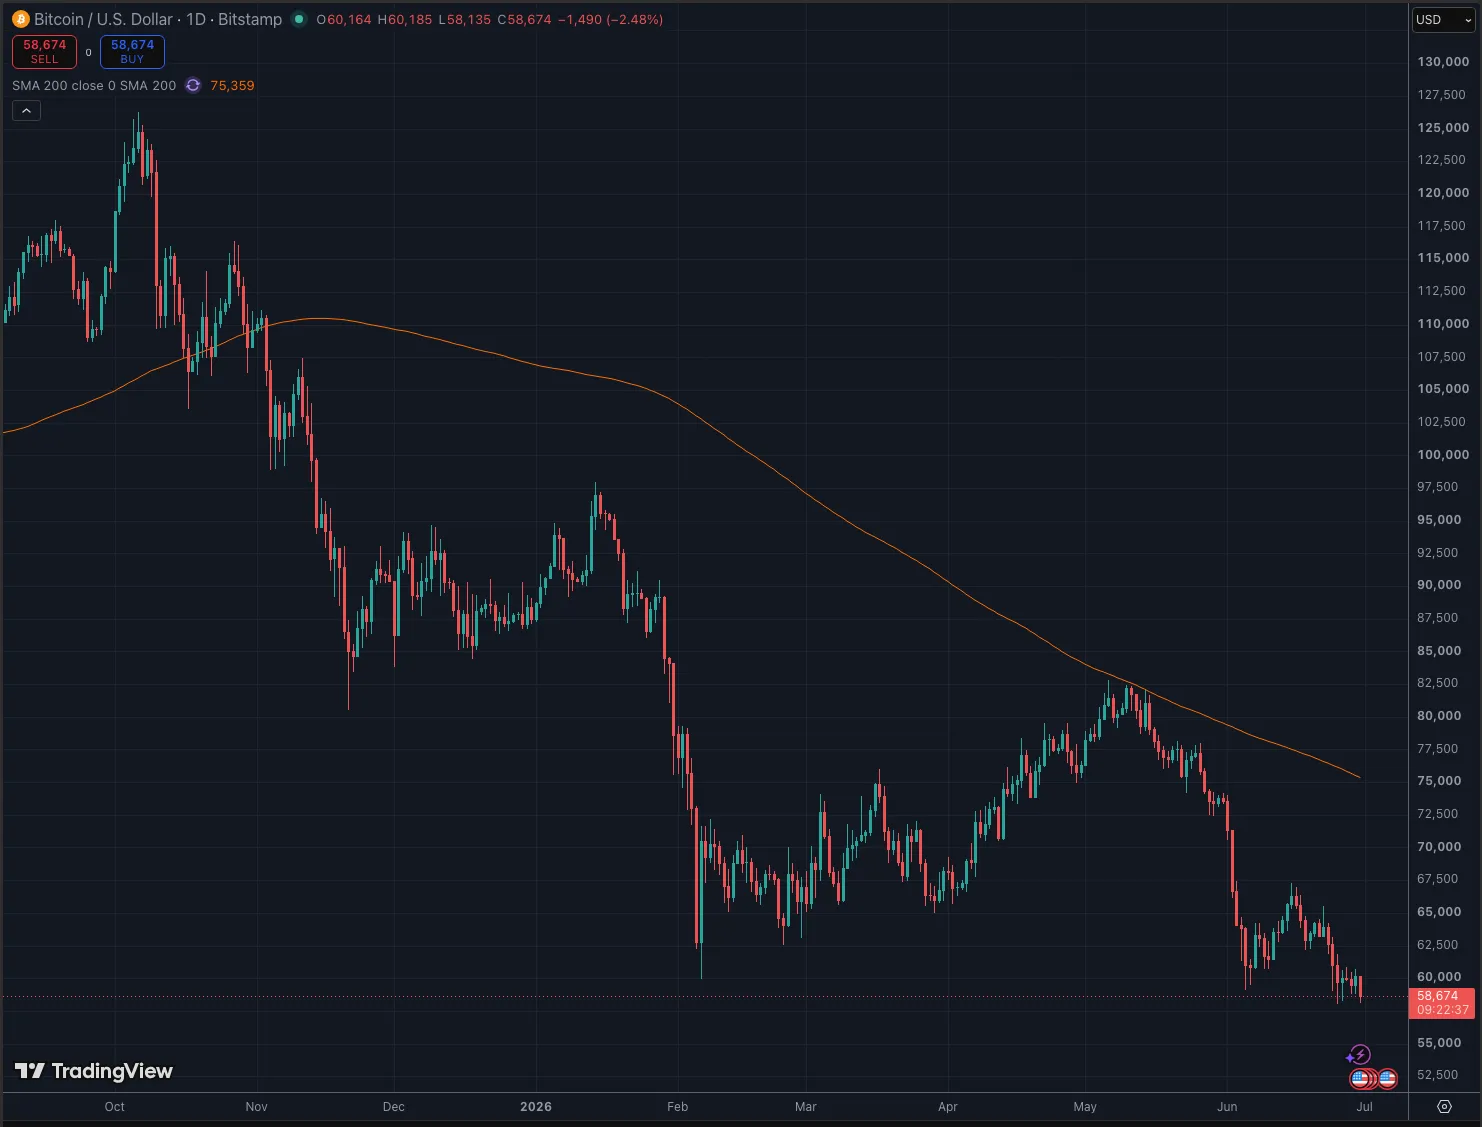
Current price is about $58,927, up by +0.23% over the last 24 hours.
· Ethereum (ETH)
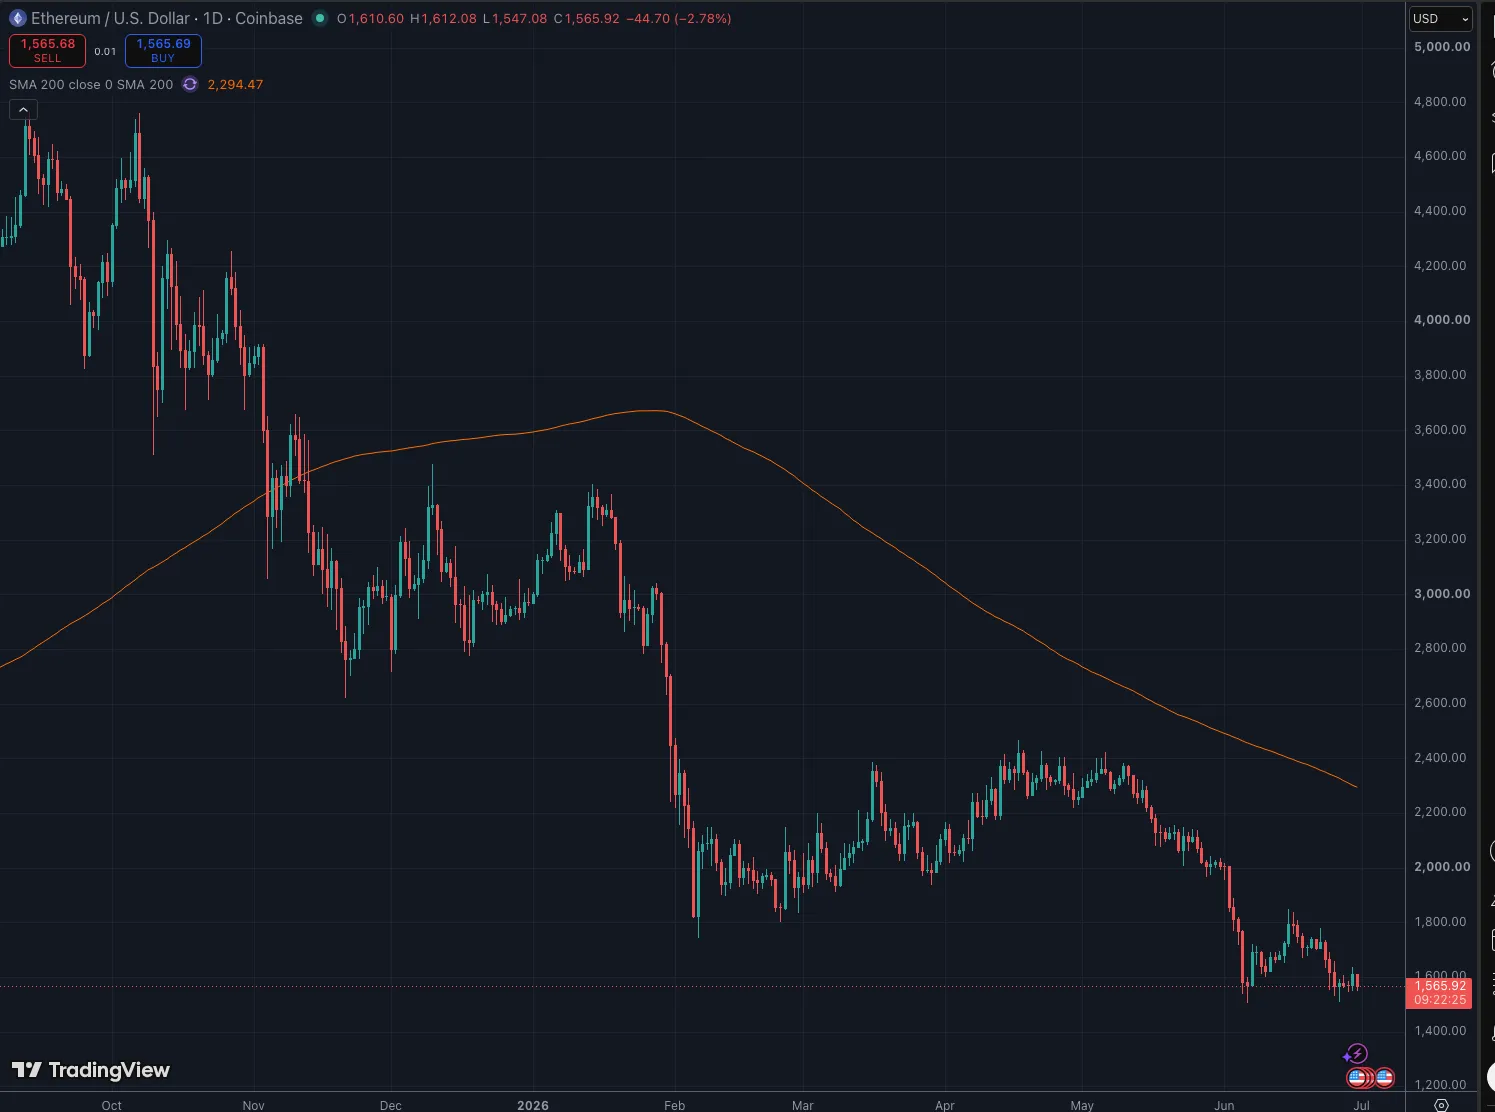
Current price is about $1,569, up by +0.60% over the last 24 hours.
· Solana (SOL)
Current price is about $73.23, up by +0.82% over the last 24 hours.
The total market capitalization of the crypto asset market is currently about $2.04 trillion (down 0.20% over the past 24 hours).
Additionally, the Bitcoin dominance, which shows Bitcoin’s share of the overall market, is about 57.8%. (Dominance tends to rise in downturns.) 57.8%. (Dominance tends to rise in downturns.)
Market sentiment, quantified as Crypto Fear & Greed Index, is at 15, indicating “Extreme Fear” among investors.
Today the market is showing a slight rebound, but Bitcoin (BTC) continues to trade around $59,000, indicating a lack of clear direction and a range-bound, downward-leaning market. In recent coverage by crypto media such as CoinDesk, it is repeatedly noted that demand from large and institutional investors remains weak, contributing to prices slipping below the $59,000 level.
Key drivers and news of today’s price movements
Today, the main reasons for the market’s heavy resistance to moving higher can be broken down into several factors.
· Continued large outflows from ETFs (exchange-traded funds)
In particular, spot ETFs for Bitcoin (BTC) show pronounced outflows by institutional investors. This June is said to have posted one of the worst monthly outflows on record (billions of dollars). This is driven by selling pressure from major institutions such as BlackRock and their so-called IBIT, and is seen as a clear sign of weak demand, weighing heavily on prices across the market.
· Macro environment (dollar strength and cross-asset correlations)
In the global economy, the U.S. dollar is strong, contributing to yen weakness and other effects in FX markets. In a strong dollar environment, risk assets like Bitcoin generally struggle to attract funds, keeping prices under pressure. Gold and silver have also pulled back, and moves in other major commodities are linked to the crypto market as a whole, contributing to declines.
· Other factors and deteriorating sentiment
MicroStrategy, a company known for holding large amounts of Bitcoin (ticker: MSTR), has seen its stock price slump. The company announced new strategies around Bitcoin holdings and other steps that have worsened market sentiment. On-chain data shows weak demand, and options markets are seeing rising demand for downside protection (puts) to hedge further declines.
· Ethereum (ETH) and altcoins contagion
Ethereum, like Bitcoin, continues to face a challenging environment, especially tokens related to DeFi showing notably weak performance. The broader risk-off mood is negatively affecting the altcoin market.
Overall, two major factors—selling pressure from institutions and the macro environment of a strong USD—are major headwinds in the current market.
Price movement since last week (about 7 days)
Focusing on the latest 7 days (about 1 week), data from CoinMarketCap show partial recoveries and signs of stabilization as follows:
· Bitcoin (BTC): +5.9% over the past 7 days
· Ethereum (ETH): +5.7% over the past 7 days
· Solana (SOL): +5.4% over the past 7 days
If we roll back the clock, Bitcoin (BTC) surpassed $62,000 and Ethereum (ETH) traded above $1,700 around mid-June. But then the severe outflows from spot ETFs exerted heavy downward pressure on the market.
On the other hand, in the most recent week, prices are less likely to fall further, with a shift toward a “mild rally” or “bottoming” move. However, this does not indicate a turning into a strong uptrend; it remains within a range after a large drop, i.e., a stabilization phase within a price band.
Looking at a 6-month horizon, Bitcoin and Ethereum have both experienced negative monthly performance, indicating that the early-year highs are still being corrected or stagnating.
Last week’s market mood suggested a wait-and-see approach pending new catalysts, but unless ETF outflows completely subside, many voices expect a robust market recovery to be unlikely.
ETF flows in the most recent 1 week (roughly June 23–29)
Latest intraday Bitcoin and Ethereum spot ETF inflows/outflows (based on CoinGlass data)
Bitcoin spot ETF shows almost daily net outflows, continuing a highly challenging trend.
· June 29: net outflow of about $231 million (approximately) from BTC ETFs
· June 25: large net outflows in the hundreds of millions (billions) of dollars
· June 26 and other dates: substantial net outflows
When summed over the week, net outflows reach tens of millions to hundreds of millions of dollars, equivalent to roughly -25,000 BTC in aggregate. BlackRock’s IBIT ETF is identified as the largest source of outflows, with Grayscale’s GBTC also affected.
Overall, there has been seven consecutive weeks of net outflows, and ETF assets under management have shrunk significantly from their mid-month peak.
· Ethereum spot ETFs
Eth spot ETF markets also show continued substantial net outflows.
· June 29: net outflow of about 19,000 ETH
· June 25: net outflow of about 50,000 ETH
· June 23–26: nearly every day shows negative net flows, with almost no days of net inflow
In dollar terms, outflows remain in the hundreds of millions, underscoring weak institutional demand for Ethereum relative to Bitcoin.
· Supplementary information:
While Bitcoin and Ethereum struggle, some funds are flowing into XRP ETFs, suggesting some market rotation away from BTC/ETH into other crypto assets.
Various data on the crypto asset market and latest trends
Market sentiment, price, and altcoin environments are as follows.
· Bitcoin Fear & Greed Index currently at 15, indicating Extreme Fear in the market.
· Current Bitcoin price: $58,528
· Long-term weakness in the altcoin market
Altcoin market has been in a prolonged downturn for nearly eight months.
On Binance-listed assets, about 84% have fallen below the 200-day moving average, signaling extreme bear market conditions.
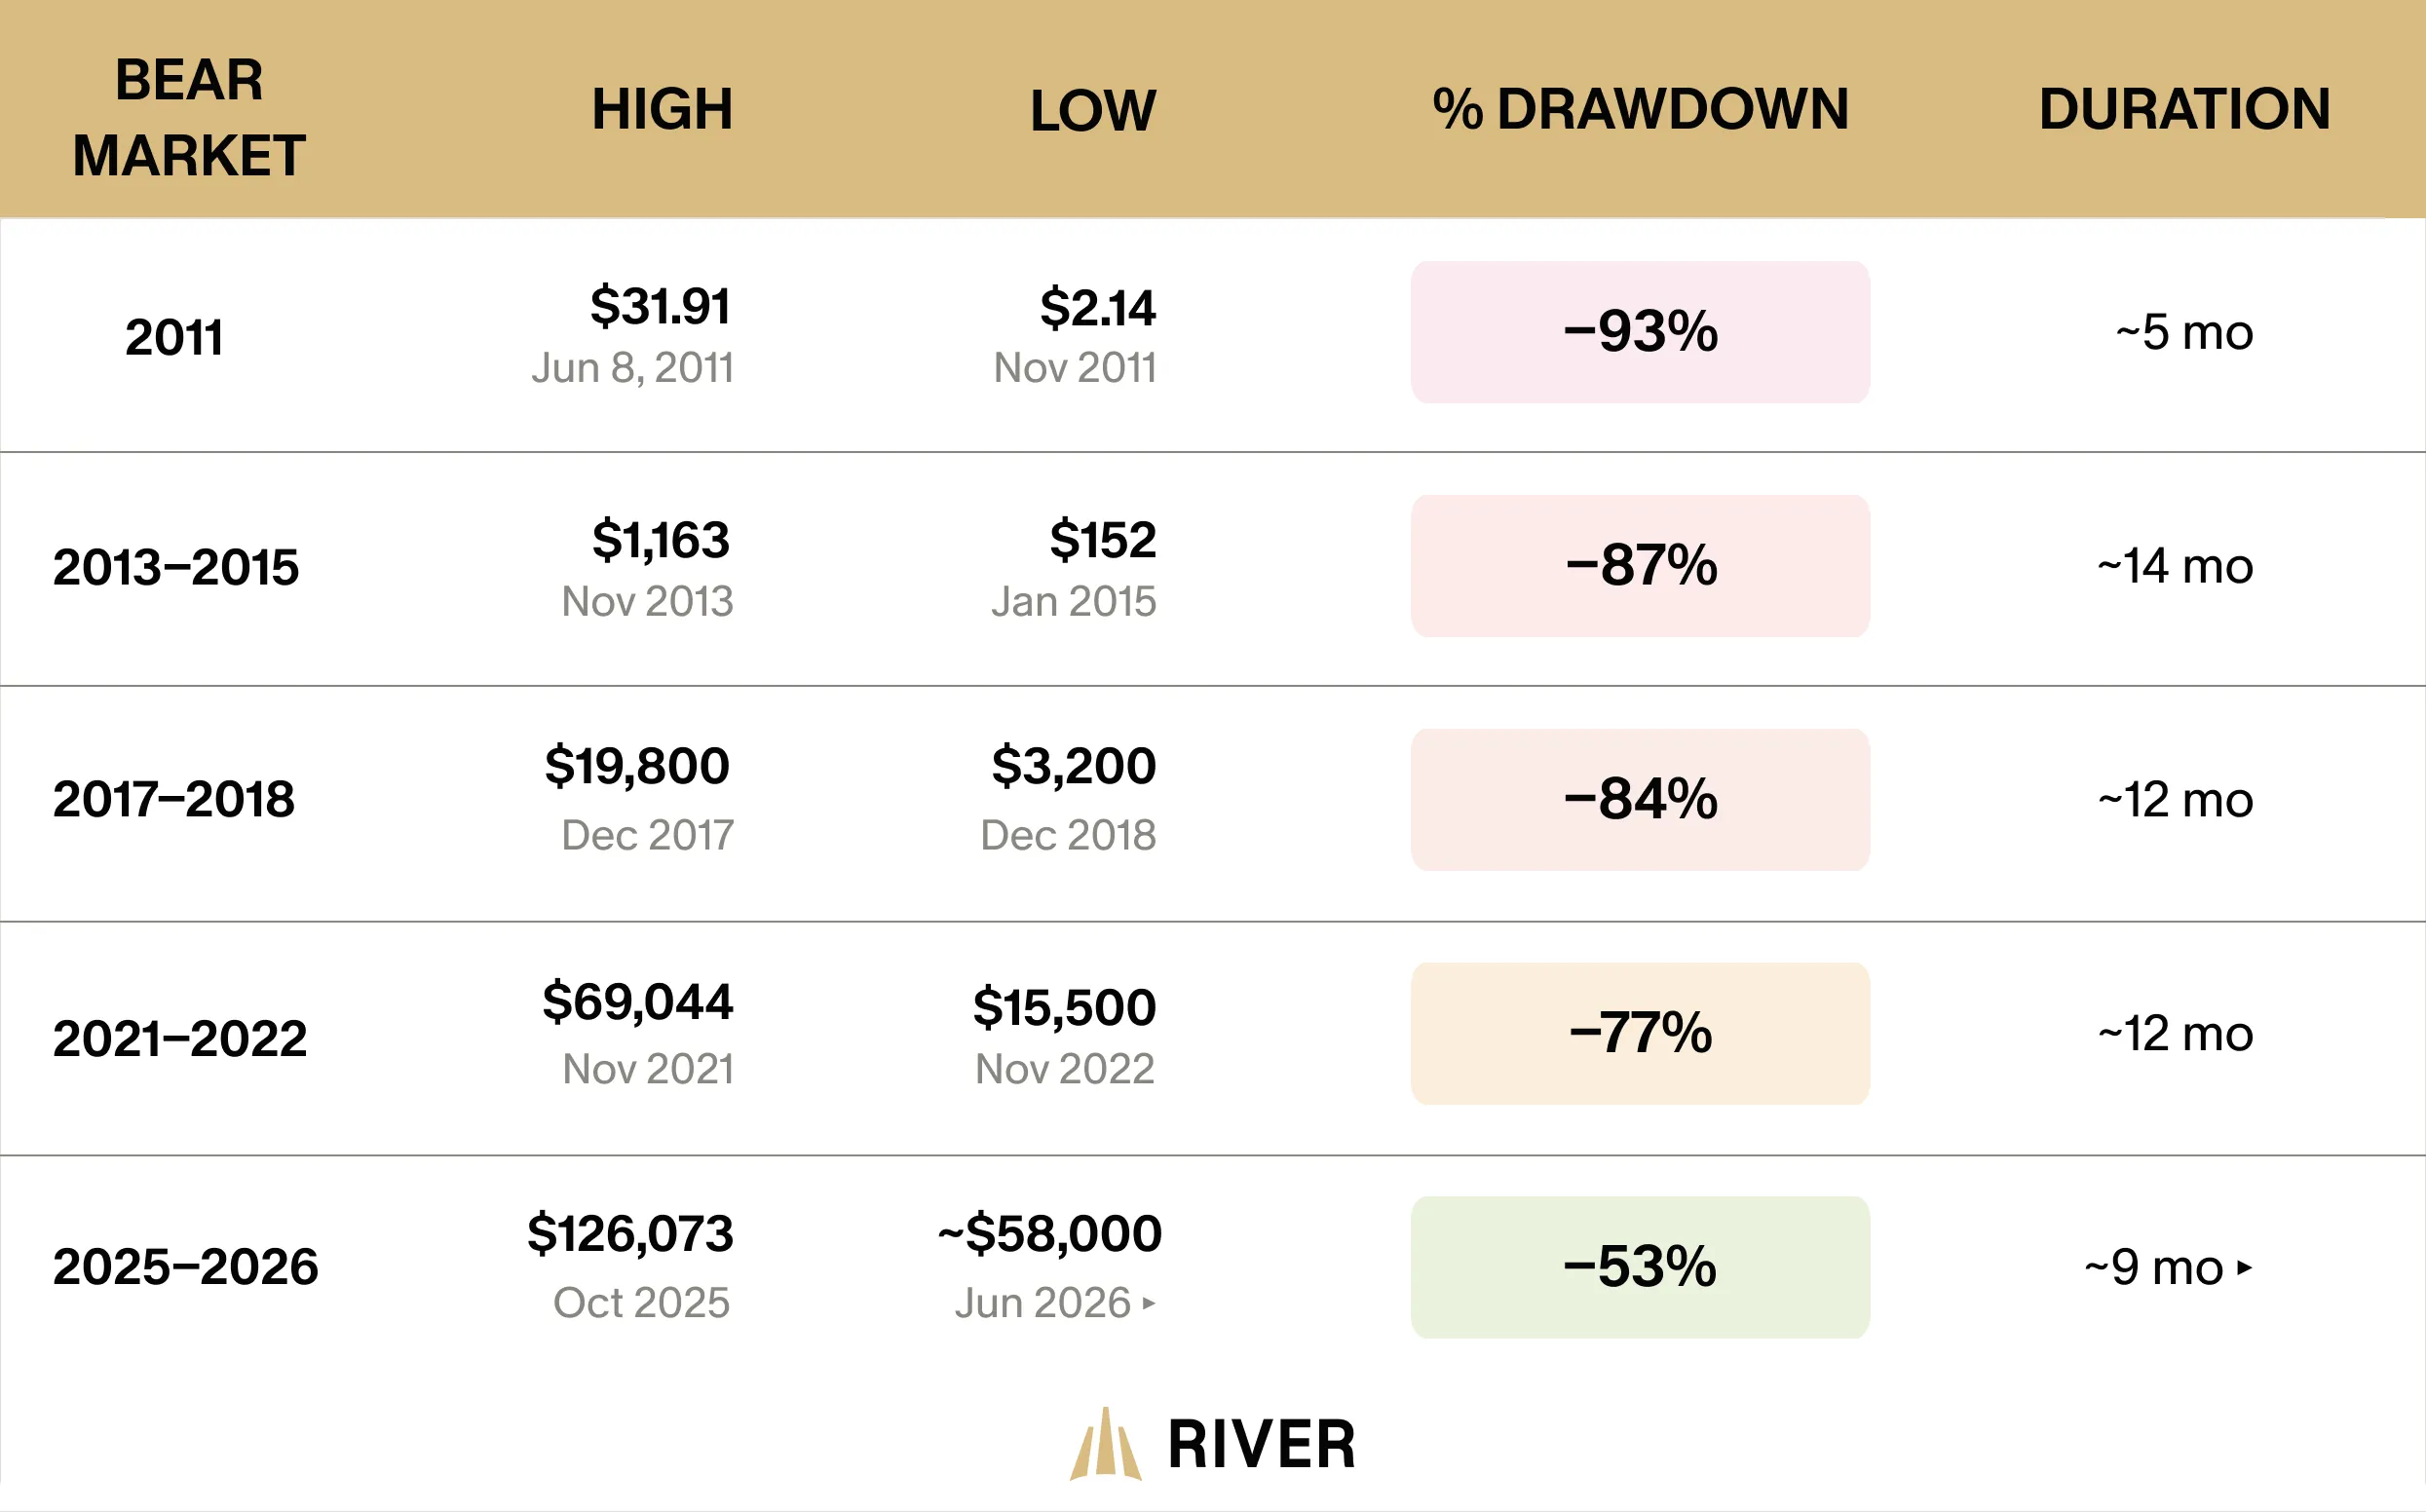
This downturn period is the second-longest since 2020 in crypto history, potentially extending beyond the previous bear market peak of about 10 months.
(This report has been delivering market-leading insights since its inception in 2016.)