
NK225 Futures MTF Dow Theory: 4-Scenario Analysis Report 2026-06-30 (for the Tokyo/Asian session)
NK225 Futures MTF Dow Theory Analysis Report
Date and time: June 30, 2026 06:02 JST / Night session close
Current value: 70,650 JPY
Target: For intraday session (6/30)
Conclusion
The night session fell to 68,800 before sharply rising, broke above 70,190 (1H retracement high), reached 70,850, and closed at 70,650. In the 4H chart, a downward and upward (retracement) movement formed, with price at a position to test the 4H 20EMA and the 20SMA (71,150) after recovering the 4H20EMA. The 1H and 15m are rising, indicating short-term buying dominance. During the day, while awaiting continued retracement, note the heaviness above 71,150 and 72,000–72,250 (Gamma walls) due to 4H downtrend retracement, and maintain selling into rallies as a balanced approach.
If 70,850 closes above, follow the retracement breakout with a long (from 71,320 to 72,000). Maintain pullbacks around 70,190–70,000 (support-turned and gamma-rich zones) for buying on dips. Recovery/overbought conditions near 71,000–71,320 and 72,000–72,250 should be limited by the retracement from 4H downtrend. If 70,190 is broken by the 1H close, downside resumes (toward 70,000 and 69,000 pins); a break below 68,800 ends the retracement. Even with 1H/15m higher, since it’s a retracement of the 4H-downtrend, protect longs at MFE early and limit selling on rallies to retracements.
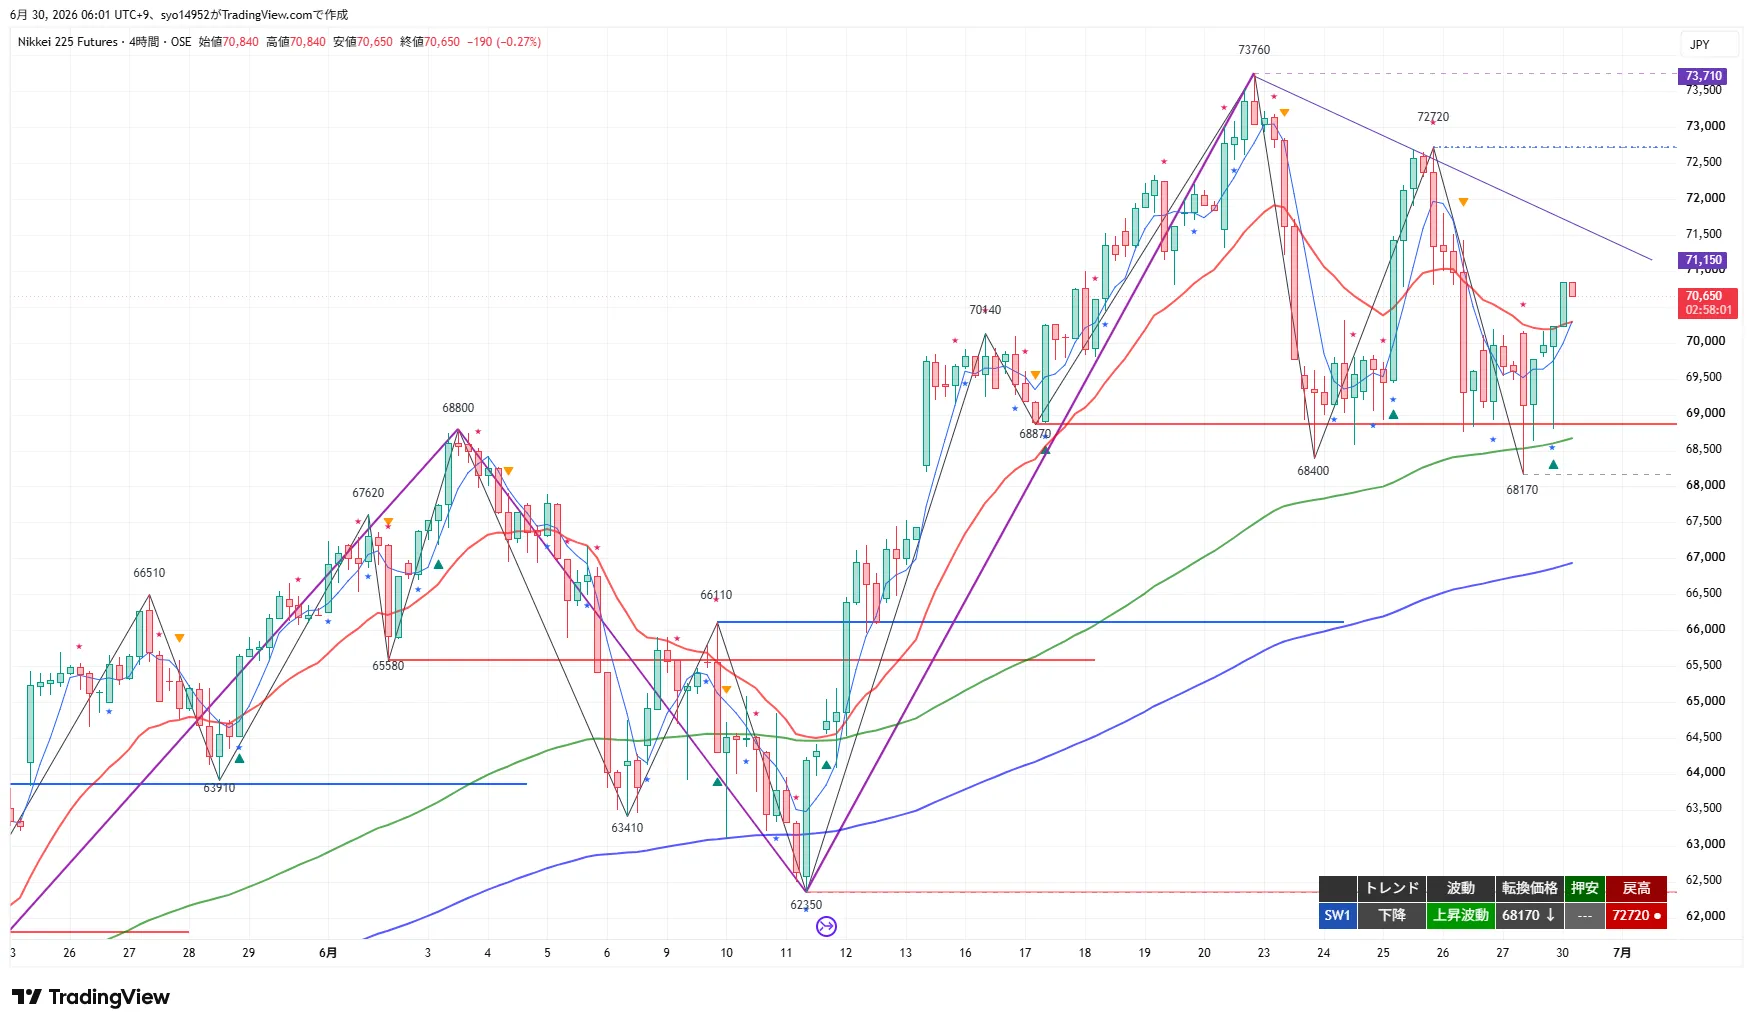
4H Analysis
The 4H chart shows a downtrend followed by an uptrend (retracement). Turning point at 68,170; no defined swing low yet; retracement high at 72,720. From 73,760 to 72,720, retracement highs have been lowered, and from 68,400 to 68,170, lows have been lowered, forming a downtrend, but a rebound has carried price back to 70,650. The price has recovered the 4H20EMA (around 70,650) and is testing the 20SMA (around 71,150); both the 20EMA and 20SMA are downward-sloping. It remains above the 120EMA (daily equivalent around 68,500) and the 200EMA.
Until a clear close above the 20EMA and 20SMA (downward sloping), the retracement remains heavy around 71,150 and 72,000–72,250 (gamma walls). On the downside, 68,170 (turning point) and 68,400 are pivotal; a break lower implies continued downward movement toward 66,110 and 62,350.
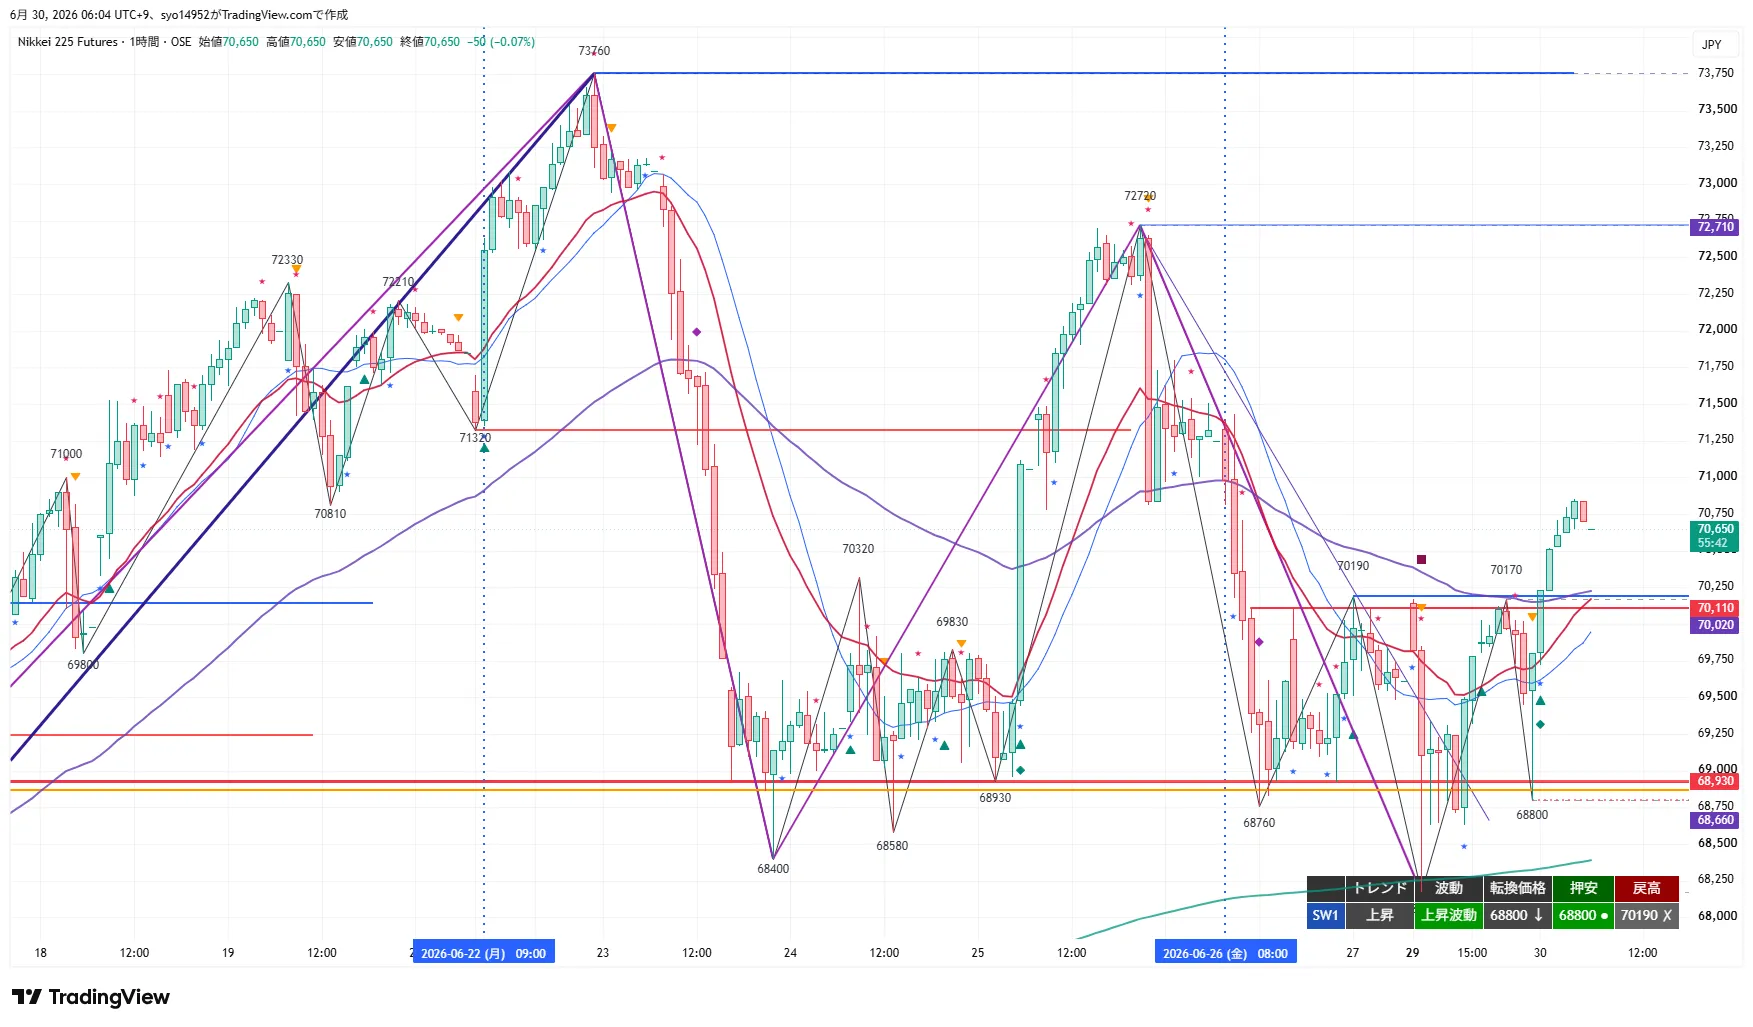
1H Analysis
The 1H chart shows up moves. Turning point at 68,800; immediate support at 68,800; retracement high at 70,190 (X breakout already occurred). From 68,800, price surged, breaking above 70,190, and retraced to 70,650. The 20EMA and 80EMA have turned up and sit above price.
Short-term sentiment is bullish; a close above 70,850 sustains the retracement, testing 71,000–71,320. Conversely, a close below 70,190 on the 1H would break the uptrend and resume a decline, with 68,800 as a key support.
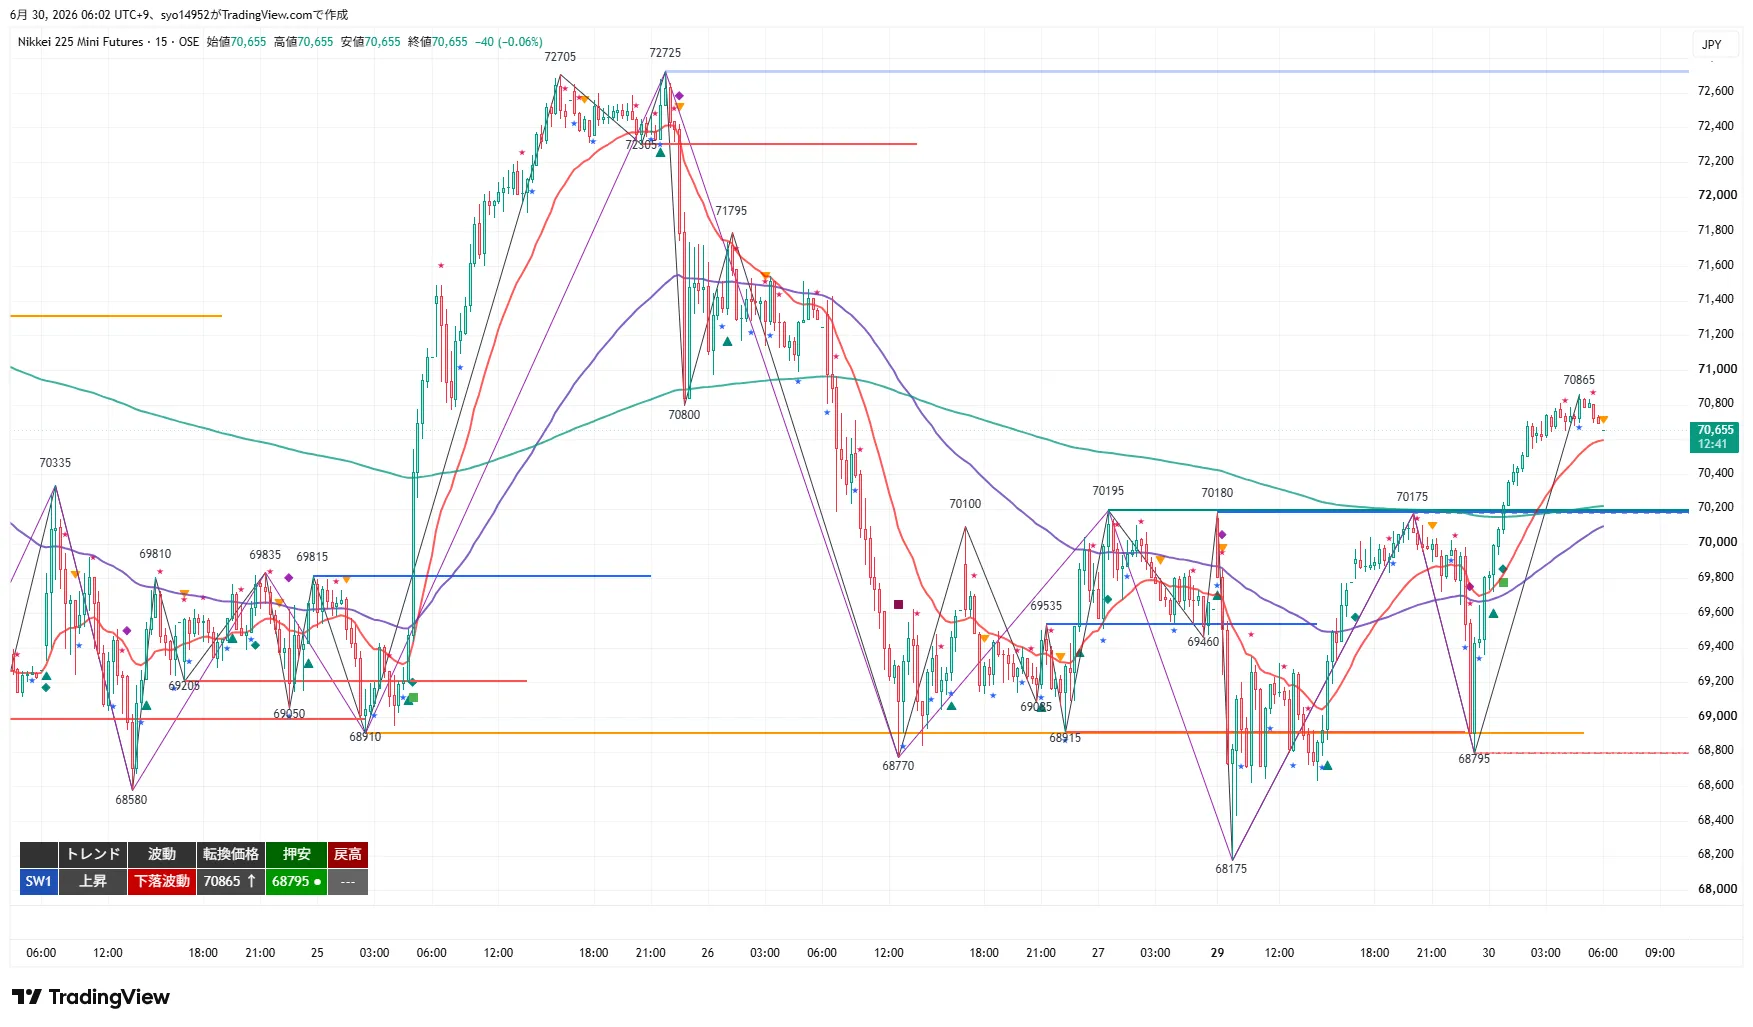
15m Analysis
The 15m chart shows up and down waves. Turning point at 70,850; immediate support at 68,800; retracement high not yet formed. After surging to 70,850, there was a small pullback to 70,650. The 20EMA and 80EMA (equivalent to 1H 20EMA) are rising and located above the 320EMA (4H 20EMA equivalent around 70,200).
If 70,850 is cleared on a 15m close, the downtrend in the retracement will revert to an upmove, resuming the retracement; a break below 70,190–70,000 (gamma band) would break the short-term structure. New swing high in the retracement is not yet formed, so watch for congestion ahead of 71,150 (4H20SMA) and 72,000–72,250 (gamma wall).
MTF State
- 4H: Downward / upward waves. Turning at 68,170; no defined pullback low; retracement high at 72,720. Within a downtrend that is lowering retracement highs and lows, price is at a stage where it recovers the 4H20EMA and tests the 20SMA (71,150). 20EMA and 20SMA are downward-sloping.
- 1H: Upward / upward waves. Turning at 68,800; support at 68,800; retracement high at 70,190 (X breakout done). Starting from 68,800, a sharp rise and breakout above 70,190. All moving averages are rising.
- 15m: Upward / downward waves. Turning at 70,850; support at 68,800; retracement high not yet formed. Sharp rise to 70,850 followed by a small drop to 70,650. Located above the 320EMA (4H 20EMA equivalent).
- Consistency: In a 4H down-up retracement, 1H and 15m rise while higher timeframes are in a retracement within a downtrend. Higher timeframe takes precedence; the core strategy remains selling on rallies, but while 1H/15m rise continues, place equal emphasis on buying the dips and breakout-following long positions, up to 71,000–71,150 (4H20SMA band) and 72,000–72,250 (gamma walls) as price recovers.
OI and Gamma Analysis
OI and Gamma are based on 6/29 data, front-month July (SQ 7/10). Gamma indicates how heavily dealers hedge when price moves, acting as magnets/walls at strike levels (gex_mag). The current price of 70,650 sits roughly midway between the lower pin and the upper wall.
- Pin candidate = C69,000: gex_mag 33,327 makes it the strongest magnet below price; price tends to gravitate toward this level on downside moves. Aligns with OI center of gravity.
- Upper wall = C72,000 (gex_mag 28,797; OI 6,045; today’s ΔOI +280 increases thickness) / C72,250 (12,572): The strongest upper wall; 72,000–72,250 is a heavy resistance. A clear close above could trigger hedge buybacks accelerating the rally, but given the retracement in the 4H downtrend, whether price can extend beyond this zone is key.
- Nearby price levels: Immediate support at C70,000 (16,140) thick barrier, with nearby C70,500 (8,765) and C71,000 (7,036) as mid-level levels. Downside supports at P70,000 (8,690), P69,000 (9,339), and P68,000 (9,745).
- Direction clues: For the 6/26 weekly basis (ATM ≈ 69,375), puts near ATM are external shorts gamma for foreign hedging (downward amplification). Current 70,650 is about 1,150 above the baseline spot 69,500. At the current level, focus on the size of the structural levels (walls and floors) rather than direction. Futures positions are being reduced (Nikkei225 Large Sep ΔOI −3,982). Gamma strongest near expiration (SQ 7/10).
Important Prices
- 73,760 JPY: 4H/ daily retracement high and recent peak. Primary upside target.
- 72,720 JPY: 4H retracement high (26/6 high; not yet exceeded 73,760). Upper bound for the 4H downtrend.
- 72,000–72,250 JPY: The strongest walls by OI and Gamma (C72,000 and C72,250). Heavy resistance on retracements.
- 71,320 JPY: 1H level (old pullback low).
- 71,150 JPY: 4H 20SMA. Upper retracement resistance band.
- 71,000 JPY: Gamma zone (C71,000). Zone 1 retracement selling.
- 70,850 JPY: 15m turning point and recent high. Trigger for breakout-following long.
- 70,650 JPY: Current price / night close (near 4H20EMA).
- 70,500 JPY: Gamma zone (C70,500; today’s ΔOI +141 new).
- 70,190 JPY: 1H retracement high (X breakout done) = support-turned. Zone 1 upper bound.
- 70,000 JPY: Thick gamma zone (C70,000). Support-turned point and Zone 1 lower bound.
- 69,000 JPY: Gamma pin candidate (C69,000 strongest) = magnet/floor; OI centroid.
- 68,800 JPY: 1H/15m pullback low. Short-term support axis. Zone 2 lower bound.
- 68,170 JPY: Most recent low / 4H turning price. Break would extend the 4H downtrend.
- 68,000 JPY: Lower gamma zone (P68,000).
- 65,000 JPY: OI and Gamma floor (put wall).
- 62,350 JPY: 4H/daily structural low. Most important downside.
Trading Ideas
① Breakout-following long
- Trigger: Clear above 70,850 (15m turning point and recent high) on a 15m close (continuation of retracement).
- Forecast: After a breakout, observe a pullback toward breakout price vicinity or the upward-tilted 20MA on 1m/5m to time the wave turn (back-entry, breakout-price basis).
- Entry condition: Price recovers above 70,850 on a 1H close.
- Stop loss/invalidations: If breakout leg falls below 70,400, and the main position below 70,190.
- Targets: 71,320 (partial profit + cost basis) and 72,000.
- RR: T1 71,320 ≈ 1.0 / T2 72,000 ≈ 2.6. Since T1 is around 1.0, place focus on the main lot.
- OI/Gamma: Key levels through 71,000 (zone) and 71,150 (4H20SMA); 72,000–72,250 gamma wall heavy upper bound.
- MFE protection: Trail to break-even or slight profit at +200, +300 to secure at least +100; given the 4H downtrend retracement, avoid chasing highs and protect early.
② Buying on dips (Long)
- Standard conditions: Shallow pullback zone 1: 70,190–70,000 (1H retracement high X turning into support to C70,000 thick gamma zone) or deep pullback zone 2: 69,800–68,800 (old retracement high to 1H/15m pullback lows). Confirm rebound shape with 15m close.
- Forecast: Shallow pullback target 70,100 (LC69,700); deep pullback target 69,000 (LC68,630; near C69,000 pin). Since it’s a retracement of 4H down, limit rebound checks to around 70,000 (thick zone) and 69,000 (pin/floors), validating near the 20MA (rise/flat) region.
- Entry condition: 70,850 recovers on 1H close.
- Stop loss/invalidations: If 69,700 breaks on a deep pullback (68,630) and main entry breaks 68,800. Full exit if 68,800 breaks.
- Targets: 70,850 (partial profit + cost basis) and 71,320.
- RR: T1 70,850 ≈ 1.9 / T2 71,320 ≈ 3.1.
- MFE protection: Trail with +200 to break-even or slight profit, +300 to secure at least +100 or trail. Due to rising 1H/15m in a downtrend retracement, protect earlier; if trigger foot reaches T1, reassess.
③ Returning sell (Short)
- Standard: Retracement zone 1 71,000–71,320 (C71,000 gamma zone, 4H20SMA band) shows slowing on a 15m close. Deep retracement sets Zone 2 at 72,000–72,250 (strongest gamma wall).
- Forecast: Confirm retracement stall with 15m close (target 71,050 as a rule). With a background of 4H down, this is a trend-following move; since 1H/15m rise, avoid aggressive entries above 20MA.
- Entry condition: Break 70,190 on a 1H close (collapse of 1H up move = downtrend resumes).
- Stop loss/invalidations: If 71,400 recovers, main position recovers 72,250. Strong invalidation at 72,720 (4H retracement high recovery → reopening scenario).
- Targets: 70,000 (partial profit + cost basis in thick gamma, Zone 1 lower bound), 69,000 (pin) / 68,800.
- RR: T1 70,000 ≈ 3.0 / T2 69,000 ≈ 5.9.
- MFE protection: Trail at +200 to break-even or slight profit, +300 to secure at least +100 or trail; since 1H/15m are rising, keep to retracement selling only and avoid chasing; if the entry foot reaches T1, skip.
④ Breakout-following short
- Trigger: Break below 68,800 (1H/15m pullback low) on a 15m close (end of retracement and return to 4H downmove).
- Forecast: After the break, observe a pullback toward the breakout price vicinity, or toward the tilted 20MA on very short timeframes (1m/5m) for wave-turn timing (back-entry, breakout-price basis).
- Entry condition: Break below 68,170 on a 1H close (latest low and 4H turning point break = continuing down move).
- Stop loss/invalidations: If 69,130 recovers for the leading leg, main position recovers 69,800. Strong invalidation at 70,190 leading to full exit.
- Targets: 68,000 (partial profit + cost basis in thick gamma = Zone), 67,000 / 65,000 (OI floor).
- RR: T1 68,000 ≈ 2.4 / T2 67,000 ≈ 5.5.
- OI and Gamma: The strongest pin is C69,000 (magnet/floor), with 68,170 as support band; 4H retracement and 1H/15m up moves only later confirm a deeper decline. Watch out for false breaks and quick reversals in the low-price zone.
- MFE protection: Trail to break-even or slight profit at +200, +300 to secure at least +100 or trail. Since 1H/15m are rising, avoid deep chasing; if trigger is confirmed and T1 is reached, consider skipping.
Current actions
- Most important line 1: 70,850. A break above on a 15m close confirms continuation of the retracement breakout long (71,320 → 72,000). If it stalls near 71,000–71,320 (4H 20SMA band, gamma zone), consider selling on rallies.
- Most important line 2: 70,190–70,000 (support-turned, gamma-rich) / 68,800 (end of retracement). Maintain the dip and look for a rebound as a dip-buy. If 70,190 is breached on a 1H close, downside resumes toward 69,000 pin; a break below 68,800 ends the retracement and warns of 4H down move.
- Market tone: 4H is in a downtrend retracement phase, but 1H and 15m are rising, indicating short-term buying pressure. Keep a baseline of selling into rallies, but be mindful of the heaviness above 71,150 and 72,000–72,250 while watching the 69,000 pin on the downside; avoid excessive chasing on both sides.
Entry prices, triggers, and stop levels are set based on the chart shapes at the close (turning prices, support lows, and retracement highs of each timeframe). If the structure changes over time, unless the higher timeframe structure changes, adjust entry prices based on the lower-timeframe wave-turn prices (e.g., a short-term chart entering a retracement and then turning back up) to better match actual conditions, using the originally set values as reference.
Note: This report is for information purposes and not investment advice; please make your own investment decisions and bear responsibility for them.