
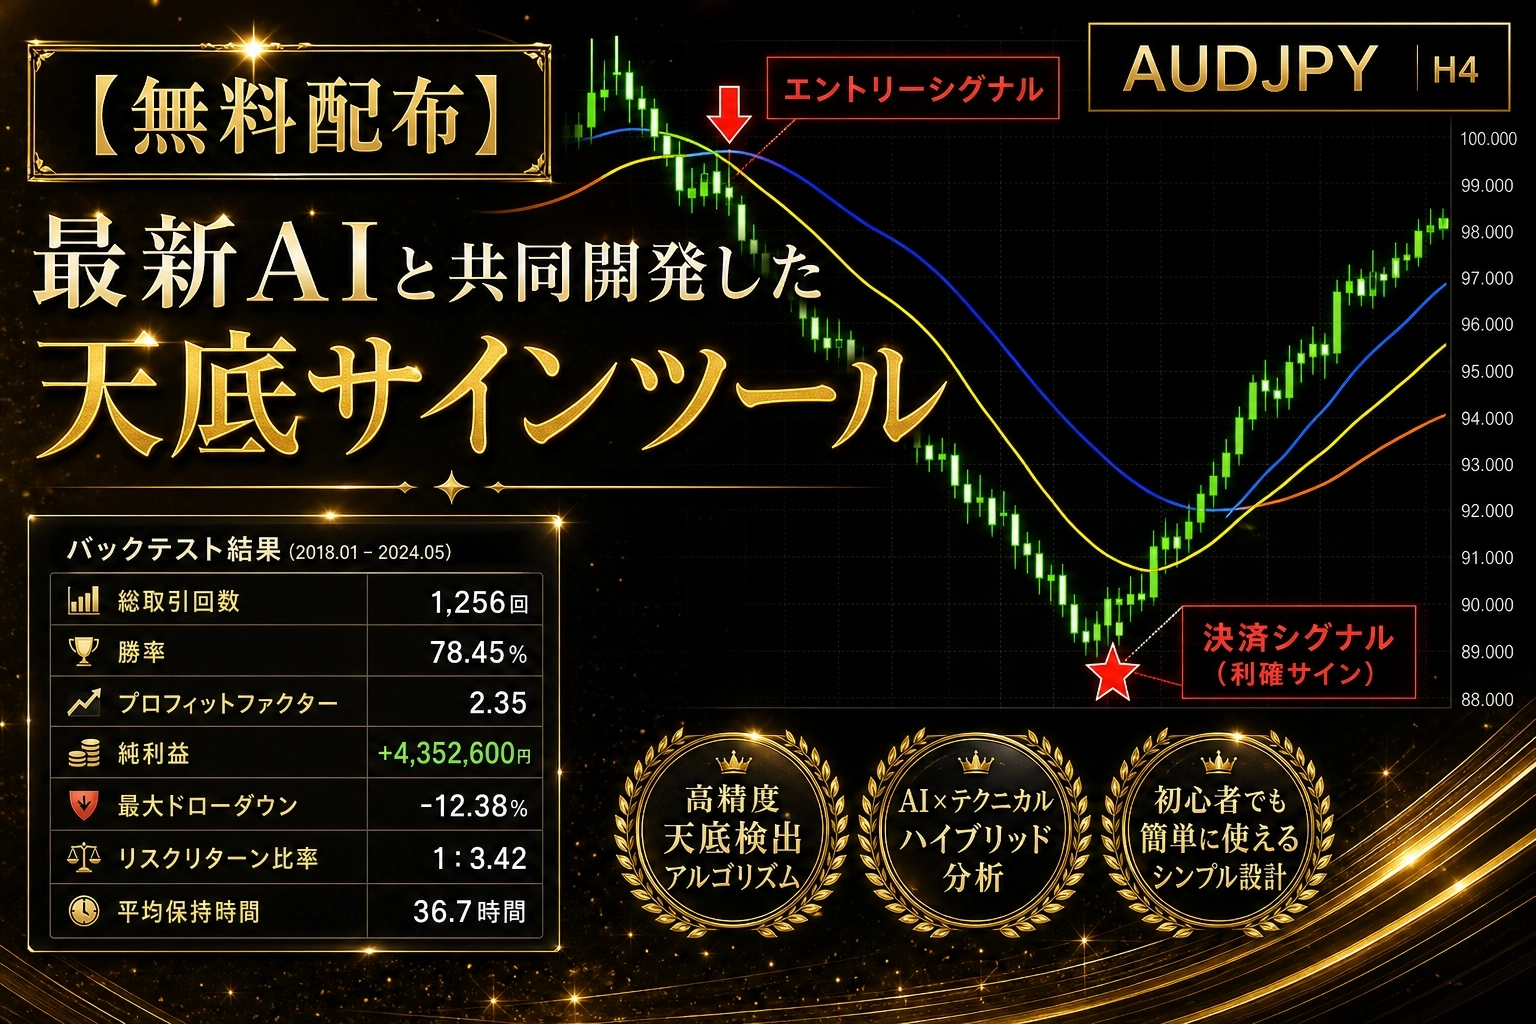
[Free distribution] Why can you reach the “base of the rebound”? A method that looks like a contrarian despite being a trend-following approach, and a market-timing tool created with AI
“I want a sign at the top and bottom” is something every trader has thought at least once.
But in hindsight the tops and bottoms are obvious, while in real time they are not at all.
This time, after properly organizing the idea of “targeting the tops and bottoms,” we will freely distribute a tool that captures those tops and bottoms.
What exactly is the “top and bottom” we should aim for
When you hear “top and bottom,” you might want to predict the ultimate point of the trend, but that is nearly impossible.
What you should really aim for are not the extremes of the trend, but the low of a pullback and the high of a rebound in the middle of the trend.
In Elliott Wave terms, this is the starting point of waves 3 and 5—basically, “a pullback in an uptrend, then the price begins to rise again.”
The overall trend hasn’t broken, but the price temporarily dropped. Capturing this looks like counter-trend trading (buying on the dip), but in reality it is riding the major move (following the trend).
This structure—appearing as counter-trend while actually being trend-following—is the core of the tops-and-bottoms targeting.
How to determine the “low of the pullback”
Once the target area is decided, all that remains is to translate it into criteria. There are three layers of thinking.
First is trend confirmation. The moving averages (EMA) with periods 21, 50, and 100 must be in alignment in order (perfect order).
When the three lines are neatly ordered, the price trend is clearer, acting as a filter: “Is this a favorable market to aim for a pullback?”
Second is pullback confirmation. If RSI falls into the oversold zone (around 30) and then begins to recover, this is seen as the initial bounce off the bottom: a trigger for entry.
Third, the most effective is the higher-timeframe filter. Look at the direction of the moving averages two levels up from the main timeframe (e.g., if main is M5, look at M30; if main is H1, look at D1). Do not take signals that go against the larger trend. This greatly reduces the typical reverse-trend loss when misreading a pullback as a reversal.
Only when all four conditions—three-layer trend alignment, RSI recovery, and higher-timeframe agreement—are met will the arrow appear. The criteria are strict, so signals are few, but that was the aim: a tool that only speaks up at the decisive moment.
We turned this idea into a real product
So, we fed the “perfect order + RSI recovery + higher-timeframe filter” entirely to AI and translated it into an MT4 indicator: EMA_RSI_MTF.
It checks the larger trend using higher-timeframe moving average directions and only allows BUY when periods 21, 50, 100 are aligned (SELL when opposite). Moreover, when RSI (period 5) recovers from the bottom, it marks the buy starting point; when price moves down from the top, it marks the sell starting point. When all four conditions are met (AND), an arrow appears. Just by attaching it, a quick backtest runs, and the panel at the bottom right shows win rate, PF, expected value, maximum drawdown, and recommended lot size, so you can verify on the spot whether this approach works for your market.
In tests with AUD/JPY on M30 (higher timeframe H4), signals appeared at the exact entry to the downside and at the subsequent bottom, exactly where they were desired. Although the number of trades in testing is still small, the results align with a low-risk, high-reward pattern and the conceptual direction feels correct.
Available for free distribution
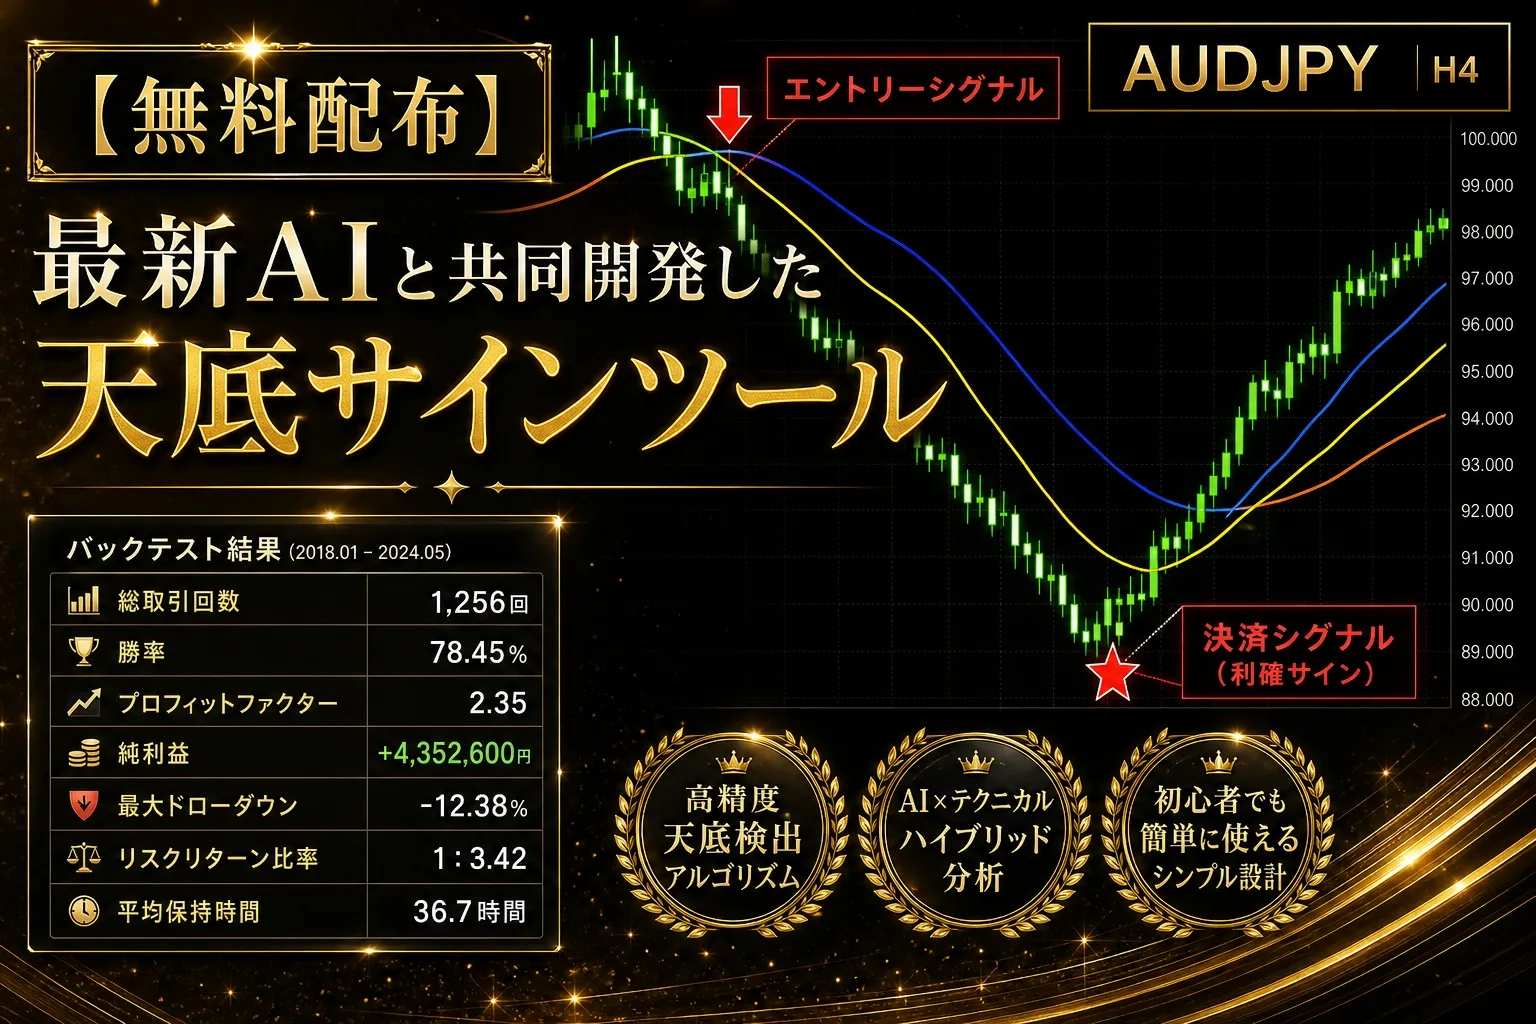
The tool is named EMA_RSI_MTF; it is an MT4 indicator.