
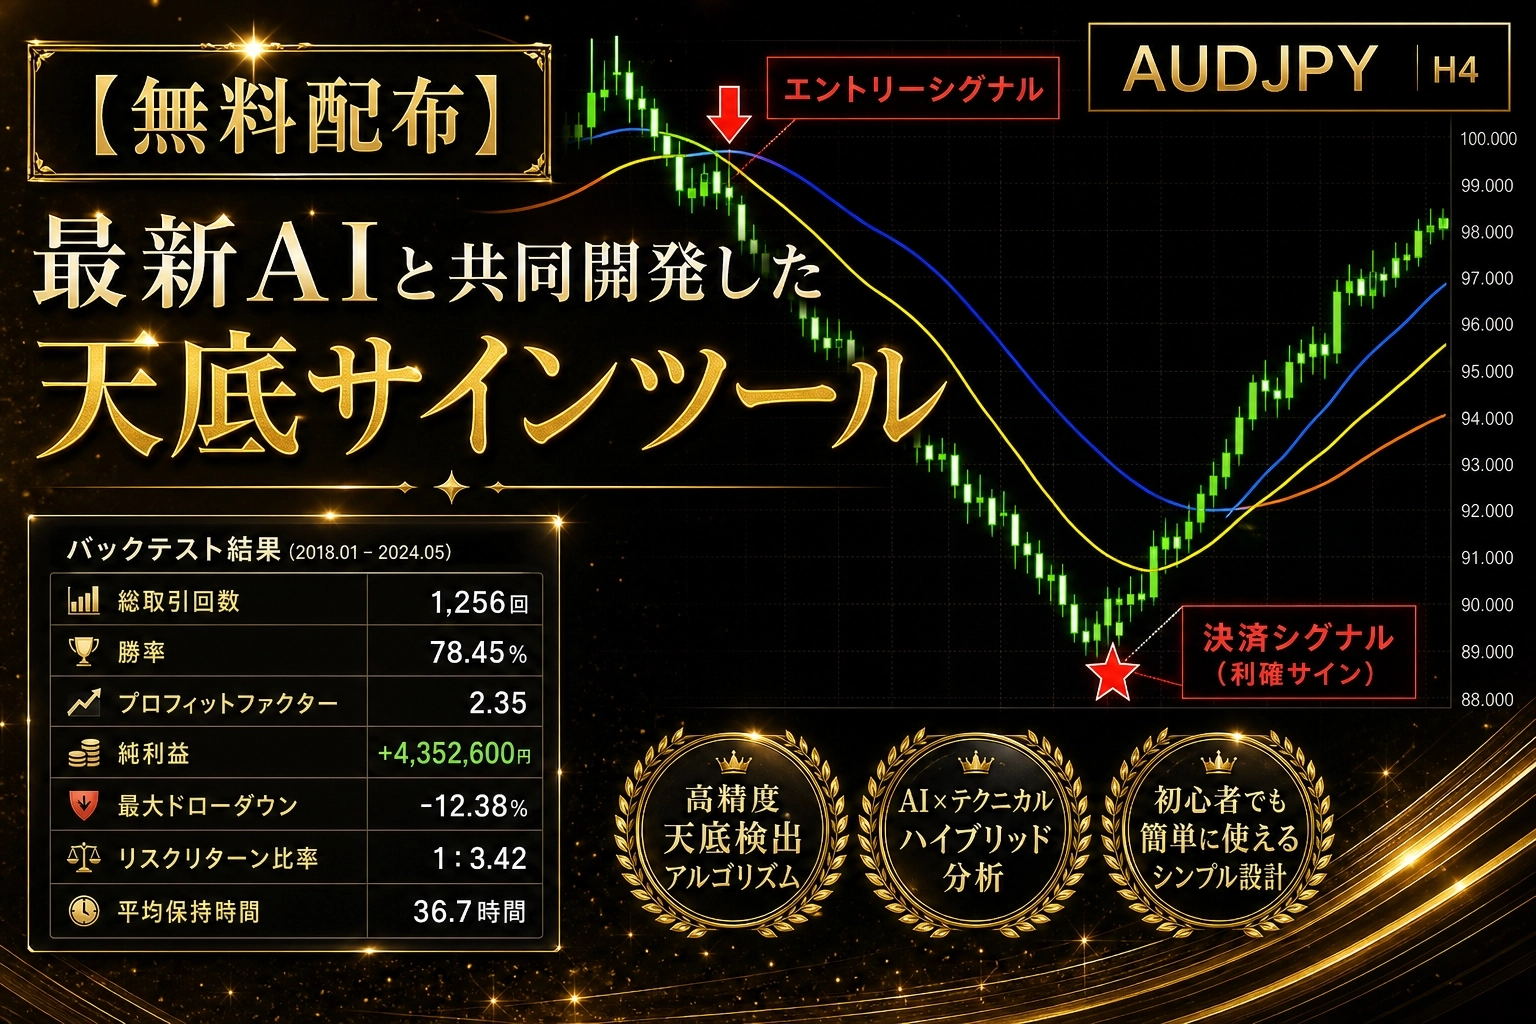
[Free distribution] Aiming for the shape of small loss and large profit: The counter-trend tool of “overreaction rebound” created with AI
This time the topic is「A tool that captures rebounds at the edge of Bollinger Bands」
I want a signal at the moment price bounces off the overshoot (the upper and lower bands).
Since you don’t know until you try, I started by consulting AI as usual.
Idea for the method
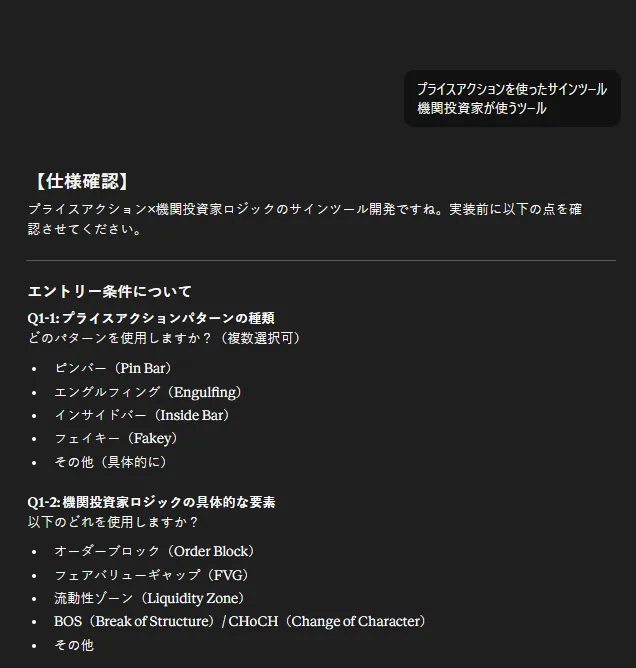
First I roughly pitched a “signal tool using price action,” and it suggested various candidates.
So I conveyed my image simply. “I want to buy when price touches the edge of the Bollinger Band and then moves back.”
AI clarified, “By combining ‘band touch = overshoot’ and ‘RSI rebound = initial move back,’ that exactly matches your image.”
In short「Touch the lower band and rebound from oversold → BUY, touch the upper band and rebound from overbought → SELL」that’s what it means.
Having AI write the spec
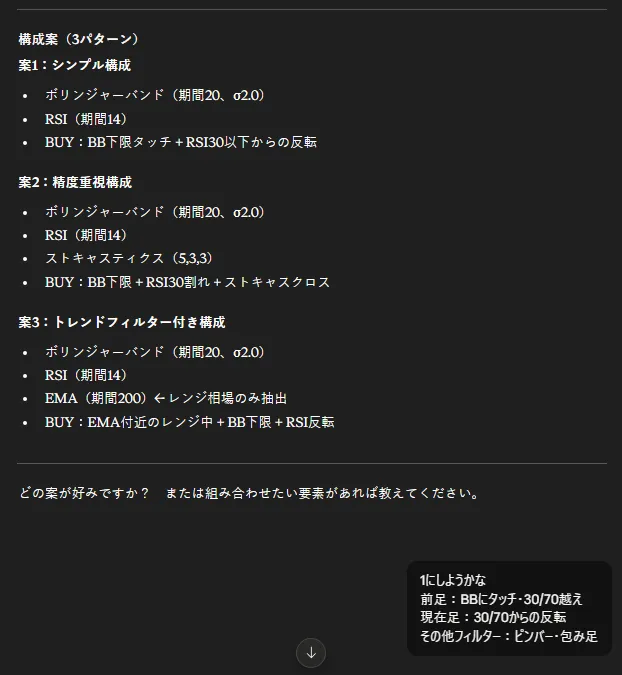
I chose the simplest option「Bollinger Bands + RSI」as a plan.
If price touches the lower BB (−2σ) → RSI is 30 or below at that moment → next bar RSI crosses above 30 → interpret as a bottom and BUY.
For SELL, the opposite: touch the upper band (+2σ) and RSI is 70 or above → if RSI crosses below 70, it’s a retracement sell.
However, with just this, you could get trapped in a band-walk by going one-way along the band. I conveyed that concern, and AI agreed, “That intuition is correct.”
What I added here is a pinbar filter. Only allow rebounds when the bullish or bearish candle has a long wick (lower wick or upper wick longer than the body).
The idea is to re-confirm the “touch and return” fact with the candle shape itself.
Settings: BB period 20, 2.0 standard deviations; RSI period 14 with 30/70; pinbar requires wick at least 1.5 times the body.
Settlement can be either fixed pips or BB-width linked, and I also built in logic to settle when touching the opposite band.
Have AI fully implement the code
Once the spec was solid, I handed it off and asked “Make this.” I also added features to show past signal positions with arrows and a simple backtest panel (trades, win rate, total pips, max DD, PF, expected value, recommended lot size).
I wanted to see on the chart right away, “How did this logic perform in the past?”
Verification results
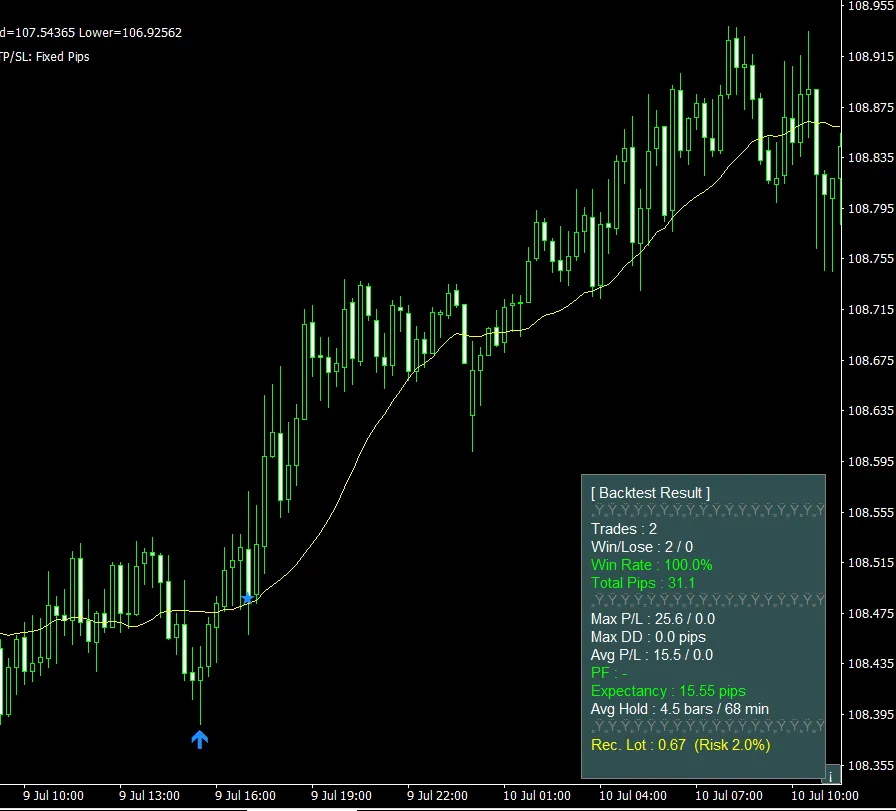
This is what it looks like when finished.
Red arrows at the top where prices are overbought (SELL), blue arrows where price rebounds from being oversold at the lower edge (BUY).
While held, entry, take profit and stop loss lines are drawn, so you can instantly see where you’d take profit or cut losses.
It did appear at the exact “edge of overshoot” that you wanted.
The panel at the bottom right summarizes win rate and PF, so you can see how the numbers move in real time as you tweak settings.
Being a contrarian approach, structurally it’s weak to band-walks. The pinbar filter reduces signals, so fewer signals occur. But that’s expected. The aim was to have signals only when an overshoot is followed by a rebound.
About the numbers, honestly with a small sample size you can’t say much yet. Treat the panel values as rough guidance, and test sufficiently with your currency pair and timeframe.
The final version “BB_RSI_Reversal_Signal” will be freely distributed
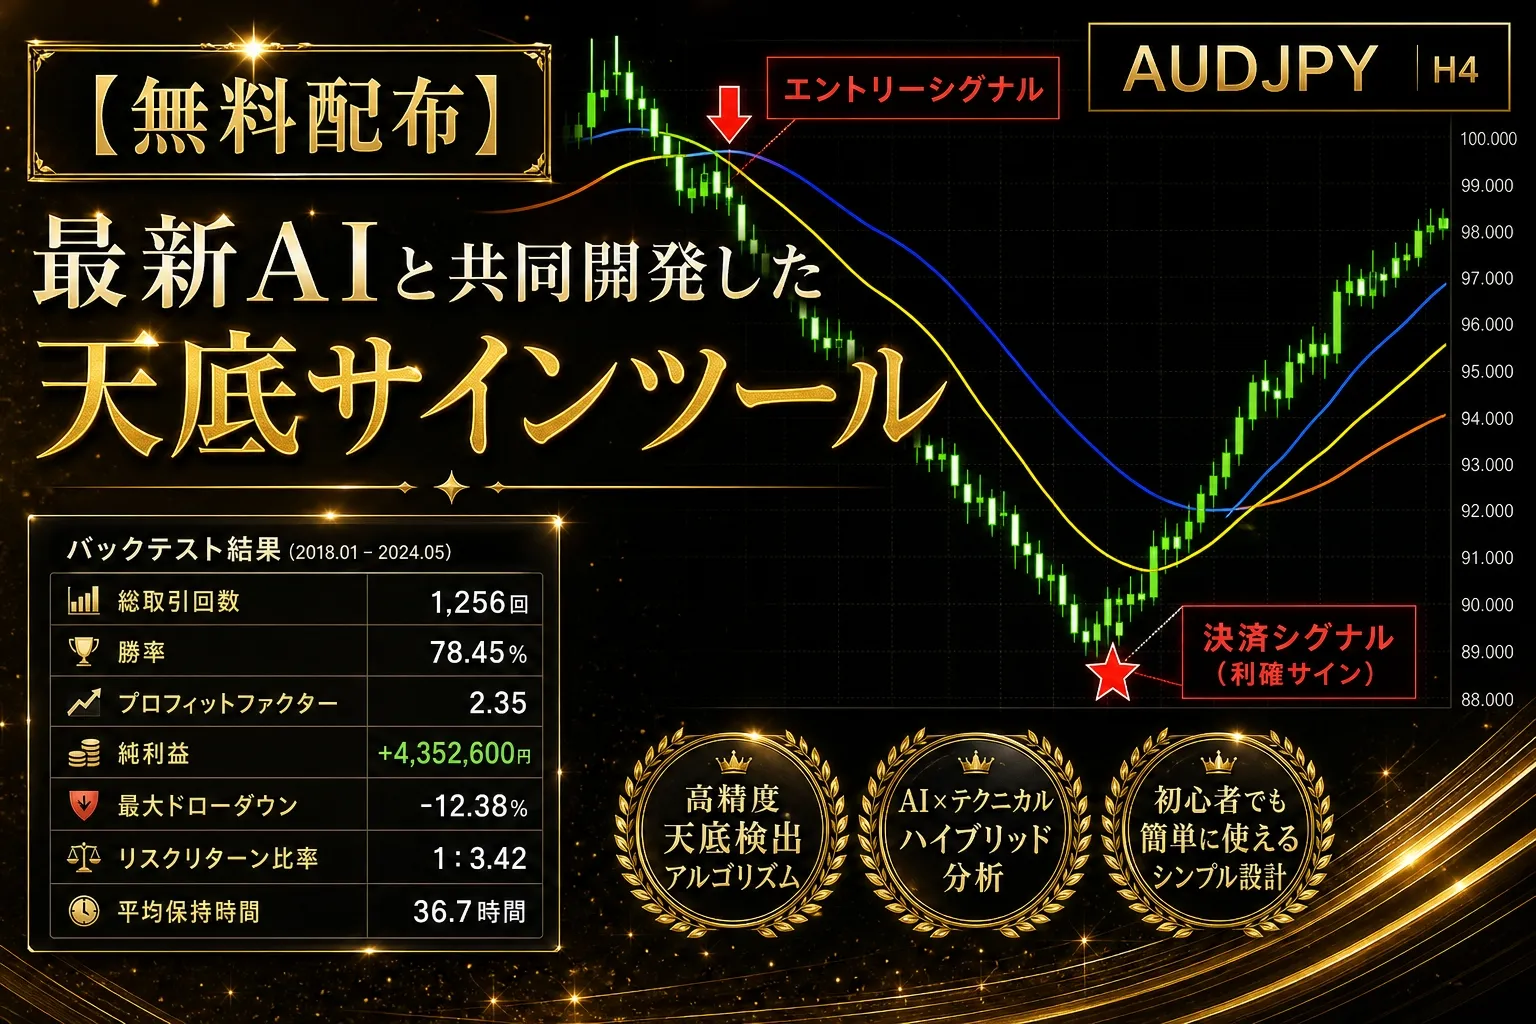
The tool name is BB_RSI_Reversal_Signal, an MT4 indicator.
As described above, the logic is,Only when the four conditions align—BB (20, 2σ) edge touch + RSI (14) rebound cross + pinbar confirmation—will an arrow appear.Settlement can be chosen as fixed pips / BB-width linked / or from touching the opposite band.
▶ Free distribution page is here ⇩